Four years ago, we stepped on some big toes with our developer-first performance monitoring. Since then thousands of software teams have adopted our modern APM solution. But while Performance checks off a lot of boxes, some dev teams juggle separate tools for metrics, leading to a fractured experience. And honestly, what good is a metric without all the context you get from Sentry? Not very – it makes tying problems back to underlying errors or performance issues unnecessarily difficult. Well, problem solved. Sentry’s Metrics is now in beta.
As we teased during our first launch week, Metrics was in its infancy. Today, it’s in beta and free to use (watch our launch week announcement here) – eligible users will now see Metrics in their Sentry accounts (if you don’t see Metrics yet, sign up here, and we will give you access). This isn’t just another tool; it’s your new best friend for tracking the data points that matter most to you over time. With Metrics, you can pinpoint and resolve issues with correlated traces, ensuring your product/service/code is always running as intended.
Teams can monitor and visualize custom metrics, like processing time, checkout conversion rate, or user sign-ups, or explore out-of-the-box metrics, like transaction duration, to make it easy to spot any issues. And when you do find a problem, you (sorry, the developer responsible for breaking things) can drill into specific events and use correlated traces to solve the cause of the issue (obviously not you).
So why should you care? Well, let’s walk through an example.
Monitor your critical paths with Metrics
Say you work on a product or service with a shopping cart and checkout experience. That flow is directly tied to your company’s revenue. So think of a massive e-commerce chain or a SaaS business like Sentry’s where users have to enter their credit card information to continue. Making sure your users can succeed through the happy path is critical to your success. Any latency through this path could result in lost revenue and probably (definitely) a lot of angry customers.
For our example, you’ll likely want to keep a close eye on checkout rates to ensure that things are running smoothly, and users are easily moving from your home page to adding their shipping address to checking out.
With Sentry’s new metrics offering, you can create custom metrics to count and visualize the number of users who complete the checkout process.
const goToNextStep = () => {

    // Count each user plus the current step as dimension
    Sentry.metrics.increment(‘checkout’, 1, {
      tags: { step: "checkout" },
    });

    navigate('/step-two');
  };
Thanks to Metrics, you can see that your checkout conversion rates are nice and steady.
Get alerted when the Metrics don’t add up
Metrics make it easy to spot anomalies at-a-glance, or you can create an alert to get notified by Slack, Discord, Teams, and/or Email if there are any significant changes. To make sure everything is working well in our checkout flow, we’ve set a threshold alert to trigger if checkout rates go down 20%.
Welp - you get an alert. Conversion rates must have dropped.
Checking your metrics confirms it. Visitors aren’t converting to buyers.
Here is where the journey with a generic metric product ends. But with Sentry, we’ve only just started.
Metrics and Tracing: debugging supercharged
Now that we’ve managed to identify the issue, the natural next step is figuring out how to fix it. You might have a hunch about where the problem lies and pull up other metrics like response time to see if it’s a particular API that’s being problematic. Sometimes that’s enough, but sometimes it’s trickier than that. This is when it really comes in handy to have access to different kinds of data about your application within one tool.
Metrics are great for looking at the breadth of data from your application because you can easily spot anomalies and start narrowing in on the issue. Traces, on the other hand, help to look at the depth of your application, from front-end to backend, and provide rich troubleshooting data to find the root cause.
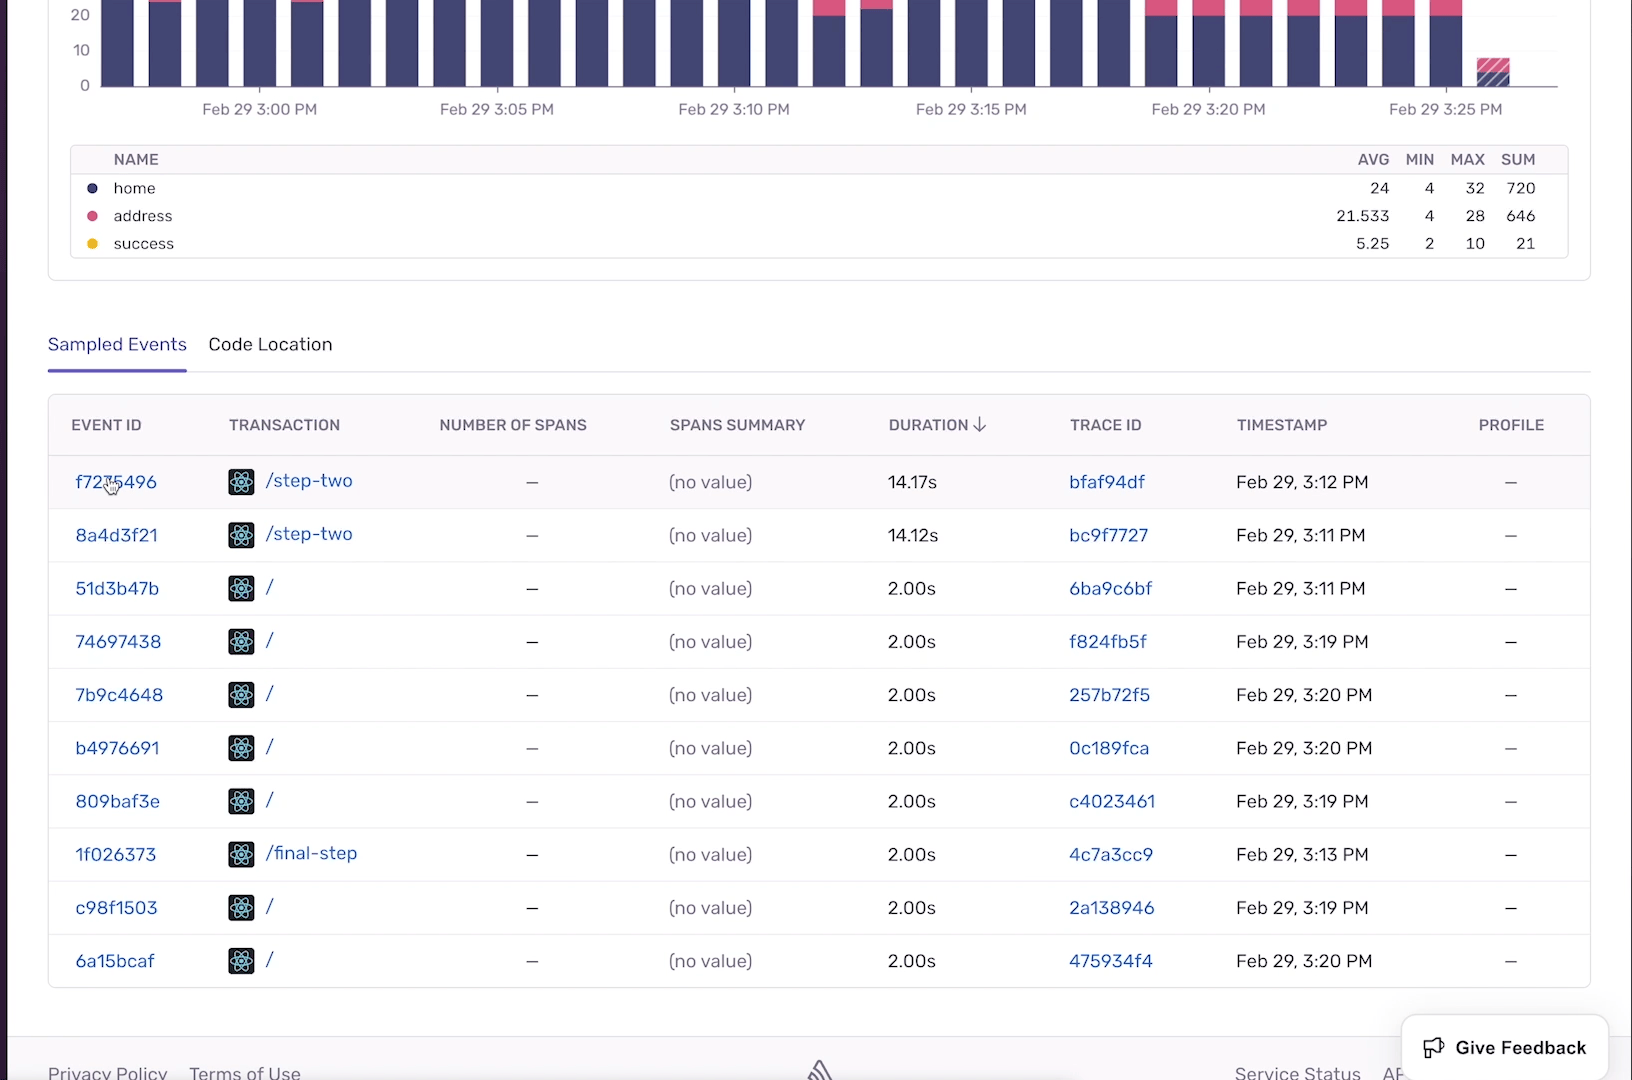
We make it easy to connect the two signals, by surfacing trace events that are correlated with the metric you’re focusing on. From the event samples table, you can then drill down into a specific trace view.
The waterfall makes it clear that this trace is taking very long. After drilling deeper, you can see the root cause: a third-party fulfillment API is the culprit.
Now you know exactly what to do to solve the issue and get your shop back up and running.
Not just for counting: Distributions, Gauges, and Sets
The example above shows an example of counting (tracking things that can be “incremented”), but you can create a range of metric types, including:
Distributions: Tracks a list of values that can be aggregated over time like max, min, and avg (for example, page load times). You can use a distribution to report on things that will reveal the health of your application, like the time it takes to start a process or the health and turnaround time of a queue.
For example, at Sentry, we dogfood Metrics to measure the distribution of how long it takes our eventmanager to save an event. We then usually monitor the 95th percentile to check for any regressions that could impact our event ingestion pipeline.
As you can see below, the blue dots are samples that were collected with this metric. You can use the samples table to select a single sample, or directly click on one of the dots to get to the trace details.
Gauges: Tracks a value that can go up or down (for example, available disk space or memory used)
Sets: Tracks a set of values that can be aggregations over time such as count_unique (for example, number of unique users)
Getting started
Before we added Metrics, you could measure all typical performance metrics out-of-the-box with Sentry’s Performance offering. Think transaction durations, web vitals, error count, etc. With Metrics, you have the flexibility to measure specific data points that tell you if your applications and services are healthy, and also tools to take action once you’ve identified a problem. It’s a powerful combination.
We are still in the early stages of development and look forward to hearing how you use Metrics. Share your experiences or feedback on Discord.
Sentry dashboards just got a major upgrade: create dashboards with AI agents, manage them via the CLI, and clone pre-built templates for common monitoring use cases.