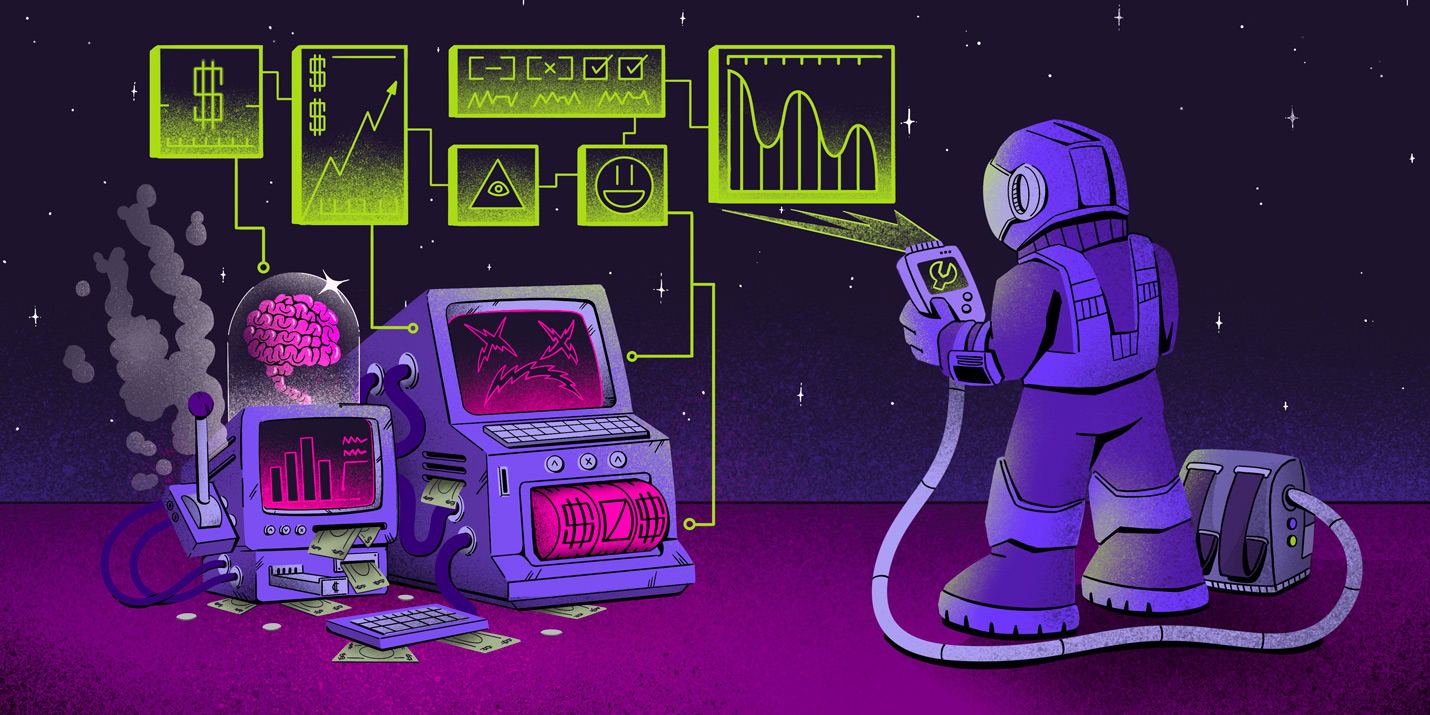
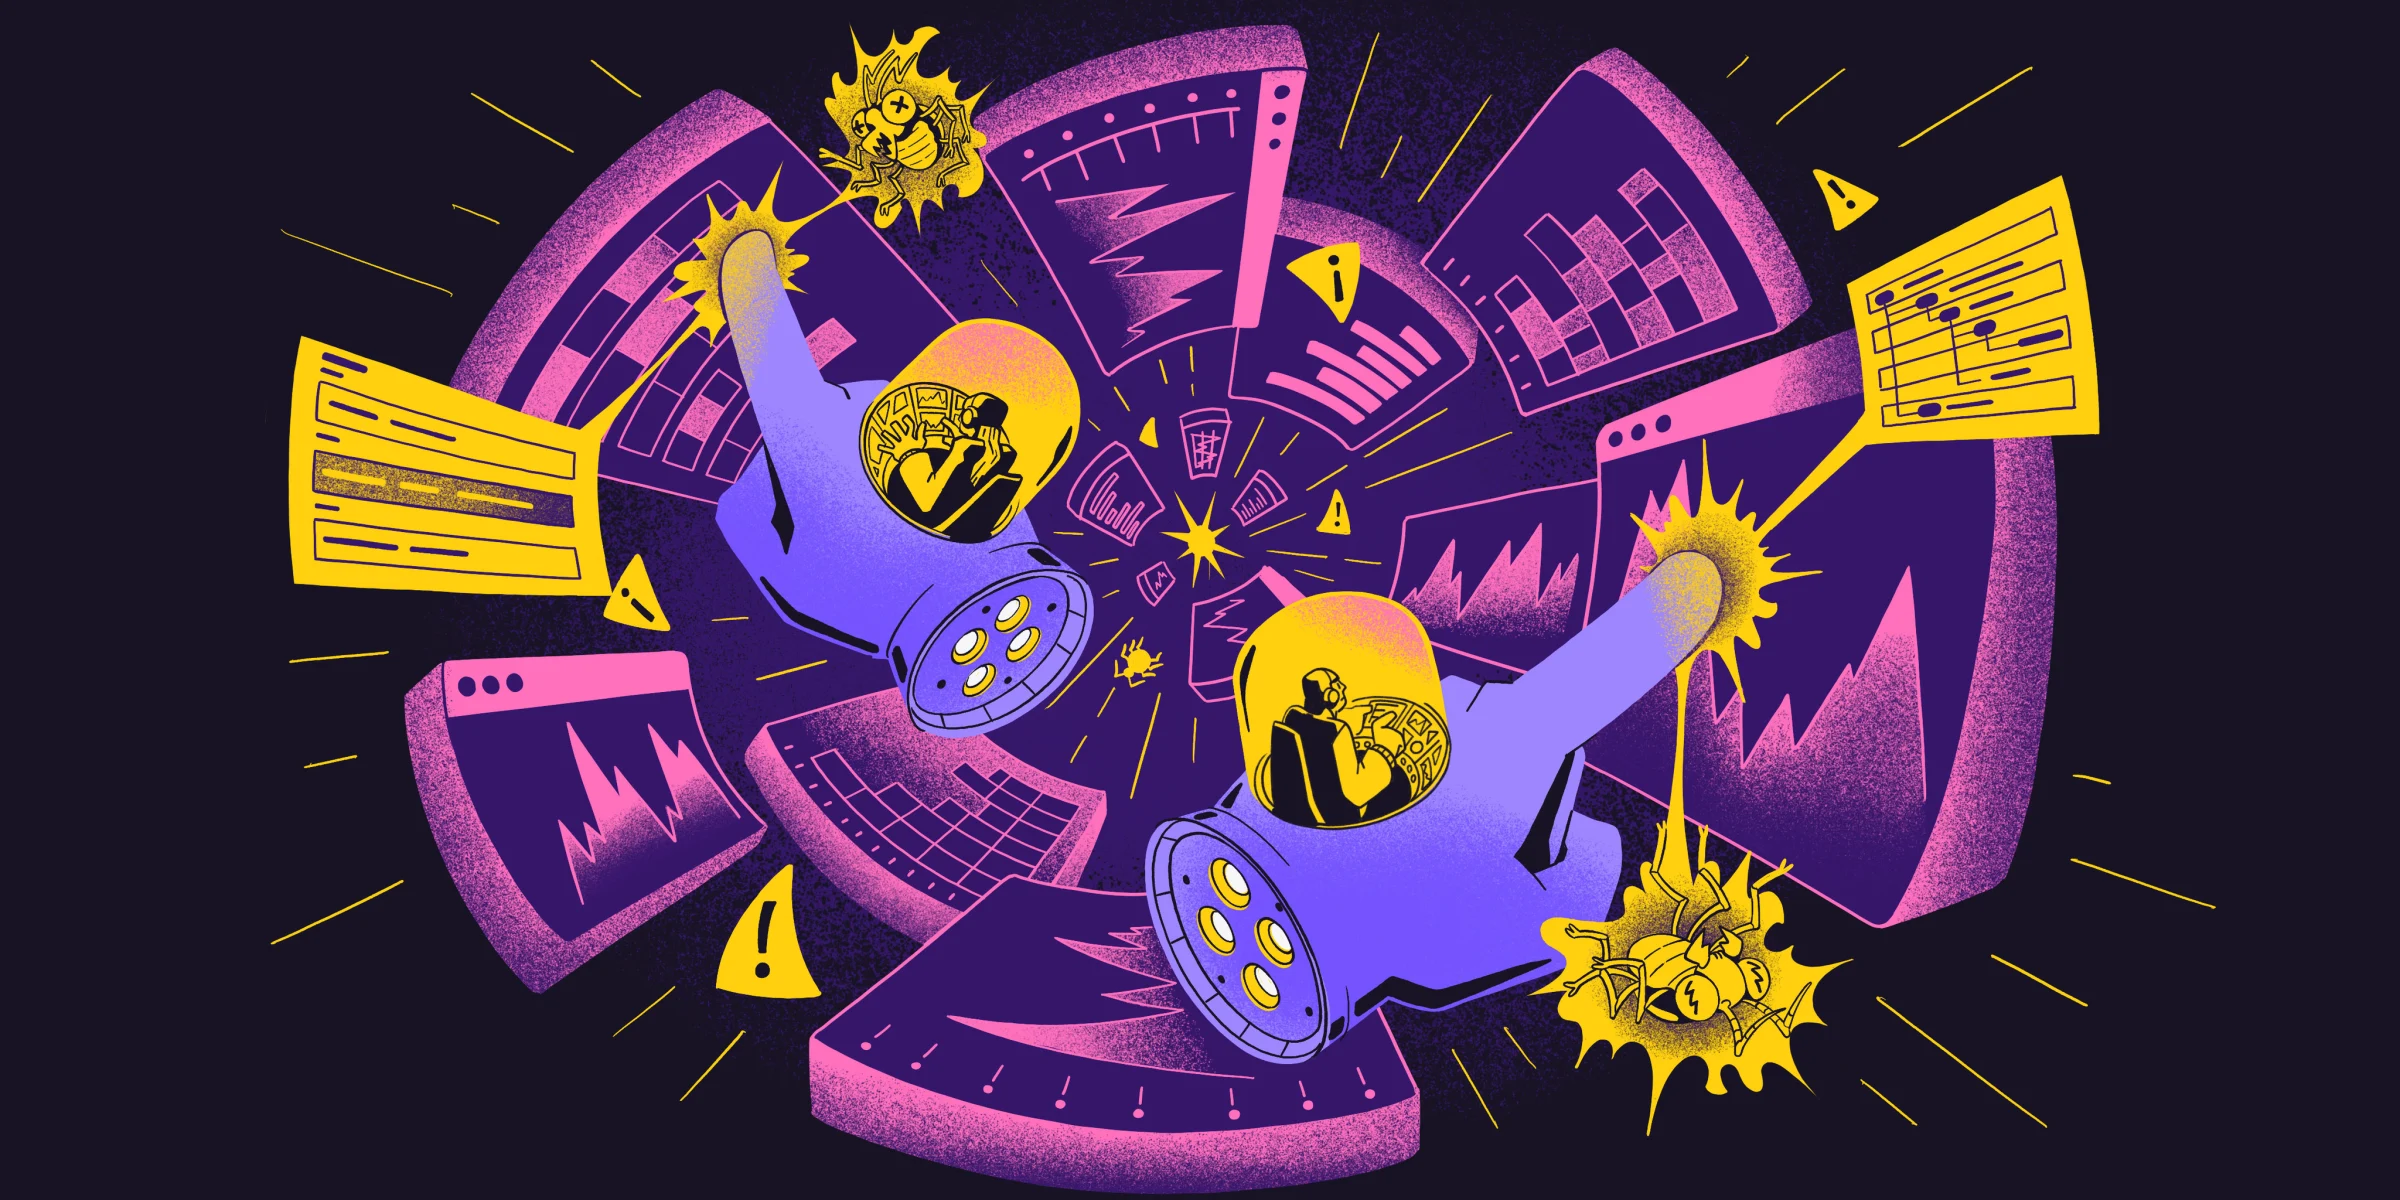
Performance Monitoring

Fixing memoization-breaking re-renders in React

Performance Monitoring
When a parent component passes down a callback function to a memoized child component through its props, React will re-render the child component every time the parent component gets re-rendered, even though the child component is memoized. In this article, we’ll look into that problem, and learn how to fix it.
Read on

Performance Monitoring for Every Developer: Web Vitals & Function Regression Issues

Performance Monitoring
Extracting relevant insights from your performance monitoring tool can be frustrating. You often get back more data than you need, making it…
Read on

What’s the difference between API Latency and API Response Time?

Performance Monitoring
Your app’s networking directly affects the user experience of your app. Imagine having to wait a few seconds for the page to load. Or even worse, imagine waiting for a few seconds every time you perform an action. It would be infuriating! Before you go on a fixing adventure, it’s a good idea to understand what causes that waiting time. So let’s do that!
Read on

How to identify and fix Render-Blocking Resources

Performance Monitoring
Render-blocking resources are JavaScript and CSS files that prevent the web page from loading until they are downloaded. These might be…
Read on

Find slow database queries with Query Insights

Performance Monitoring
There’s only so much you can control when it comes to your app’s performance. But you control what is arguably most important - the code…
Read on

From LCP to CLS: Improve your Core Web Vitals with Image Loading Best Practices

Performance Monitoring
If you’re a front end developer, there’s a high probability you’ve built (or will build) an image-heavy page. And you’ll need to make it…
Read on

Choosing the Right Metric: A Guide to Percentiles and Averages

Performance Monitoring
Not sure which performance metric to use to measure your application performance? Don’t worry – you’re not alone. With a wide variety of…
Read on

Sentry Profiling now supports Browser Javascript, React Native, and Ruby

Performance Monitoring
Profiling is an essential component of a developer’s toolkit for identifying and addressing the thorniest performance bottlenecks. Whether…
Read on

Harnessing Distributed Tracing for Application Performance Optimization

Performance Monitoring
Distributed tracing helps developers understand performance & identify bottlenecks. Learn more here about how distributed tracing operates behind the scenes.
Read on

Tame the performance of code you didn't write: A journey into stable diffusion

Performance Monitoring
In our daily lives as developers, we have to deal with a lot of code that we did not write ourselves (or wrote ourselves but already forgot…
Read on

Building better mobile experiences: tips from Riot Games and Nextdoor

Performance Monitoring
Building high quality, performant mobile apps is hard. Developers need to keep up with rapidly changing technologies, high user expectations…
Read on

The New APM: Actionable, Affordable, and Actually Built For Developers

Performance Monitoring
You shouldn’t need a Ph.D. in your APM tool to understand the performance of your application. Sentry’s new approach to application monitoring is focused on being actionable, affordable, and *is actually* built for developers. Learn how we're redefining the future of APM.
Read on

Profiling Beta for Python and Node.js

Performance Monitoring
A couple months ago, we launched Profiling in alpha for users on Python and Node.js SDKs — today, we’re moving Profiling for Python and Node…
Read on

Profiling 101: Why profiling? (2/2)

Performance Monitoring
This is part 2 of a 2-part series on profiling. If you’re not yet familiar with the what profiling is, check out the first part in our…
Read on

Measuring application performance in Swift using transactions

Performance Monitoring
Learn how to measure the performance of individual functions in your Swift app by using Sentry's Custom Instrumentation feature.
Read on

Application Profiling for Python

Performance Monitoring
Profiling is an important tool in every developer’s toolkit because it provides a granular view into the execution of your program from your…
Read on

Application Profiling for Node.js

Performance Monitoring
Profiling is an important tool in every developer’s toolkit because it provides a granular view into the execution of your program from your…
Read on

Code-level Application Monitoring for Every Developer

Performance Monitoring
This content is out of date Since this blog post has been published we’ve evolved the feature to reduce complexity of configuration and…
Read on
Go to Next Page
© 2023 • Sentry is a registered Trademark
of Functional Software, Inc.