12 Days of Integrations — Datadog

It’s that time of year again… The leaves have fallen from the trees, every department store is playing “All I Want for Christmas is You” on a loop, and I can finally justify wearing that hand-knit beanie I bought on Etsy (even though I live in California).
To celebrate, Sentry is highlighting twelve of our many integrations with an ornament hung with care each day on our festive Sen-Tree. We hope you return every day to enjoy these GIFs with your holiday feast, egg nog, Manischewitz, or pour-over artisan coffee.
Our eighth featured integration is Datadog.
One of the great joys of highlighting fantastic integrations is that there’s always a chance you’ve recently written a blog post about some of them. In Datadog’s case, we’ve done exactly that. If you’d like an even more detailed look at the integration, take a look at this post from October.
Error tracking is essential for identifying and fixing software issues in production. There’s no doubt about that. The alternative is to spend time poring over esoteric log files that may or may not contain useful error messages. That’s why Sentry is here to streamline the entire process by capturing and aggregating software exceptions, while automating their monitoring, tracking, and recognition. We’re very good at what we do.
But what we do is probably not the only thing you need done. Software errors are just one of many problems your organization might encounter across the full dev (and devops) stack. You may have data coming in from dozens of directions, and all that data is only valuable insomuch as you’re able to process and understand it; it’s not nearly as useful if you’re drowning in it.
That’s where Datadog comes in. Datadog is a monitoring service that seamlessly aggregates metrics from an incredible number of supported integrations. They connect with SaaS and cloud providers, automation tools, monitoring and instrumentation, databases and common server components, and services like Sentry, gathering all this information in one place where you can access, monitor, and control it (instead of having it control you). Datadog is especially good at helping teams observe and operationalize cloud and microservices infrastructures.

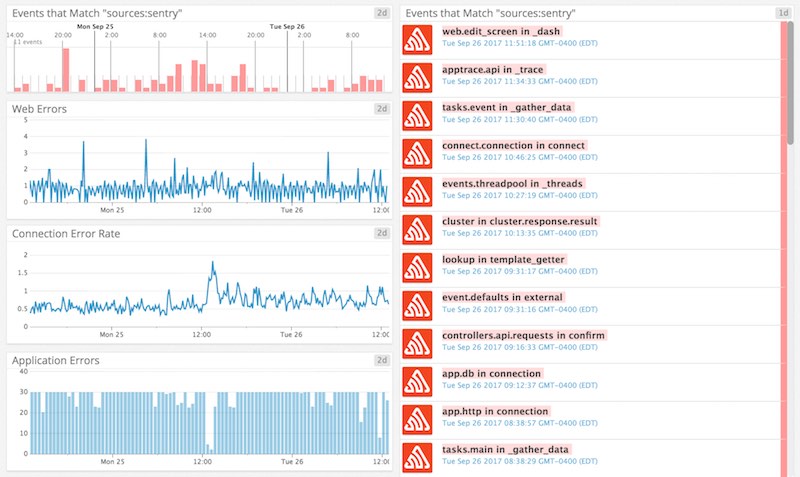
Sentry focused dashboard in Datadog
With Sentry’s Datadog integration, you can also capture all your events and errors directly within your Datadog dashboards; correlating errors with metrics and data points from other systems, creating synthetic error dashboards, and searching / commenting on errors and bug fixes directly within Datadog.
How does it work?
In Sentry, you’ll need to enable the integration for webhooks. The Datadog integration is activated at the Project level, so you’ll find Datadog under the All Integrations section of Project settings.
Next you’ll need add your Datadog API key to their webhook URL:
https://app.datadoghq.com/intake/webhook/sentry?api_key={API_KEY}
The API key can be found on your Datadog settings page.

The API key in Datadog
Then you’ll paste the link with API key into the Sentry webhooks integrations page.
Save that and you’re done! You’ll immediately see new Sentry events in your Datadog stream.
With Senty + Datadog, it’s easier than ever to tackle issues as soon as they come up.