INP, tracing, and mobile app starts: move faster and solve real user pain with Sentry Performance

Linda Ye -

Today, we're making it even easier to find and solve user-impacting issues with three new Sentry Performance features:
Adding support for INP Core Web Vital
On March 12, Google introduced Interaction to Next Paint (INP), a new Core Web Vital replacing First Input Delay (FID). While FID measures the delay in responsiveness for the first user interaction, INP measures the performance of every interaction on the page, making INP a more accurate measure of overall page responsiveness.
Why? When a user interacts with a page, it’s important to present visual feedback to indicate that an action was completed, or that something is in progress. For example, when adding an item to a shopping cart, the count on the cart should update almost immediately to indicate that the item was added. When the page is unresponsive and there is no visual feedback, the user might think the page is broken.
That’s why Sentry now supports INP, so you can monitor how your pages respond to all user interactions.

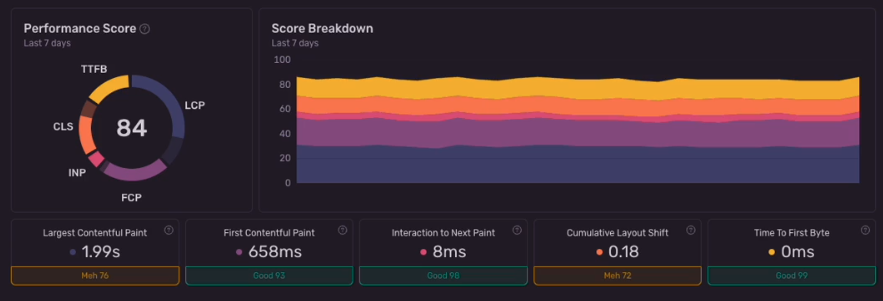
Sentry’s Web Vitals homepage displays a Performance Score factoring in metrics like INP, LCP, CLS
With tracing, you can start from an INP score and, using the spans in the trace, quickly identify the associated element and interaction type. And if you’re using Sentry’s Profiling, you can even diagnose the root cause by finding which code the browser was blocked on while responding to that interaction. This new support for INP lets you take action faster, saving you hours from staring at dashboards showing trends or spikes, or even worse, having to inspect every trace possibly related to the issue.
And, of course, you can also monitor the other Web Vitals (LCP, CLS, etc.) with this same logical workflow so you can get to the root cause of performance issues impacting users, faster.
Improved Tracing Experience: Debug end-user performance from the frontend to the backend
Terrible user experiences, like janky or slow-loading pages, often stem from things like inefficient SQL queries, caching (or lack thereof), or other backend performance problems. That’s why connecting problems that occur in different services across your application stack is necessary for debugging user-facing performance issues.
To make it easier to track user-facing issues back to the services causing performance bottlenecks, we simplified Sentry’s tracing experience. Our updated Trace View offers a unified view of your multi-service applications, making it dead simple to identify critical issues across your stack without losing context.

Sentry’s Trace View gives a unified view of frontend and backend services.
Let's say your Largest Contentful Paint (LCP) has tanked. With Sentry, you can start investigating a poor-scoring page load in the Trace View and zoom into the backend operations for API requests - all in a single view. In the Trace View, you’ll also see associated performance issues like slow database queries or frame drops, so you can know exactly what you need to do (or whom to blame 😏) to fix real-user impacting issues immediately.
Mobile Performance: From cold & warm starts to line of code
For mobile developers, finding and fixing performance issues in production is a time-suck – especially trying to debug when someone complains about your app being slow upon start. To solve this, we built an entirely new workflow to help you detect and track the root cause of cold and warm starts – down to the code responsible.
As a quick refresher, a cold start is when your app is launched while it’s not already running. And a warm start is when your app is brought from the background to the foreground.
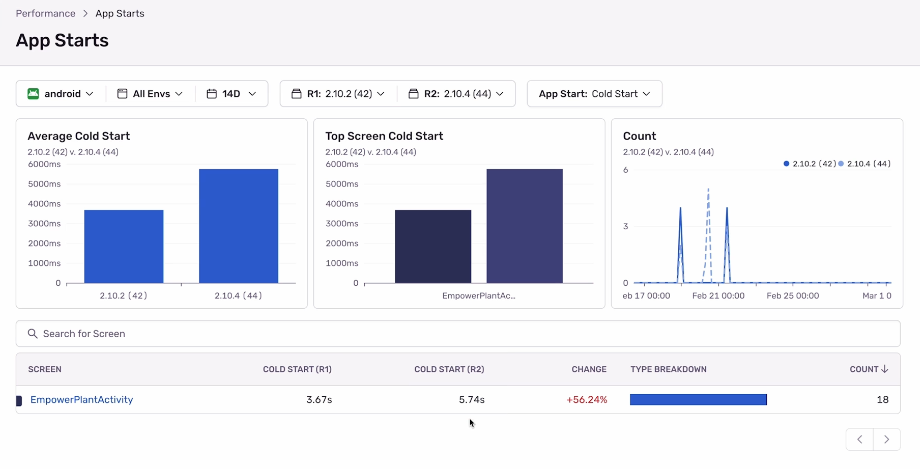
Let’s explore an example. You’ve released a new version of your app and Sentry alerts you that your cold start durations have increased. With App Starts, Sentry lets you compare mobile vitals across releases so you can tell which release likely caused the performance degradation.

Compare your cold and warm starts across releases in Sentry.
You’ve identified which release the regression is coming from, but knowing the startup times is only half the battle.
From App Starts, you can get a simple list of your spans causing the regression; the percentage change helps you prioritize which operation to look at. If you click into the suspect span, you’ll see event samples from both release versions. By comparing the two, you can see how much the duration of a given span deviates from average spans in both releases.
Looking at the span description also lets you see what class and method is called, giving you the right context to track down the dependency containing the regression. From here, you can even go into the profile to investigate further at the function level.

App Starts lets you see the spans causing a regression across release versions
To recap - you just went from a slow-start up to the function causing the slowdown in a few clicks. This workflow is currently available for iOS and Android SDKs, with support for React Native coming soon. To see all of our latest mobile updates for Performance check out our latest post.
Conclusion
Improving and maintaining your software isn’t about “optimizing” away a few milliseconds to drive down a number; it’s about solving real user pain points. With our latest additions — INP monitoring, improved tracing capabilities, and mobile app performance optimization — developers can move faster to prioritize and address user-facing performance issues.
To set up Sentry Performance today, check out this guide. You can also drop us a line on Twitter or Discord, or share your Web Vitals feedback with us on GitHub.
And, if you’re new to Sentry, you can try it for free or request a demo to get started.


