TL;DR: You can instrument MCP servers with Sentry and get client, transport, tool, and error visibility without waiting for users to report problems. Start with the MCP monitoring docs or the step-by-step cookbook.
For JavaScript, the core idea is one wrapper around your MCP server:
import * as Sentry from "@sentry/node";import { McpServer } from "@modelcontextprotocol/sdk";Sentry.init({ dsn: "___PUBLIC_DSN___", tracesSampleRate: 1.0,});const server = Sentry.wrapMcpServerWithSentry( new McpServer({ name: "my-mcp-server", version: "1.0.0", }), { recordInputs: true, recordOutputs: true, },);
Python and other platforms follow the same idea through SDK integrations. See the setup guide for current APIs and version floors.
When we launched our own MCP (Model Context Protocol) server earlier this year, the goal was simple: make it easy for AI agents to use Sentry’s context to debug issues in our users’ applications, in real time. That work sits inside the same AI observability surface as agent tracing, evals, and cost monitoring.
Building against an emerging tech, whose standards are a moving target, isn’t easy. Even our Co-Founder David Cramer has shared his famous hot takes about it. We’ve watched MCP standardize on Streamable HTTP, develop better OAuth support, introduce new specs, and make many other “adjustments” (to put it lightly) along the way.
We’ve built our MCP server “bleeding edge” with the idea of making adoption easy for users, and to support the complex use cases our user base runs into. Living on the edge of things like remote hosted, stateful MCP servers, supporting OAuth, and adding capabilities like Seer and natural language search, has come with its own challenges to monitor and observe.
On top of all that, because of Sentry’s scale, usage of our MCP server has grown very fast: 50 million requests per month across thousands of users (and climbing).
While building the Sentry MCP server, we started to get a good sense of where the gaps were in monitoring MCP servers. It’s hard to capture details of errors or the random sharp edges that come up within MCP. Performance issues in tool calls are hard to diagnose, and challenges with specific inputs and outputs of tool calls are still immature in a lot of MCP monitoring.
On top of that, we experienced the normal “fun” of platform outages in upstream systems. In the most challenging case, we started receiving random reports of users timing out. Requests abruptly ending with no results and no errors. From our side, nothing looked wrong, and without visibility all we had to go off of was the users who reached out. We didn’t even have a way to know how many users were impacted and which MCP clients it was coming from.
As we built the MCP server, we started building our own tooling for monitoring it. During this time, MCP became “a whole thing,” and it was clear that the tooling we built for our own use would be useful for the big new AI surface everyone was building against.
And so we built MCP monitoring so you can get visibility into all the sharp edges your MCP server has, who’s using it, how it’s working (or not), and get alerted when things break, without waiting for your users to tell you.
MCP monitoring works with the SDKs and platforms documented in the getting started guide (including JavaScript and Python). All you need is a Sentry account and a few lines to start sending spans.
What is Sentry’s MCP server monitoring?
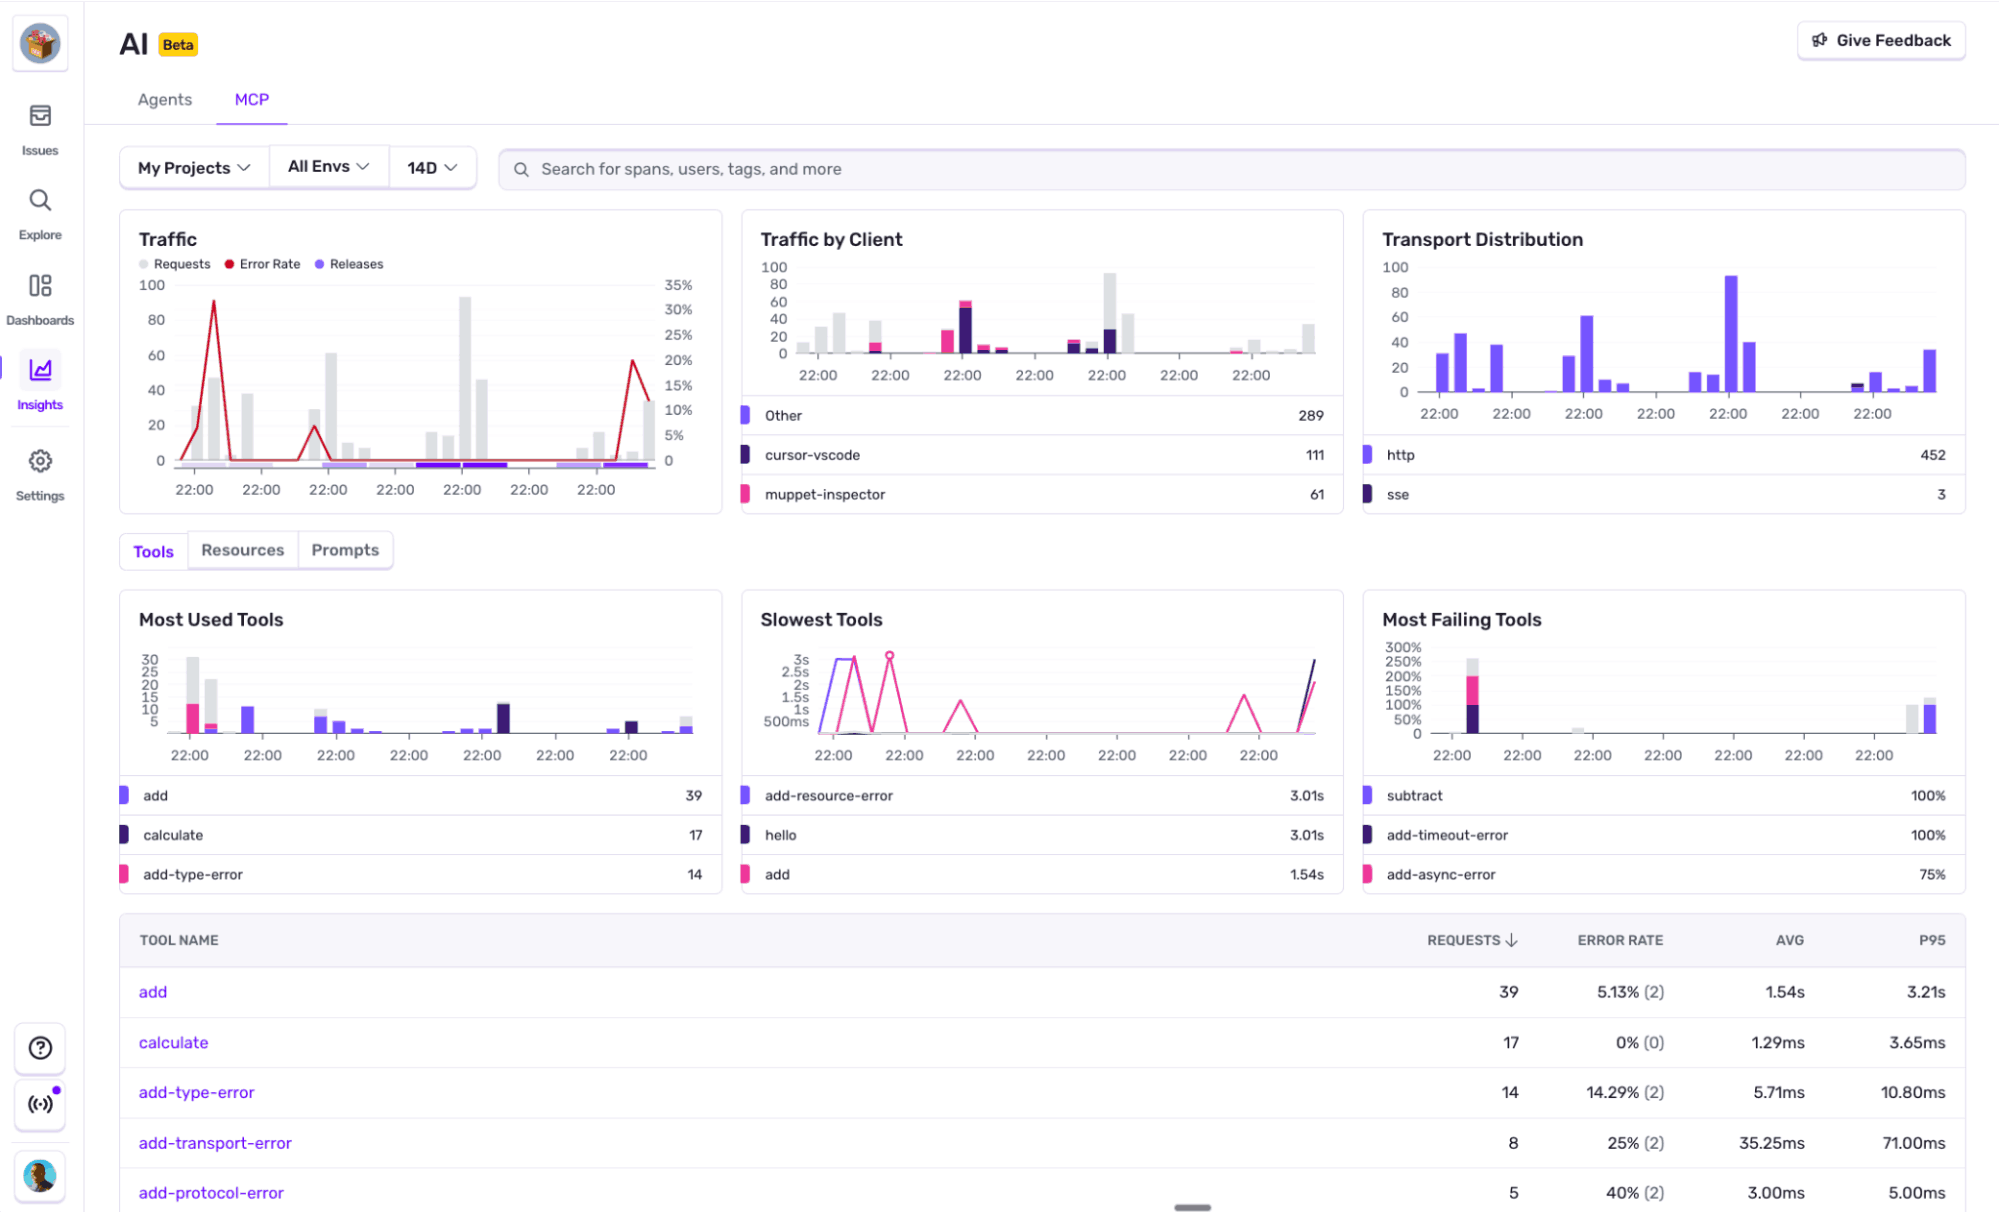
Sentry’s MCP server monitoring gives you protocol-aware visibility into how your MCP server is actually being used, broken down by transport (like SSE or HTTP), by performance, by tools, resources, and more.
You can quickly drop in and see which MCP clients are calling which tools, how those requests are performing, and most importantly, where things are going wrong.
We started where most people would: with OpenTelemetry. We were already well on our way to building agent tracing, and it shared a lot of parallels with MCP server monitoring. OpenTelemetry MCP semantic conventions gave us a solid foundation to build on and extend with the visibility we needed. From there, we layered our own opinions, shaped by building and running our MCP server in the real world.
Once setup in your MCP server, you’ll have:
A clear overview of the different aspects of your MCP server’s performance, with built-in paths to explore more. Client segmentation, transport distribution, most errored tools, most read resources, slowest tools, and more.
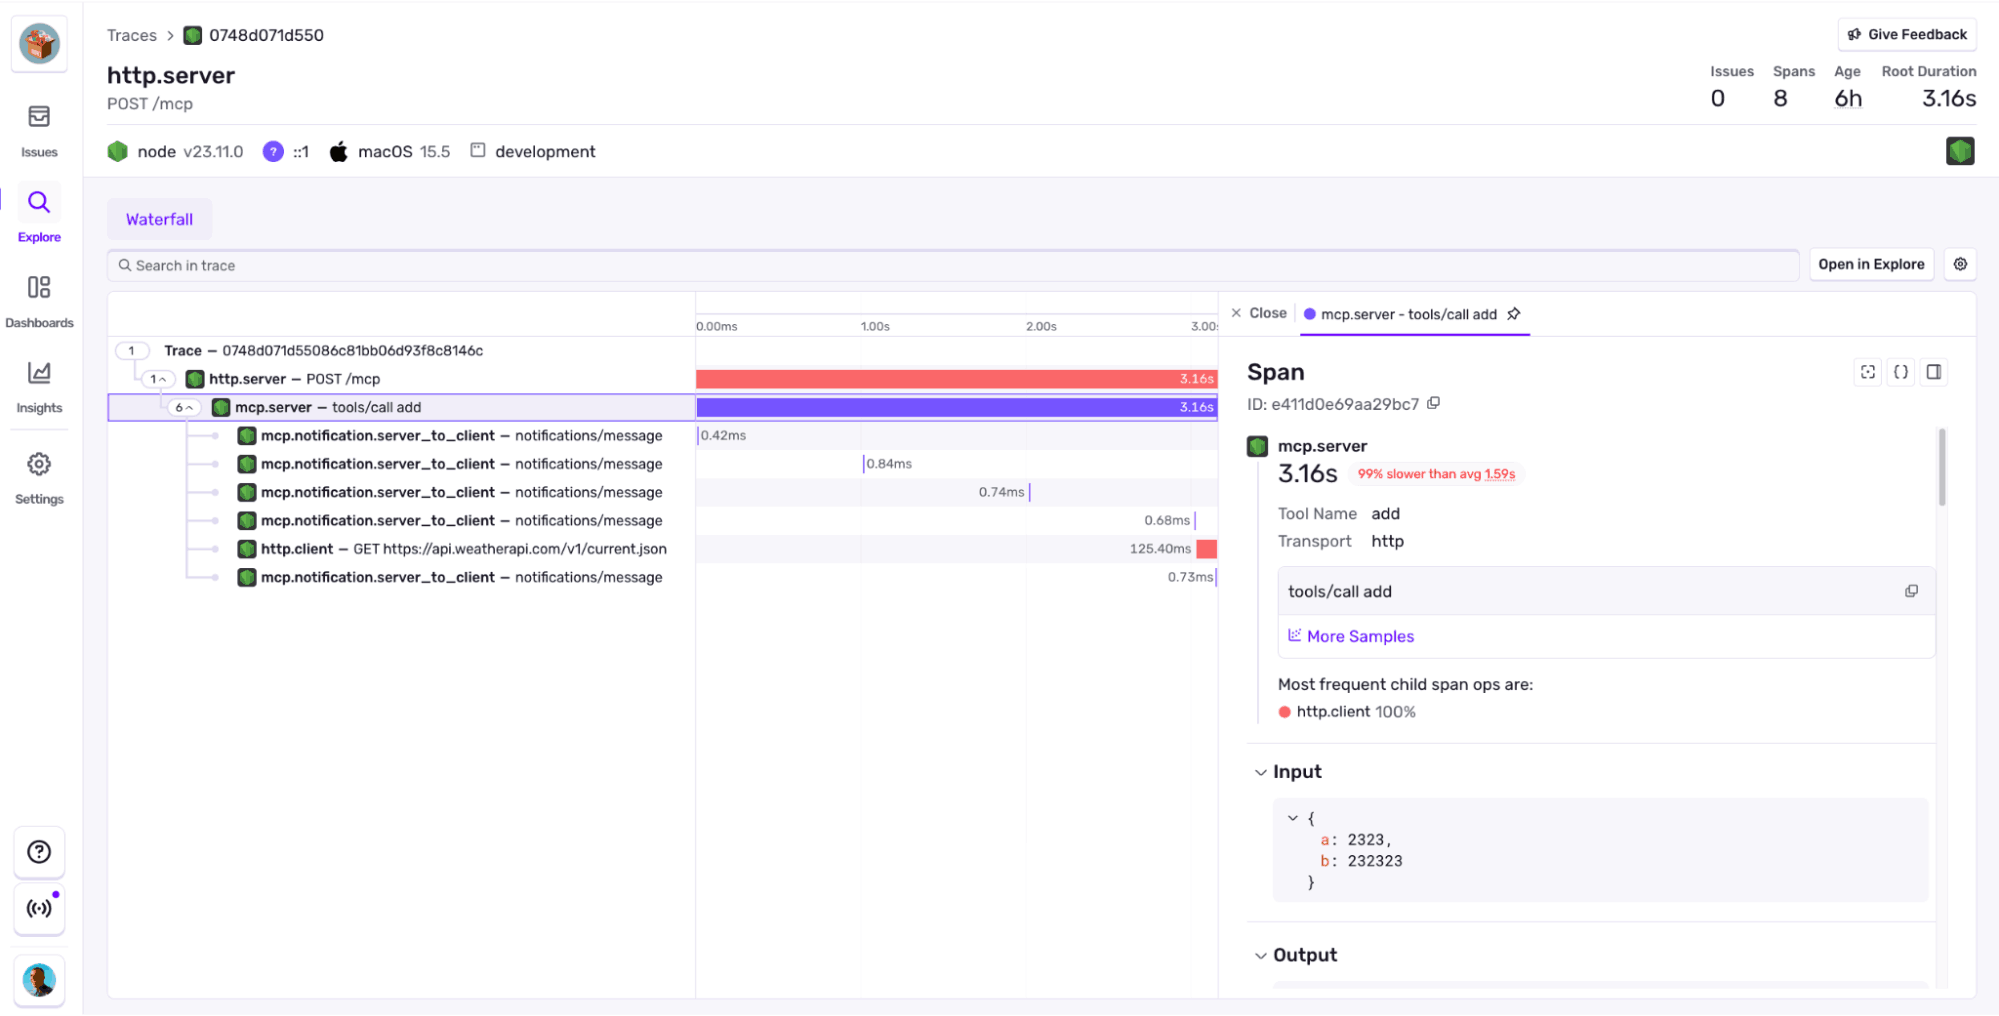
Tracing down to each of the JSON-RPC requests, including tool call arguments and results.
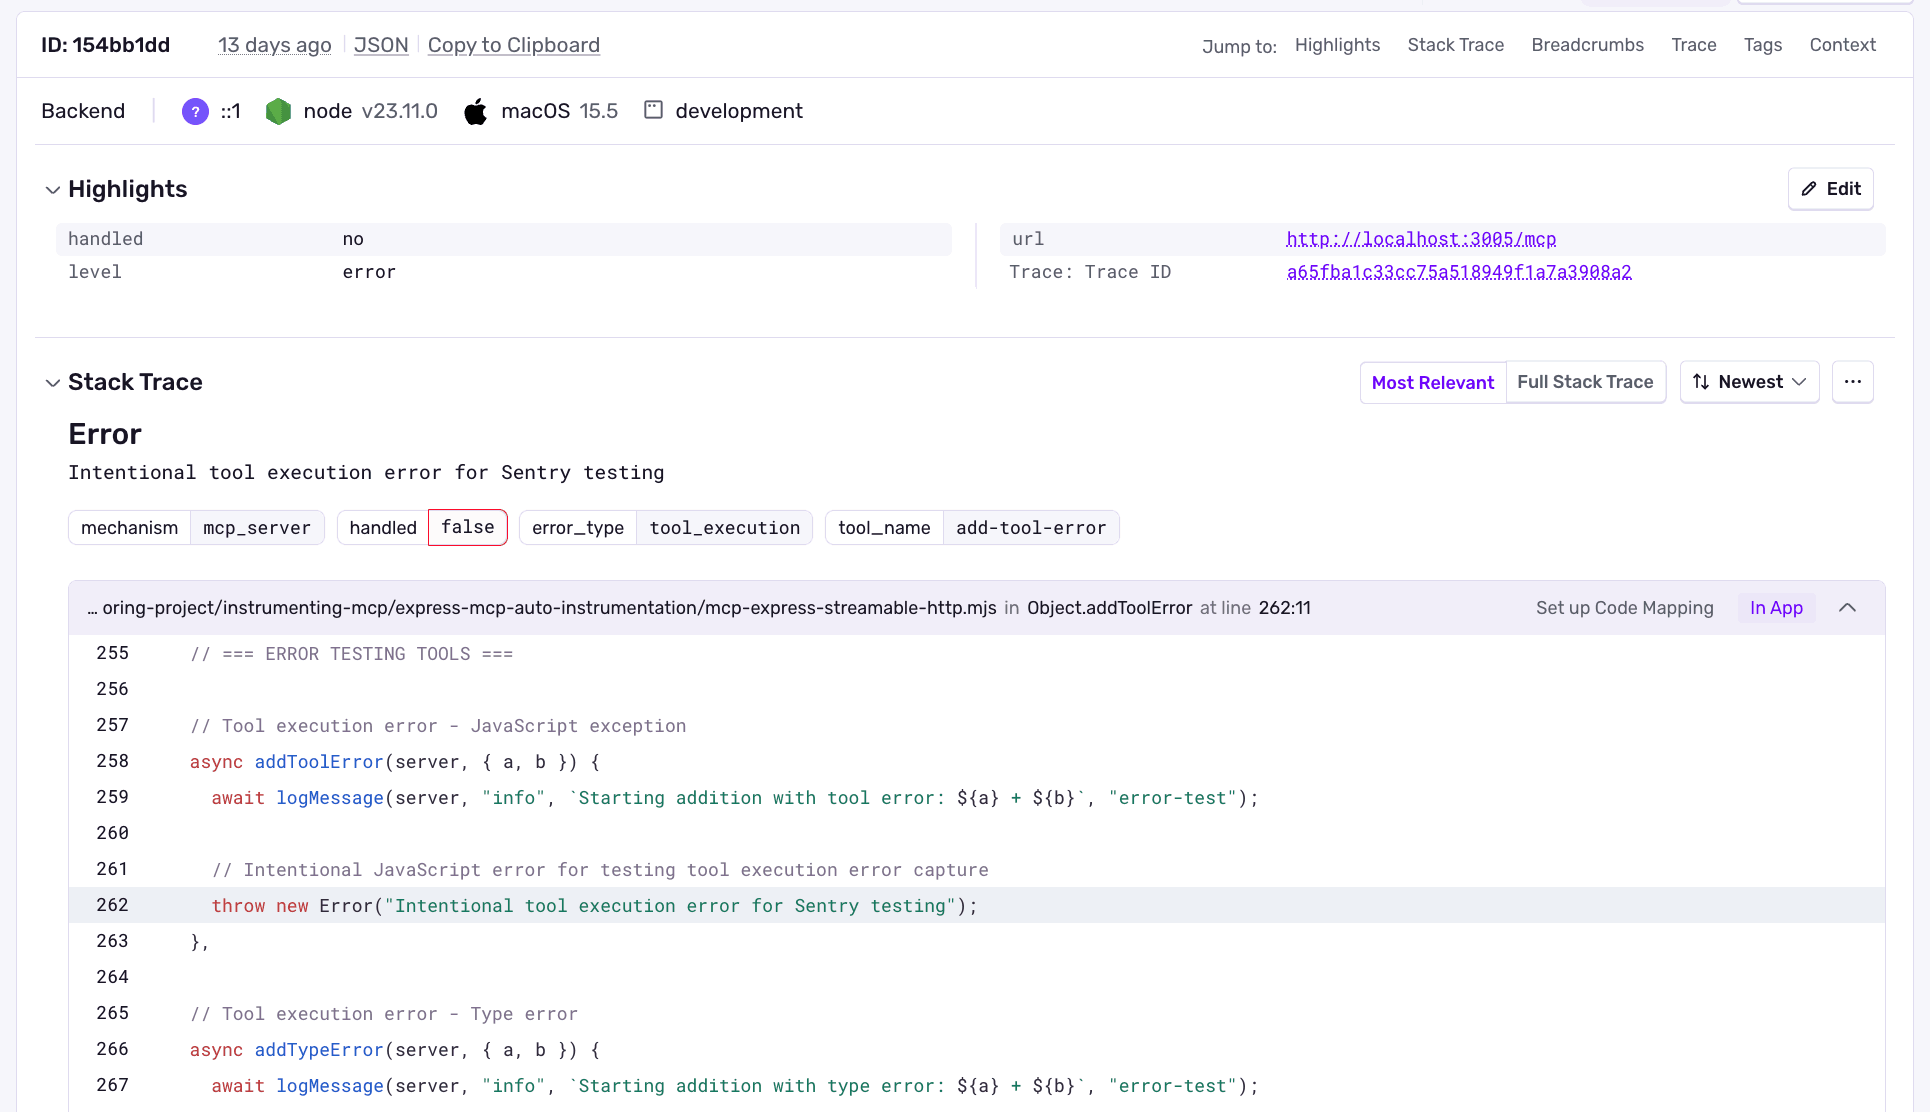
Errors. MCP protocol handles errors inside the server to avoid throwing them, and just responds with a “there was something wrong” kind of message. That’s good for clients, but if it was an error, we want it logged and linked to the specific part of the server that caused it.
And because we support OpenTelemetry, if you’re using another MCP server library and it follows OpenTelemetry semantic conventions for MCP, you’ll get this out of the box.
What are users actually using your MCP server for?
You’ve built an MCP server. Tools are working, resources are flowing, and a few clients are connecting. But every new tool call you vibe code into existence has you wondering if anyone even uses what you built last week.
Without proper instrumentation, it’s just guessing.
Who’s calling your server and what are they actually using?
MCP servers can handle thousands of requests per minute across multiple transports (stdio, HTTP, SSE). Logs show method names, but no context. You see tools/call everywhere, but which tools? From which clients? Over which transport?
Now you know: Cursor is heavily using file_search over STDIO, and you can even see its reliability stats.
Catch broken integrations before clients abandon your server
You ship MCP server v1.2.0 with improved resource caching. Everything looks good in local testing. No errors in CI. But three days later, you notice something strange in your hand-crafted request counting:
Volume for resources/read dropped 60% since the deploy.
Without proper instrumentation, you’re left wondering:
Did clients stop using resources entirely?
Is there a silent failure mode?
Are clients falling back to different endpoints?
Is this related to the new caching logic?
Your MCP instrumentation catches this immediately and you get a Sentry email saying:
CacheKeyError: undefined cache namespace in method “resources/read”.
You go to the UI and see that it’s for streamable HTTP transport. So the new caching broke resource reading on HTTP transport, but STDIO and SSE were unaffected. You fix the cache namespace handling and resources/read volume returns to normal before clients give up and switch tools.
Stop bot abuse before it burns your server
MCP servers often start without authentication, perfect for early testing, and dangerous for production. One morning you wake up to doubled CPU usage and your logs flooded with malformed requests.
Infrastructure metrics show “everything normal”. CPU is high, but no 5XX errors. Your server is technically responding to everything, even the garbage.
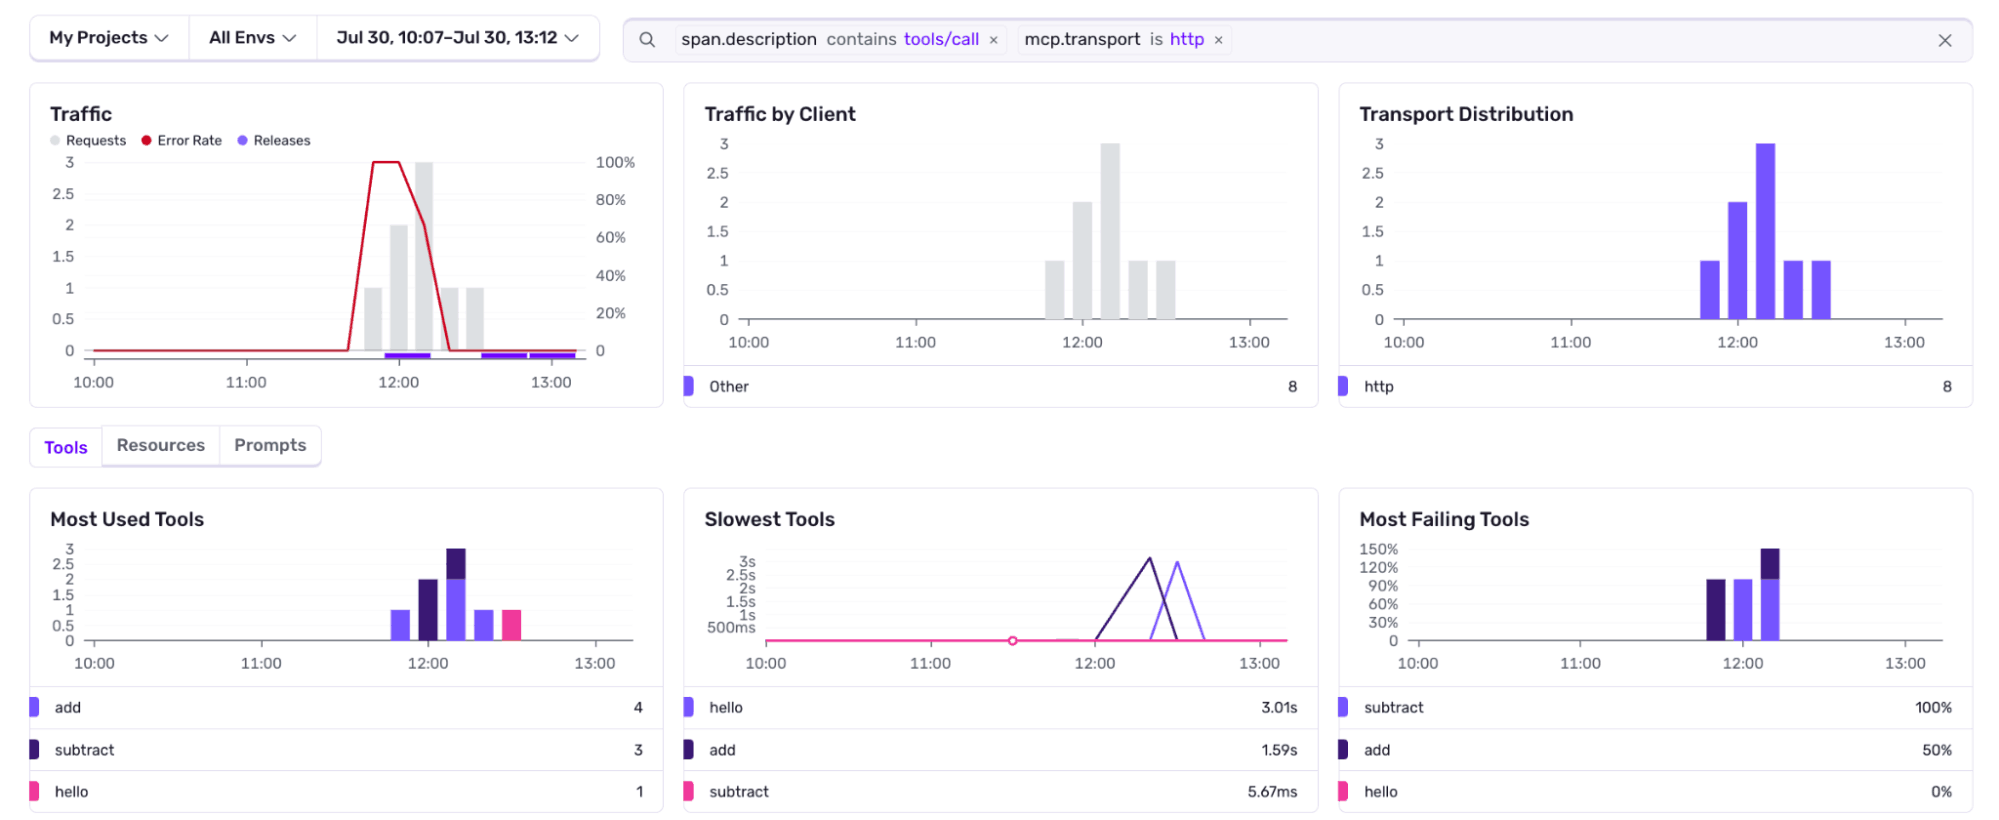
Without request attribution, you can’t tell legitimate traffic from abuse. With MCP monitoring, the problem becomes obvious:
There is an unknown client using HTTP transport that’s making requests to your tool subtract that has a failure rate of 100%. With that, you can think of mitigation strategies to apply.
Know what to build next, before you waste weeks on unused features
You have 4 feature requests:
Add webhooks support for notifications
Improve file_search tool performance
Add streaming for large responses
Implement prompt templates
Without usage data, you’re guessing which will have the most impact. You might spend two weeks building webhooks that nobody uses, while file_search performance issues frustrate your most active clients.
You can solve this by looking at MCP monitoring charts, where you could see how that tool is the most used one, so you can work on improving its performance.
Part of AI observability
MCP monitoring sits under Sentry’s broader AI observability work: agents, conversations, model cost, and the tools those agents call. If you’re wiring up more than an MCP server, these cookbooks pair well:
To get started, follow the MCP docs to instrument your server, walk through our step-by-step cookbook, and then open MCP Insights in your Sentry org. No extra config, no manual dashboards, no waiting for your users to tell you something’s broken.
MCP monitoring gives you protocol-aware visibility into your Model Context Protocol server: which clients connect, which transports they use, which tools and resources get called, how long those calls take, and where errors happen, including failures MCP would otherwise swallow in a JSON-RPC response.
Which SDKs support MCP monitoring? ▾
JavaScript (@sentry/node) and Python (sentry-sdk with MCPIntegration). Cloudflare Workers also have MCP instrumentation. For current version requirements and setup steps, see the MCP monitoring docs.
How do I instrument an MCP server with Sentry? ▾
Initialize Sentry with tracing enabled, then wrap your MCP server (JavaScript) or add MCPIntegration() (Python). The getting started guide and cookbook walk through both paths.
Does MCP monitoring catch silent tool errors? ▾
Yes. The MCP protocol often returns errors inside JSON-RPC responses instead of throwing, so your app logs can look fine while tools fail. Sentry captures those failures and links them to the tool, resource, or prompt that caused them.
Is this the same as Sentry's own MCP server? ▾
No. This post is about monitoring your MCP server. Sentry also ships an MCP server so agents can query your Sentry data. That's a different product. See Sentry's MCP server docs if that's what you need.
Sentry's Flutter SDK 10.0 makes streaming traces the default, fixes crash-free rate accuracy for unhandled errors, and adds dedicated app startup traces on Android and iOS.
The OpenTelemetry instrumentation packages needed a Node module loader, a package.json file, and a mutable exports object. v11 replaces all of that with a source transform and diagnostics channels, so tracing now works on Cloudflare Workers, Bun, Deno, and bundled server deployments.
With Unreal Engine 5.8, your coding agent can drive the editor through Unreal MCP. The Sentry plugin adds tools and skills so it can set up Sentry, upload debug symbols, and root-cause crashes for you.