If you’re using Sentry, you have traces, structured logs, and now application metrics. Most teams use that stuff for debugging and stop there. But get this: that same data can answer most of the product questions you’ve been sending to a separate analytics tool, maintained by a separate team, with a separate data model and a separate bill. (Not all of them. We’ll get honest about the gaps later.)
This isn’t a post about whether product analytics tools should exist. It’s about the fact that developers have been sitting on top of a goldmine of product insight and outsourcing the questions to someone else. You don’t have to.
There’s a reason this matters more now than it did five years ago. The line between “product manager” and “software engineer” is blurring. Engineers are increasingly expected to think about adoption, retention, and user behavior, not just uptime and latency. If you’re a product engineer (and increasingly, that’s just “engineer”), the tools you already use for debugging are the same tools you should be using to answer product questions. You just haven’t been querying them that way.
Every product question maps to telemetry you already have
“How many users completed onboarding this week?” That’s a counter metric: metrics.count("onboarding.completed", 1). You can slice it by plan tier, country, or referral source with attributes you’re already setting.
“What’s our p95 checkout latency by region?” That’s a distribution on a span. The trace already has the timing. You just need to query it.
“Why did signups drop on Tuesday?” That’s a structured log. The signup service logged signup.failed with reason: email_validation_error and deploy_sha: a3f9b2c. The log is already correlated to the trace that shows the full request lifecycle, the span that errored, and the release that introduced it. From the trace, you’re one click away from the issue, which links you to the commit and the line of code that caused it.
These are the same questions your PM asks their analytics tool. The difference is that when you answer them from your telemetry, the answer comes with context. The analytics tool gives you the “what.” Your telemetry gives you the “what,” the “why,” and a direct path to the code that’s responsible.
A customer told us recently that they were tired of analytics tools giving them a heads-up after the damage was done. They wanted to be proactive. The way they got there was setting up alerts and monitors on the telemetry they were already collecting. When a business-critical metric starts trending down, the alert fires before the weekly dashboard review catches it. And because the alert is on a span or a metric that’s connected to the full trace, the investigation starts with context, not a context-switch to a different tool. They didn’t change the data they were collecting. They changed how they were watching it.
What it looks like in practice
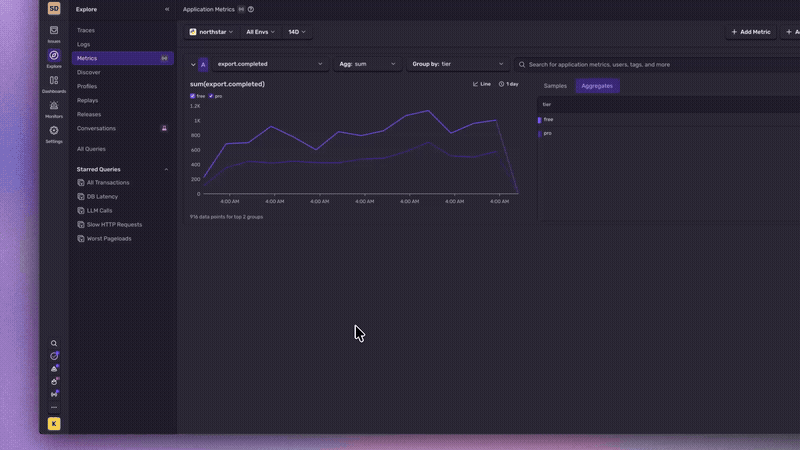
Say you want to know whether users are adopting your new export feature, whether it’s performant, and whether paid users behave differently than free users.
You don’t need to file a ticket asking someone to instrument this in an analytics tool. You already have the three primitives: spans, logs, and application metrics.
Spans for request-level context. Spans tell you how requests move through your system and how long each operation takes. The export API handler already has a span. Add business-level attributes (like export.user_tier, which lets you slice by plan):
with sentry_sdk.start_span(op="export.generate", name="Generate export file") as span:
    span.set_attribute("export.file_size_mb", file_size_mb)
    span.set_attribute("export.format", export_format)
    span.set_attribute("export.user_tier", user.plan)
    span.set_attribute("export.row_count", row_count)
Query adoption, performance, and errors in one place:
span.op:export.generate | count(), avg(span.duration), count_if(span.status:internal_error)
  group by export.user_tier, export.format
You can already see the story: xlsx exports are 3-4x slower than csv, and free-tier xlsx is erroring on 16% of requests. You didn’t need an analytics tool to surface that. You needed to query the spans you already had.
Structured logs for discrete business events. Logs capture discrete events with enough detail to help you debug what happened and why. When a user upgrades their plan, you want to record the events that took place before and after the plan change, where it was triggered, and any revenue impact. That’s a business event worth recording, but it’s not a performance-sensitive operation you need to trace end-to-end. Log it:
Now you can query plan upgrades by source, see which upgrade path drives the most revenue, and if something breaks in the upgrade flow, the log entry is already linked to the trace context that shows you where it failed.
Query your logs for upgrade events from the past 30 days:
plan.upgraded | count(), sum(mrr_delta_usd)
  group by upgrade_source
Checkout drives the most upgrades, but it also converts at a higher average MRR per upgrade ($39.69 vs. $32.47 for paywall). That’s the kind of insight your PM is running a separate tool to get, and it’s sitting in your logs.
Application Metrics for KPIs and health signals. Metrics are how you track the measures that tell you whether things are healthy – both in your service and your business. Things like checkout conversion rate, signup and traffic over time, and error budget burn. These are the signals you track continuously, get alerted on, and study trends:
This gives you a counter and distribution you can alert on, visualize, and use to observe trends over time without building or maintaining an analytics pipeline.
That’s three primitives in one SDK covering every angle you need: request-level detail from spans, discrete business events from logs, and aggregated trends from metrics, all queryable in one tool and all connected to each other.
Compare this to the usual workflow: someone instruments a feature_export_used event in an analytics tool, builds a dashboard, checks it weekly. Three weeks later they notice adoption is flat. They ask engineering if there are issues. Engineering checks Sentry, finds the export is timing out for files over 50MB, which covers most real-world usage. Three weeks lost because the analytics tool could see the symptom but not the cause.
With your telemetry, you can set up a monitor on that span’s error rate and duration. When the timeout starts happening, the alert fires on the span itself, not on a downstream analytics metric that takes weeks to reflect the problem. The metric shows the count dropping. The span shows the duration spiking. The log shows the error. And all three point back to the same trace, the same release, the same line of code.
To go one step further, you can ask Seer if anything is broken that may be causing adoption to stay flat.
The skills already transfer
If you’re already using Sentry for debugging, the only mental shift is realizing that “business telemetry” and “system telemetry” aren’t different categories.
The business question (“did the user convert?”) and the engineering question (“did the request succeed?”) are the same question asked at different altitudes. You don’t need a separate tool to ask the business question. You need to add purchase.value_usd to the span you already have, log the purchase.completed event with the attributes that matter, and increment the counter.
# On the spanspan.set_data("purchase.value_usd", order.total)span.set_data("purchase.item_count", len(order.items))# As a structured logsentry_sdk.logger.info( "purchase.completed", value_usd=order.total, item_count=len(order.items), coupon_applied=bool(order.coupon), user_id=user.id,)# As a metricmetrics.count("purchase.completed", 1, attributes={"coupon": str(bool(order.coupon))})metrics.distribution("purchase.value", order.total, attributes={"plan": user.plan})
One customer framed it well: when there’s a discrepancy in a business metric, it shows up in other parts of the system too. That’s what observability means. Everything is connected. The moment you start treating your telemetry as the source of truth for product questions, you stop needing a second system to answer them.
Where this gets hard (and why it’s getting easier)
Let’s be honest about the gaps.
Multi-session retention analysis, behavioral cohorts (“users who did X but not Y within 14 days”), and cross-session funnel conversion are genuinely difficult to reconstruct from raw telemetry. Spans are request-scoped. Logs are event-scoped. Metrics are time-series. Stitching together a user’s journey across sessions and days requires aggregation infrastructure that observability tools haven’t traditionally built.
If your PM needs a 30-day retention curve segmented by acquisition channel, you can’t just GROUP BY your way there today.
But most of the data is already there. Your spans, logs, and metrics all carry user IDs, timestamps, and business attributes. The missing piece is the aggregation and visualization layer. That’s a query engine problem, not a data model problem. OpenTelemetry is making this easier to solve every quarter, because once instrumentation is standardized, the aggregation layer becomes commoditized. The gap is real, and it’s shrinking.
We think there’s interesting work to be done here, and we plan to dig into some of these harder use cases in future posts, showing how far you can get with Sentry’s existing query tools even for cross-session analysis.
For the questions that matter day-to-day as a developer building and shipping features, the gap doesn’t exist. Is my feature being adopted? Is it performant? Is it erroring? Are paid users behaving differently than free users? Which upgrade path drives the most revenue? You can answer all of these right now, from the telemetry you already have, without waiting for anyone.
Try it
Pick one feature you shipped recently that you’re curious about. There most certainly is an opportunity to:
Add business-level attributes to the spans on the critical path of that feature’s functionality
Add Sentry Logs that are high cardinality wide events including details you would want to query this data by (user plan, surface, activity data)
Sprinkle application metrics across with attributes that will be useful in creating dashboards.
We have found that agents are quite good at following these types of requests, and we have some skills to deploy in your local IDE and once you’re done, ask Seer Agent about the best ways to create dashboards, monitors and alerts for them.
See how long it takes before the analytics dashboard for that feature stops being the thing anyone opens first.
You already have the data, you already have the tools, and you’ve just been letting someone else ask your questions for you.
More code is shipping faster than ever, and most of it is no longer written by people. The speed is the story everyone tells. What matters more is what happens after the code ships, where software is starting to notice it is broken, understand why, and write the fix itself.
We trained and deployed a new issue grouping model that prevents 20% more duplicate issues, halves incorrect merges, and makes future model upgrades trivial.