Your bad LCP score might be a backend issue
Your bad LCP score might be a backend issue
Largest Contentful Paint (LCP) is a Core Web Vital (CWV) metric that marks the point in the page load timeline where the main page content has likely finished loading. To get a good LCP score, the main content on a web page must finish loading in under 2.5 seconds.
How to check an LCP score
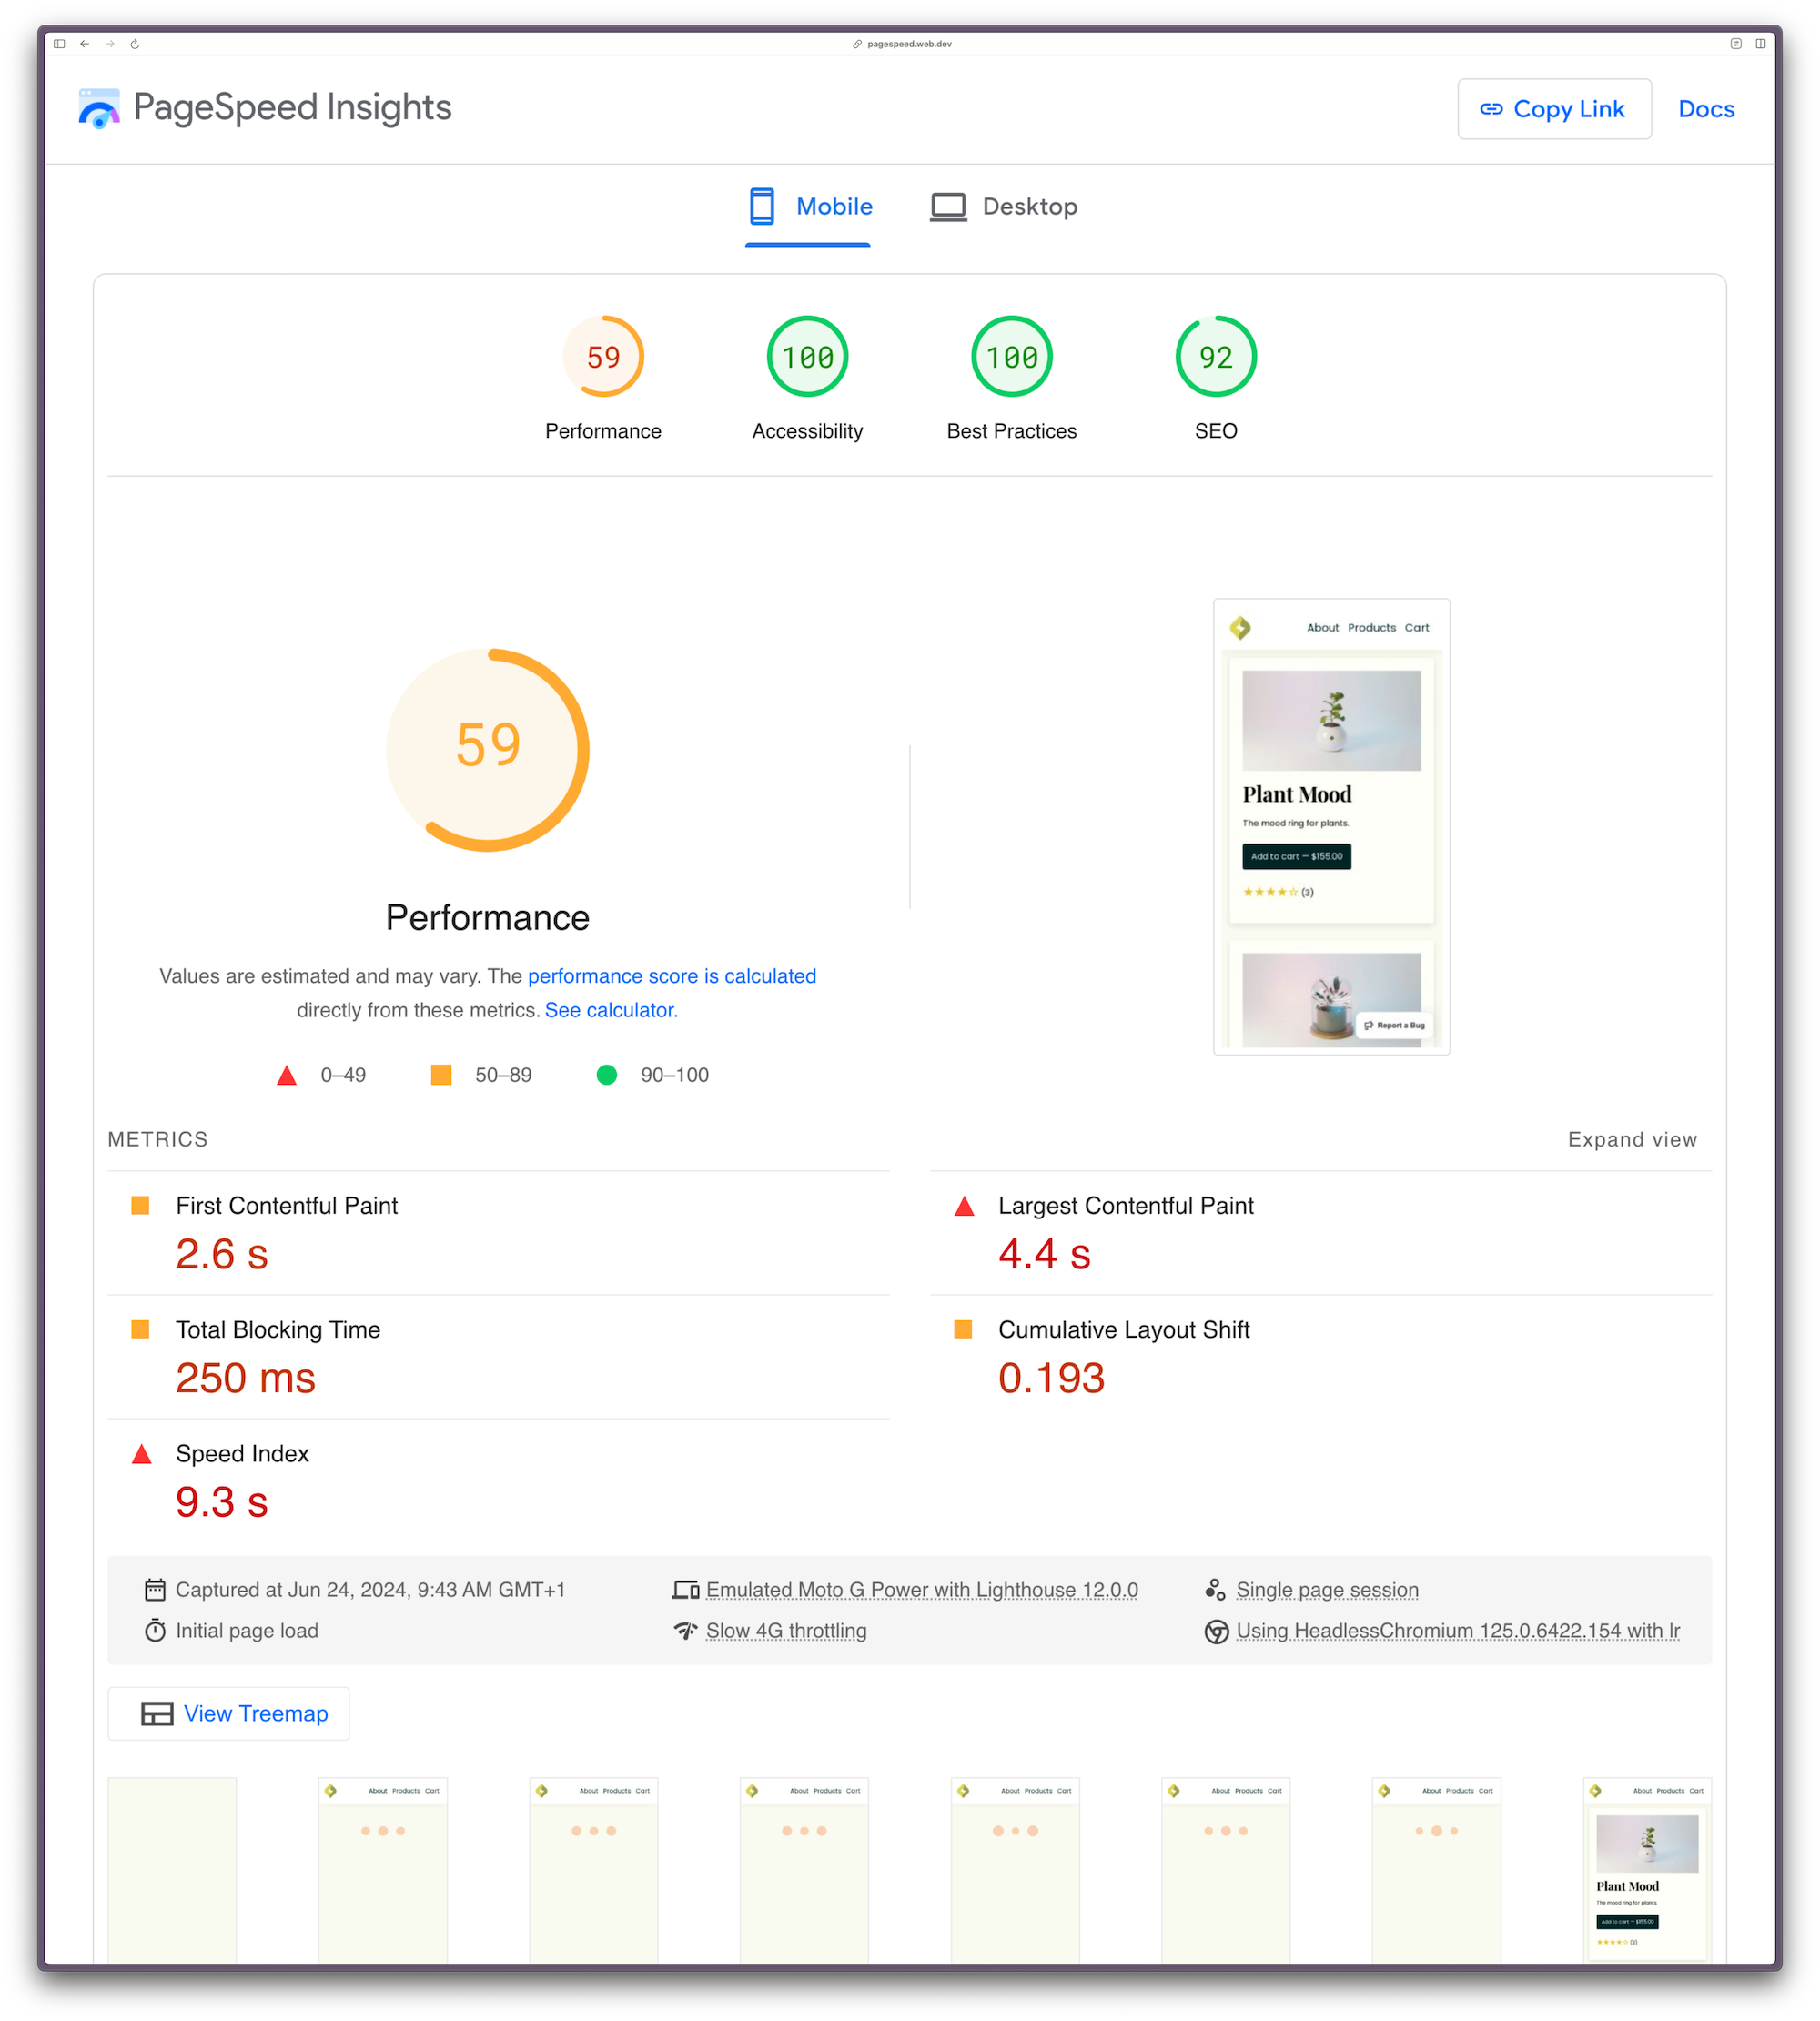
You can conduct a one-off page speed audit to check an LCP score using tools like Page Speed Insights from Google, or Lighthouse in any Chromium browser dev tools, which will produce a report that looks something like this:
The overall performance score of 59 has been calculated from a weighted combination of five different metrics, shown in the metrics grid. If you’d like a more in-depth read about this score calculation, check out How To Hack Your Google Lighthouse Scores In 2024.
Metric scores are graded as “poor,” “needs improvement,” or “good,” and are identified by a color and shape key. The LCP score for this page on this test is 4.4 seconds, which is poor. Additionally, notice at the bottom of the image the frames that were captured during the page load timeline, which shows what a user would experience as the main content loads. We know this is bad, but how do we debug the root cause?
What causes a bad LCP score?
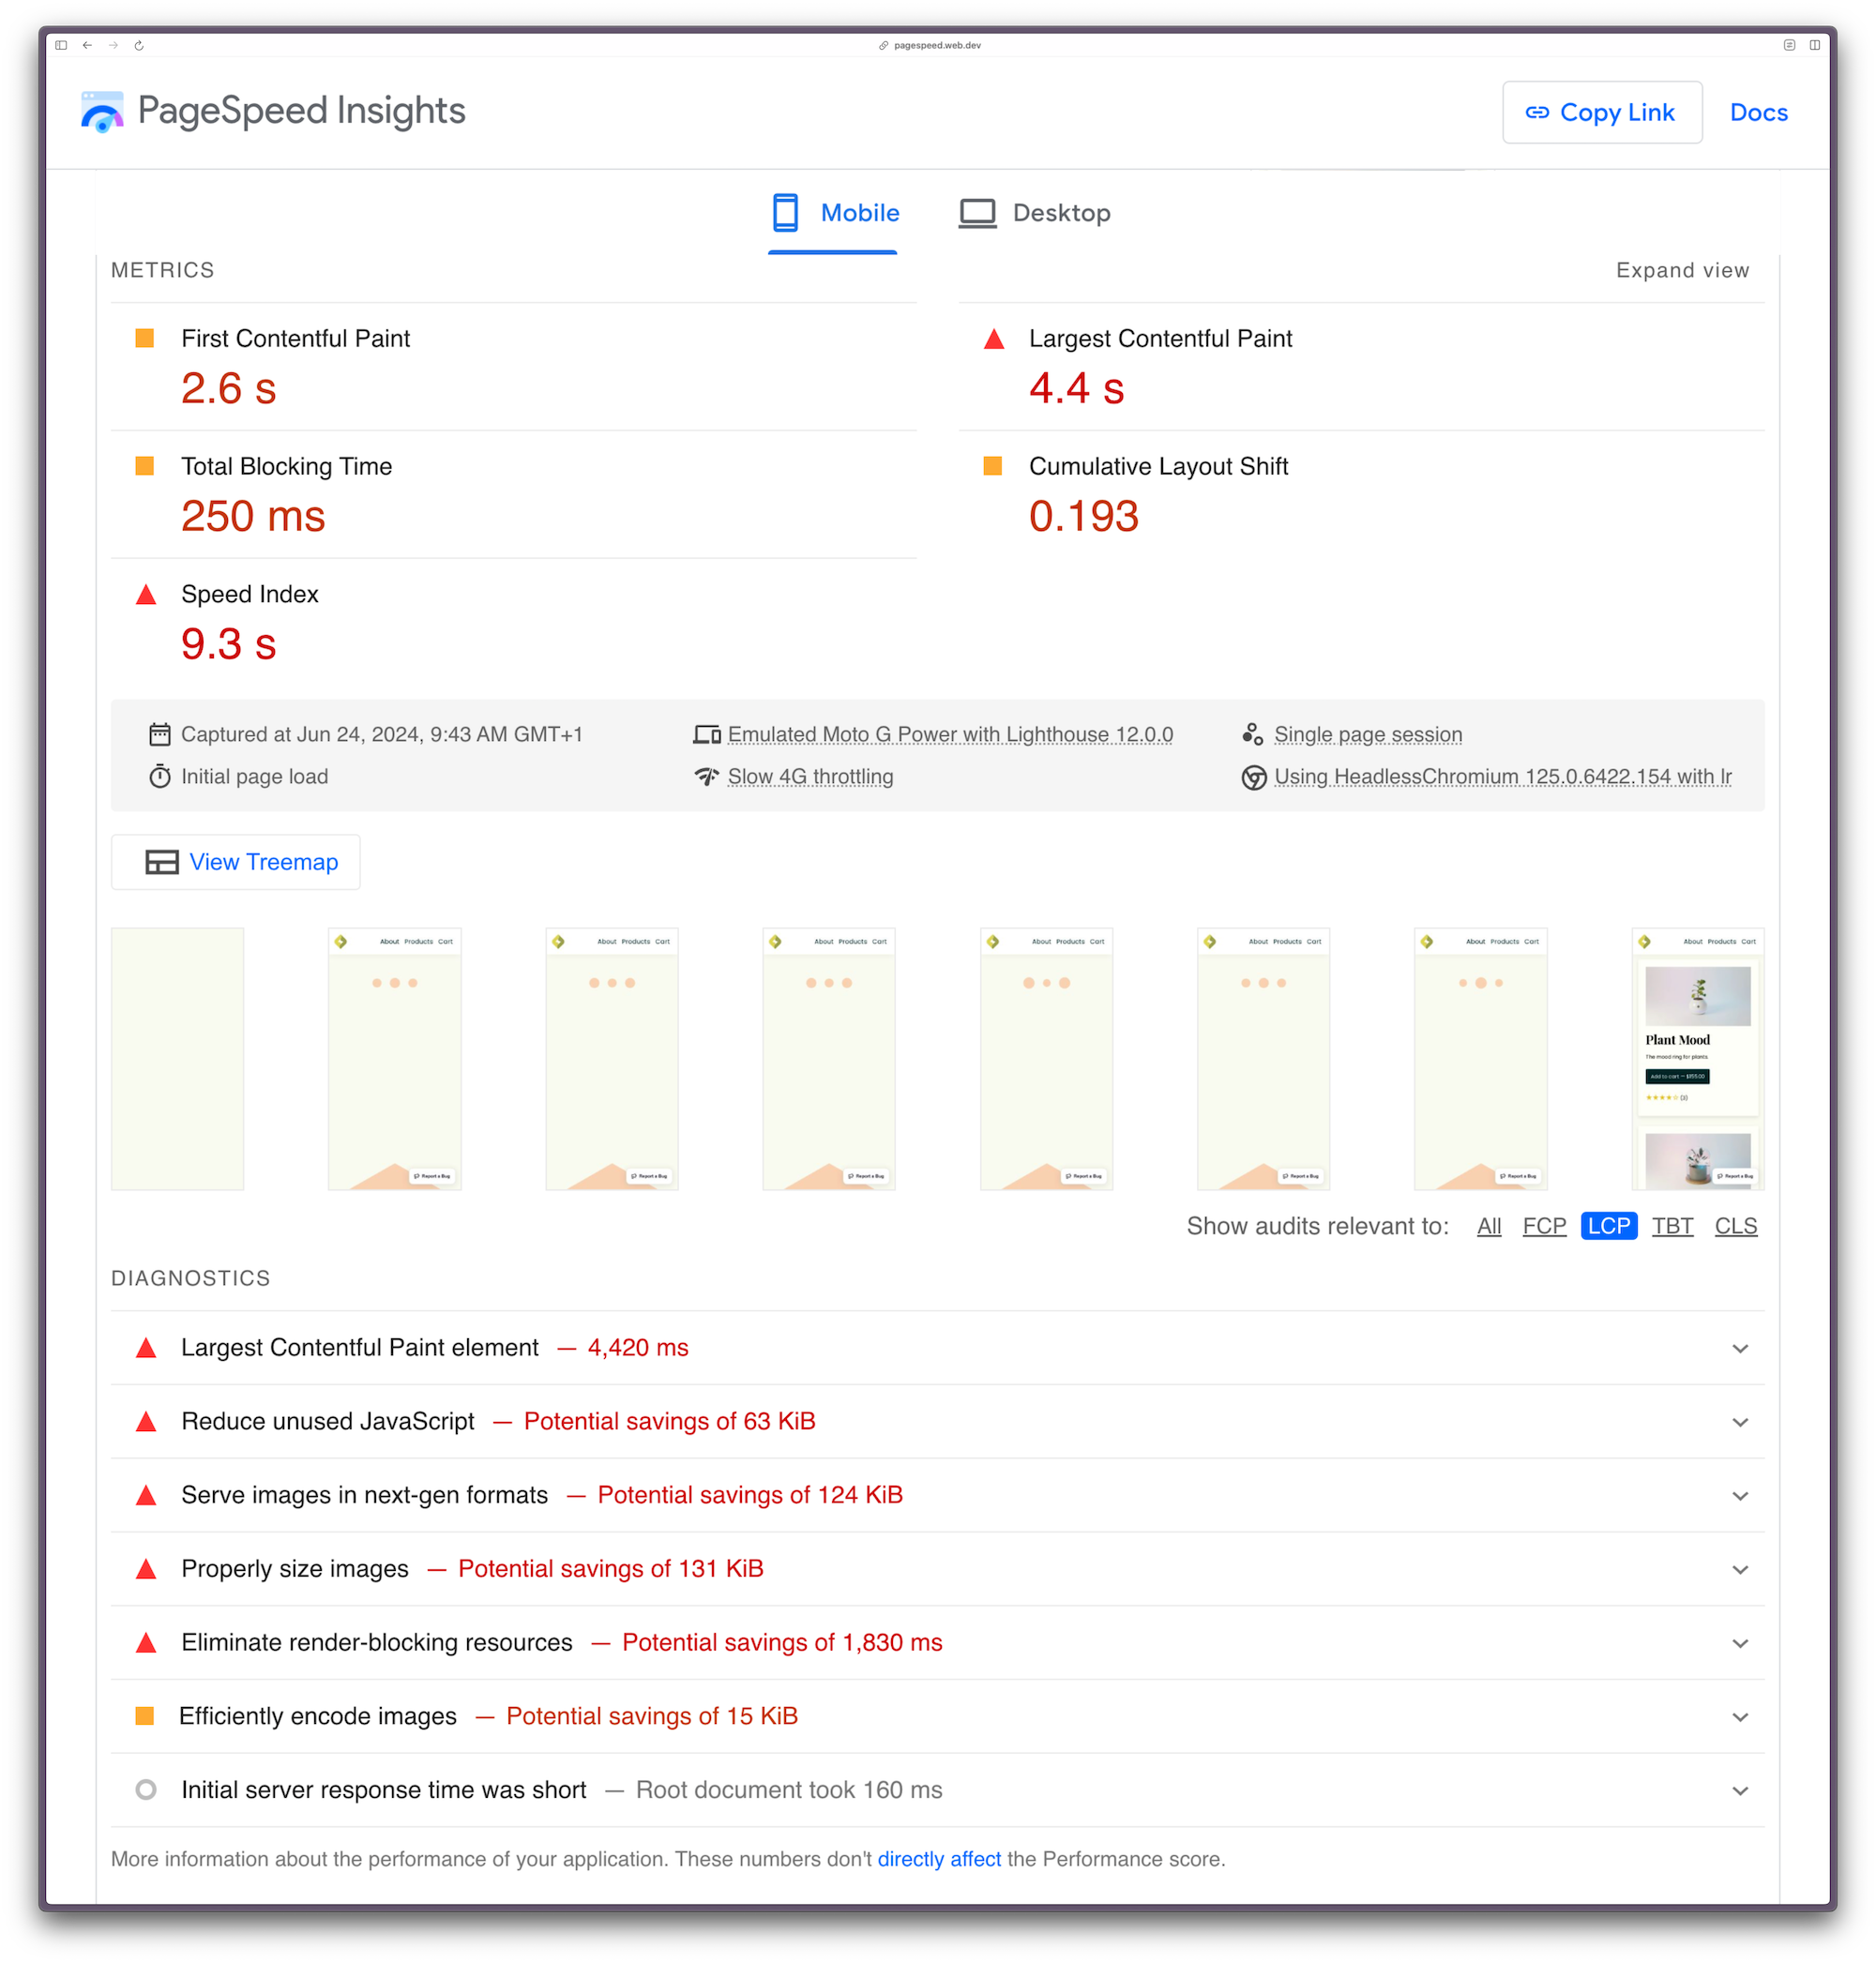
To begin to debug why an LCP score is slow, you can select to show audits relevant to LCP under the visual page load timeline.
Page Speed Insights is advising that our slow LCP could be improved if we:
Reduce unused JavaScript
Serve images in next-gen formats (such as webp and avif formats)
Efficiently encode images (reduce file size without compromising quality)
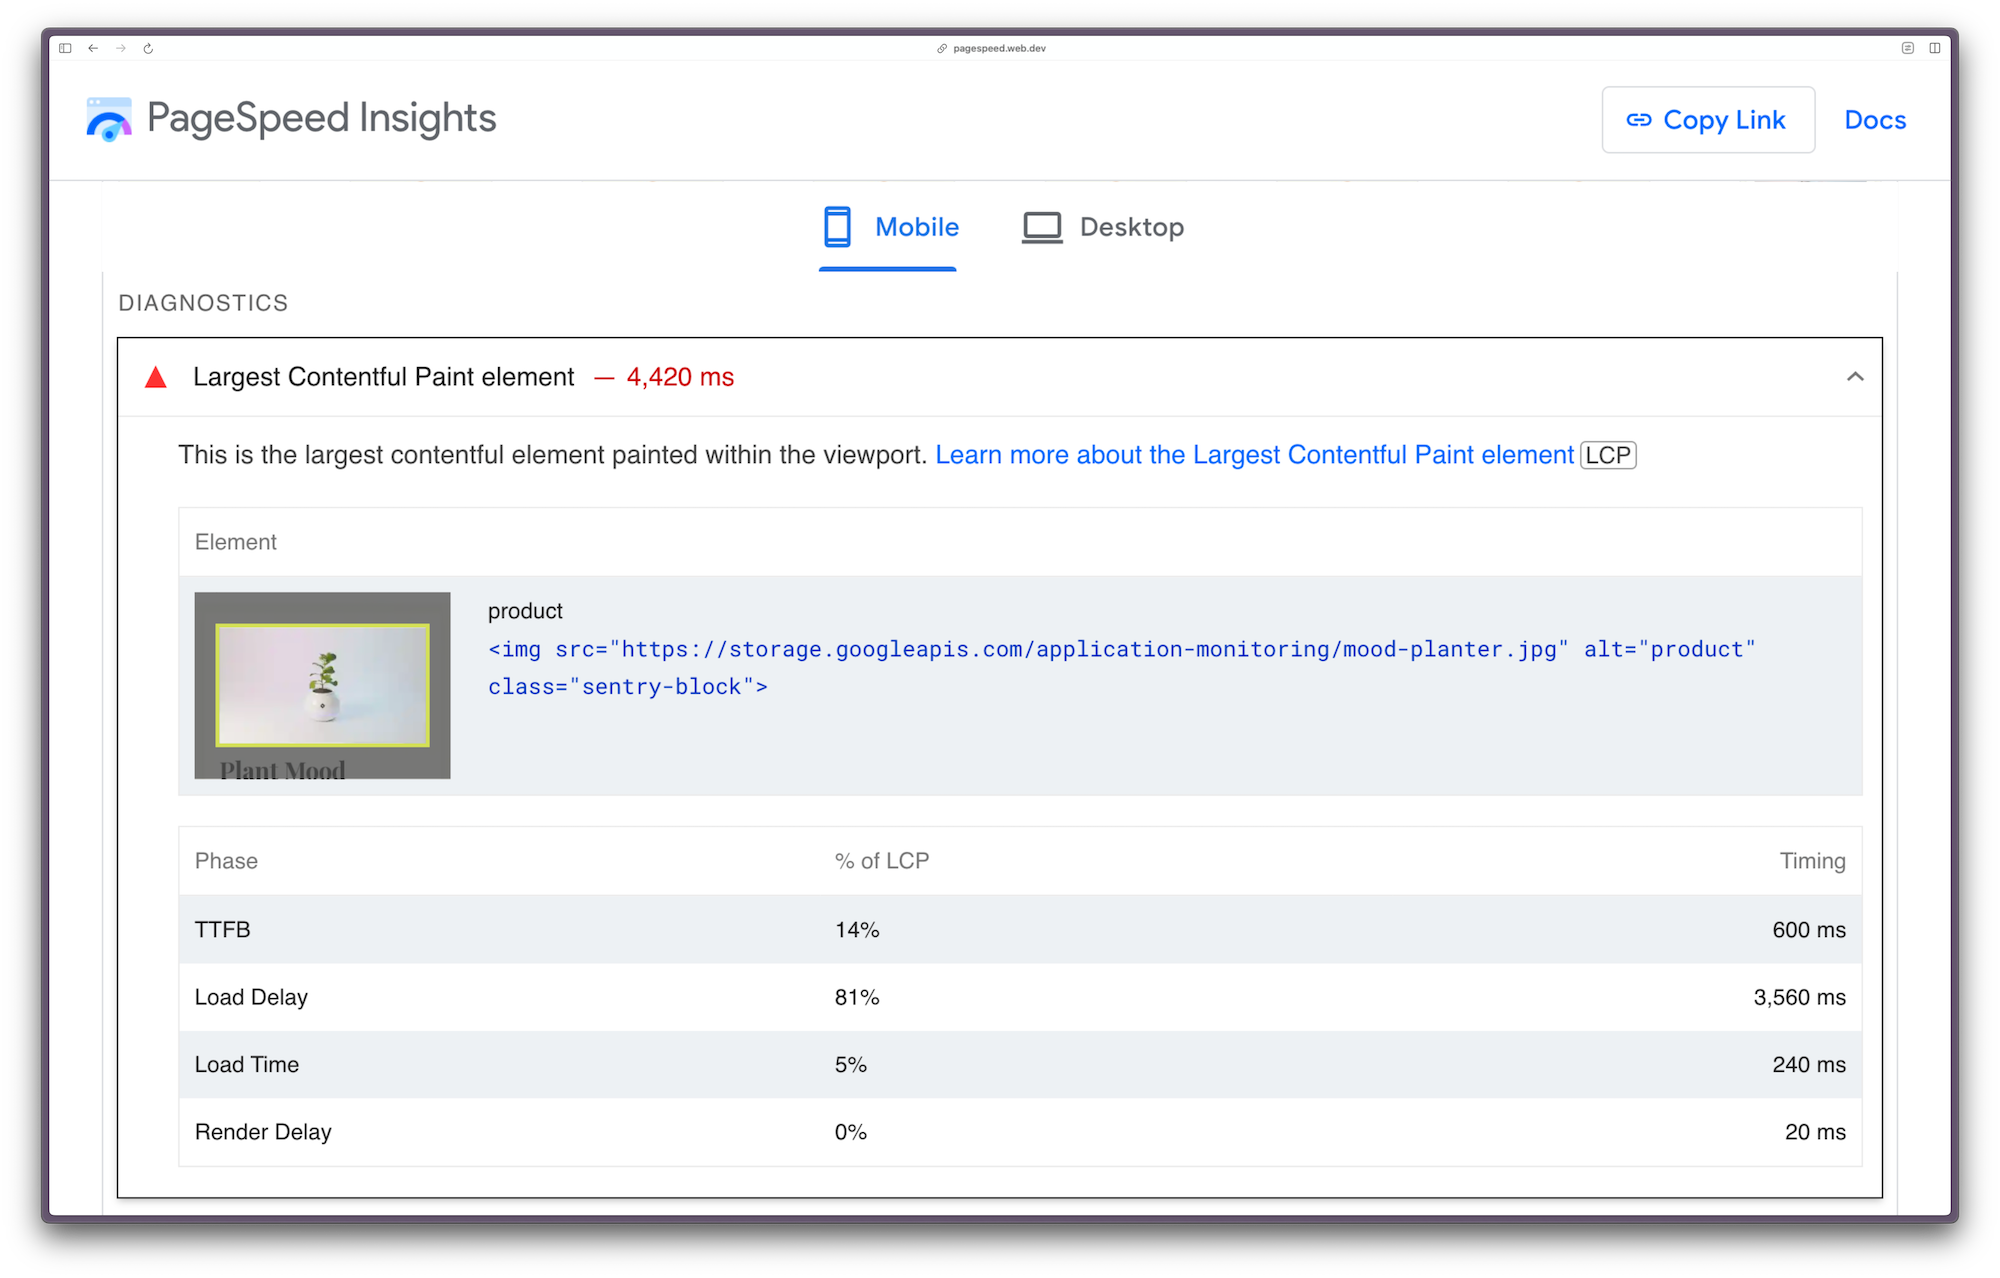
Expanding the item provides more information for each recommendation. Let’s expand the top item — The Largest Contentful Paint element — to see what insights we can gain.
Unfortunately, this panel isn’t telling us anything we didn’t already know. The table shows, we can see that the “Load Delay” phase accounts for 81% of the LCP, which we observed in the visual page load timeline above. But this report can’t tell us why there’s a load delay — and this is what we need to debug!
Tools like Page Speed Insights and Google Lighthouse are great for diagnosing issues and providing actionable advice for front-end performance based on data from a single isolated lab test. What these tools can’t do, however, is evaluate performance across your entire stack of distributed services and applications for a sample of your real users. How do you investigate if the poor LCP score is actually due to an issue in the backend?
Here’s where you need tracing.
How to use tracing to debug a bad LCP score
By tracking the complete end-to-end user journey from the moment a page request is made in a browser across all downstream systems and services to the database and back, tracing helps you identify specific operations causing any performance issues in your full application stack. Each trace comprises a collection of spans. A span is an atomic event full of metadata and contextual information, which helps you further understand the interconnected parts of your distributed systems. Spans are connected and associated with a trace as a result of a unique identifier sent via an HTTP header across those systems. Tracing is also useful in standalone applications that have both a server-side and client-side runtime, such as modern JavaScript meta-frameworks.
We can use tracing to find the root cause of a poor LCP score by tracing the waterfall of events from the moment a user lands on the products page to when the main content finally loads. Let’s go through it step by step.
Or you could skip all of this and scroll right down to this part and just use the Trace Explorer if you’re already using Sentry.
Step 0: Suspect you have a real LCP problem
Most of us can probably tell when a page is slow to load so you might end up skipping this step. That being said, if you did a CWV test using your high-spec dev machine using high-speed internet and the scores were bad, then you know you have a real problem to solve.
Step 1: Install an Application Performance Monitoring (APM) tool SDK (like Sentry) across your entire suite of apps and services
Sentry provides an abundance of SDKs for a variety of programming languages and frameworks. First, sign up to Sentry and create a new project for each of your applications. Each project will have a unique DSN (Data Source Name), which is what you’ll use to point your app to your Sentry project in your code.
Let’s say you’re using React for your front end. Install the Sentry React SDK via your package manager of choice.
npm install @sentry/reactInitialize Sentry in just a few lines of code and configure the browser tracing integration.
import React from "react";
import ReactDOM from "react-dom";
import * as Sentry from "@sentry/react";
import App from "./App";

Sentry.init({
  dsn: "YOUR_PROJECT_DSN",
   integrations: [
    // Enable tracing
    Sentry.browserTracingIntegration(),
  ],
  // Configure tracing
  tracesSampleRate: 1.0, //  Capture 100% of the transactions
});

ReactDOM.render(<App />, document.getElementById("root"));
For your backend, let’s say you’re running a Ruby on Rails app. Add sentry-ruby and sentry-rails to your Gemfile:
gem "sentry-ruby"
gem "sentry-rails"
And initialize the SDK within your config/initializers/sentry.rb:
Sentry.init do |config|
  config.dsn = 'YOUR_PROJECT_DSN'
  config.breadcrumbs_logger = [:active_support_logger]

  # To activate Tracing, set one of these options.
  # We recommend adjusting the value in production:
  config.traces_sample_rate = 0.5
  # or
  config.traces_sampler = lambda do |context|
    true
  end
end
Check out the Sentry docs for your preferred SDK, or create a new project in Sentry where you’ll be guided through the setup process.
Step 2: Sit back and relax whilst your APM tool (Sentry) collects data from real users
Well, you probably won’t be able to relax entirely. Your app is crap and slow to load. Instead, use this time to read angry User Feedback requests about how much of a terrible developer you are. Don’t worry; it’ll all be worth it when you finally find the real source of the LCP performance bottleneck.
Depending on how much traffic your website gets, you might need to wait a few days to get enough data.
Step 3: Explore your Core Web Vitals scores to find aggregated field data that supports your lab data
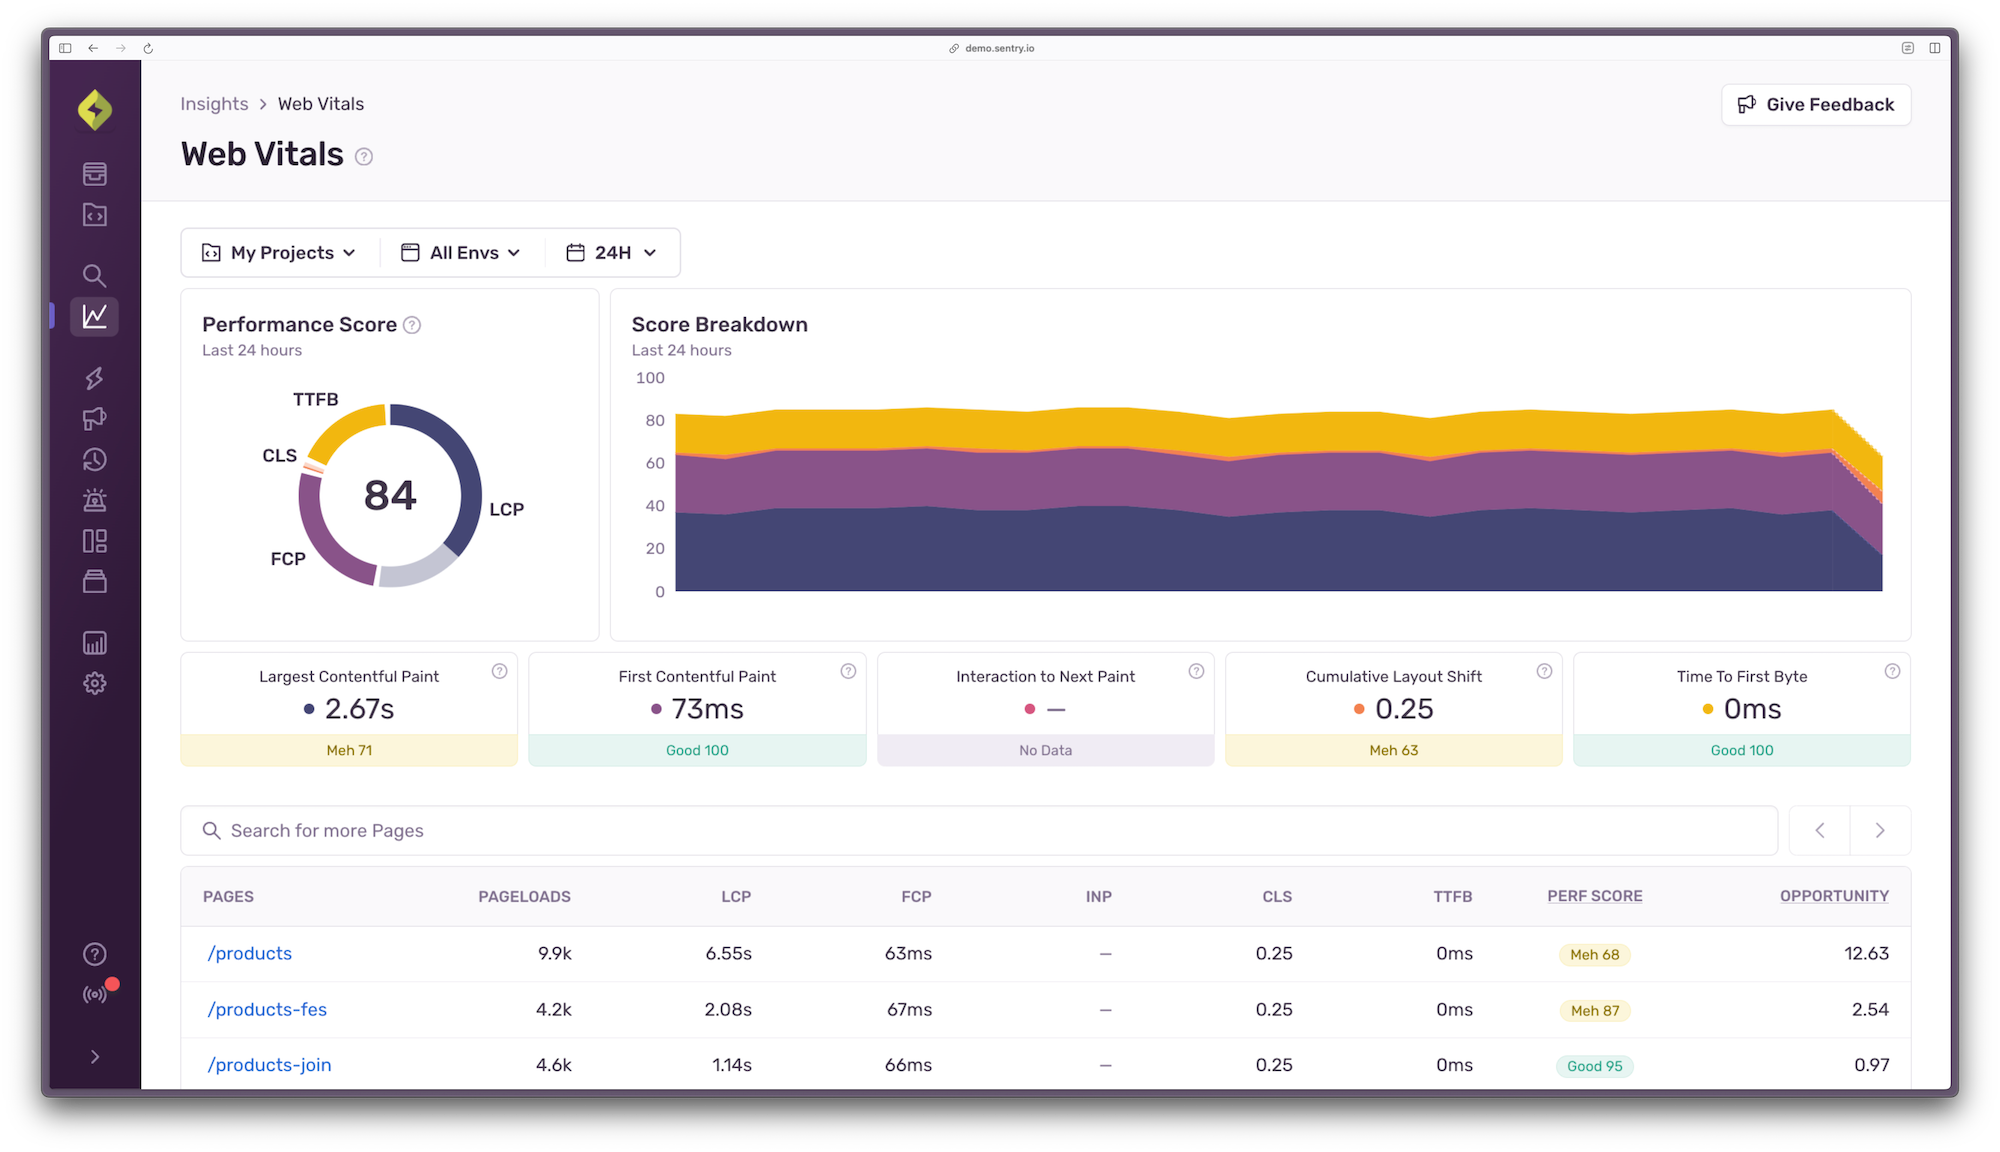
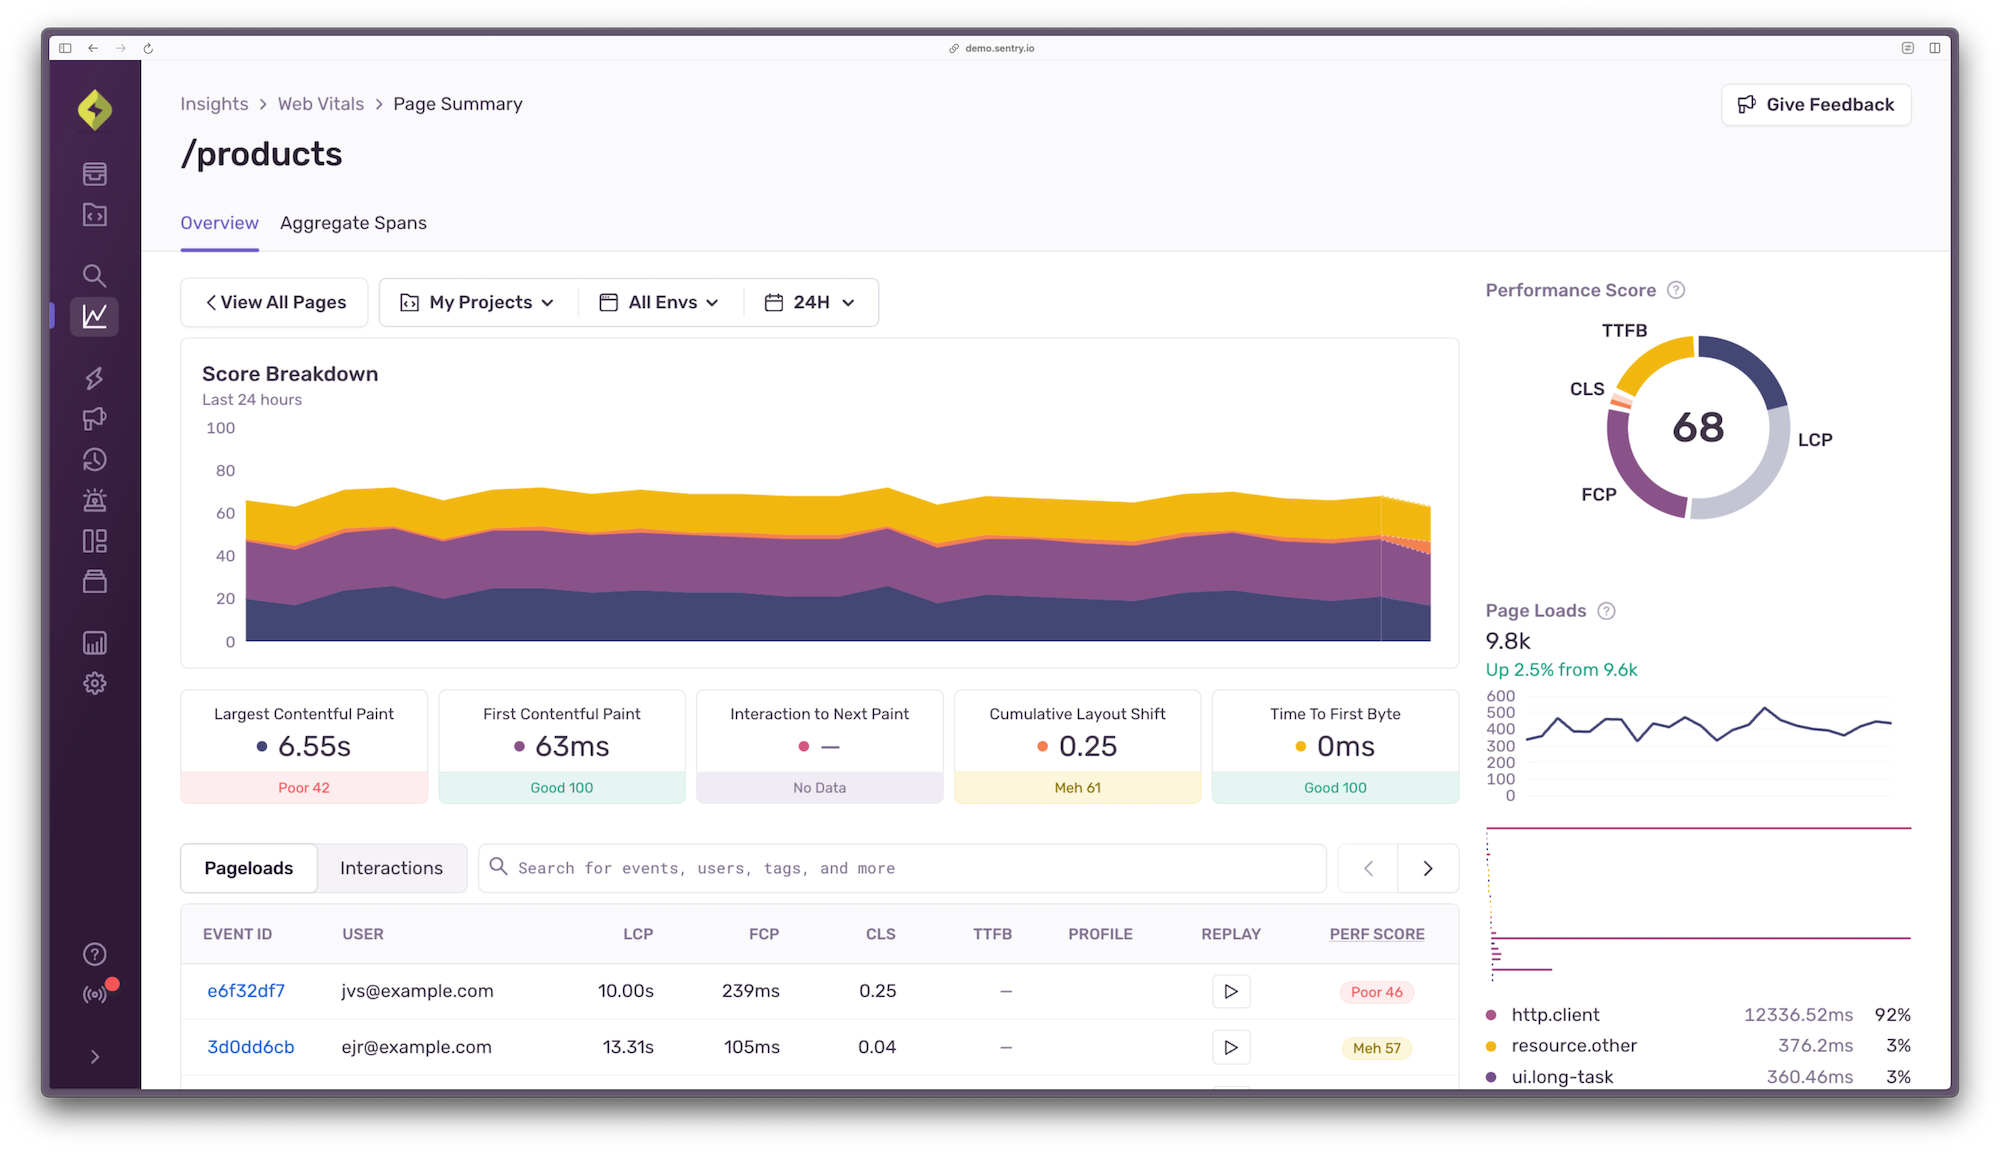
In Sentry, navigate to Insights > Web Vitals for a quick overview of your project’s overall performance score and CWV. Click the table column headings to sort the data by “LCP” descending to confirm the field data lines up with your lab data. It does? Great.
Step 4: Find sampled page load events with a poor LCP score
On the Web Vitals insights page, we’re going to click into the page route with the worst performance to view sampled data for that page route only. In our case, it’s the “/products” page. The Core Web Vitals will look different here (i.e. worse), as they’re calculated using data from just the products page rather than the full application.
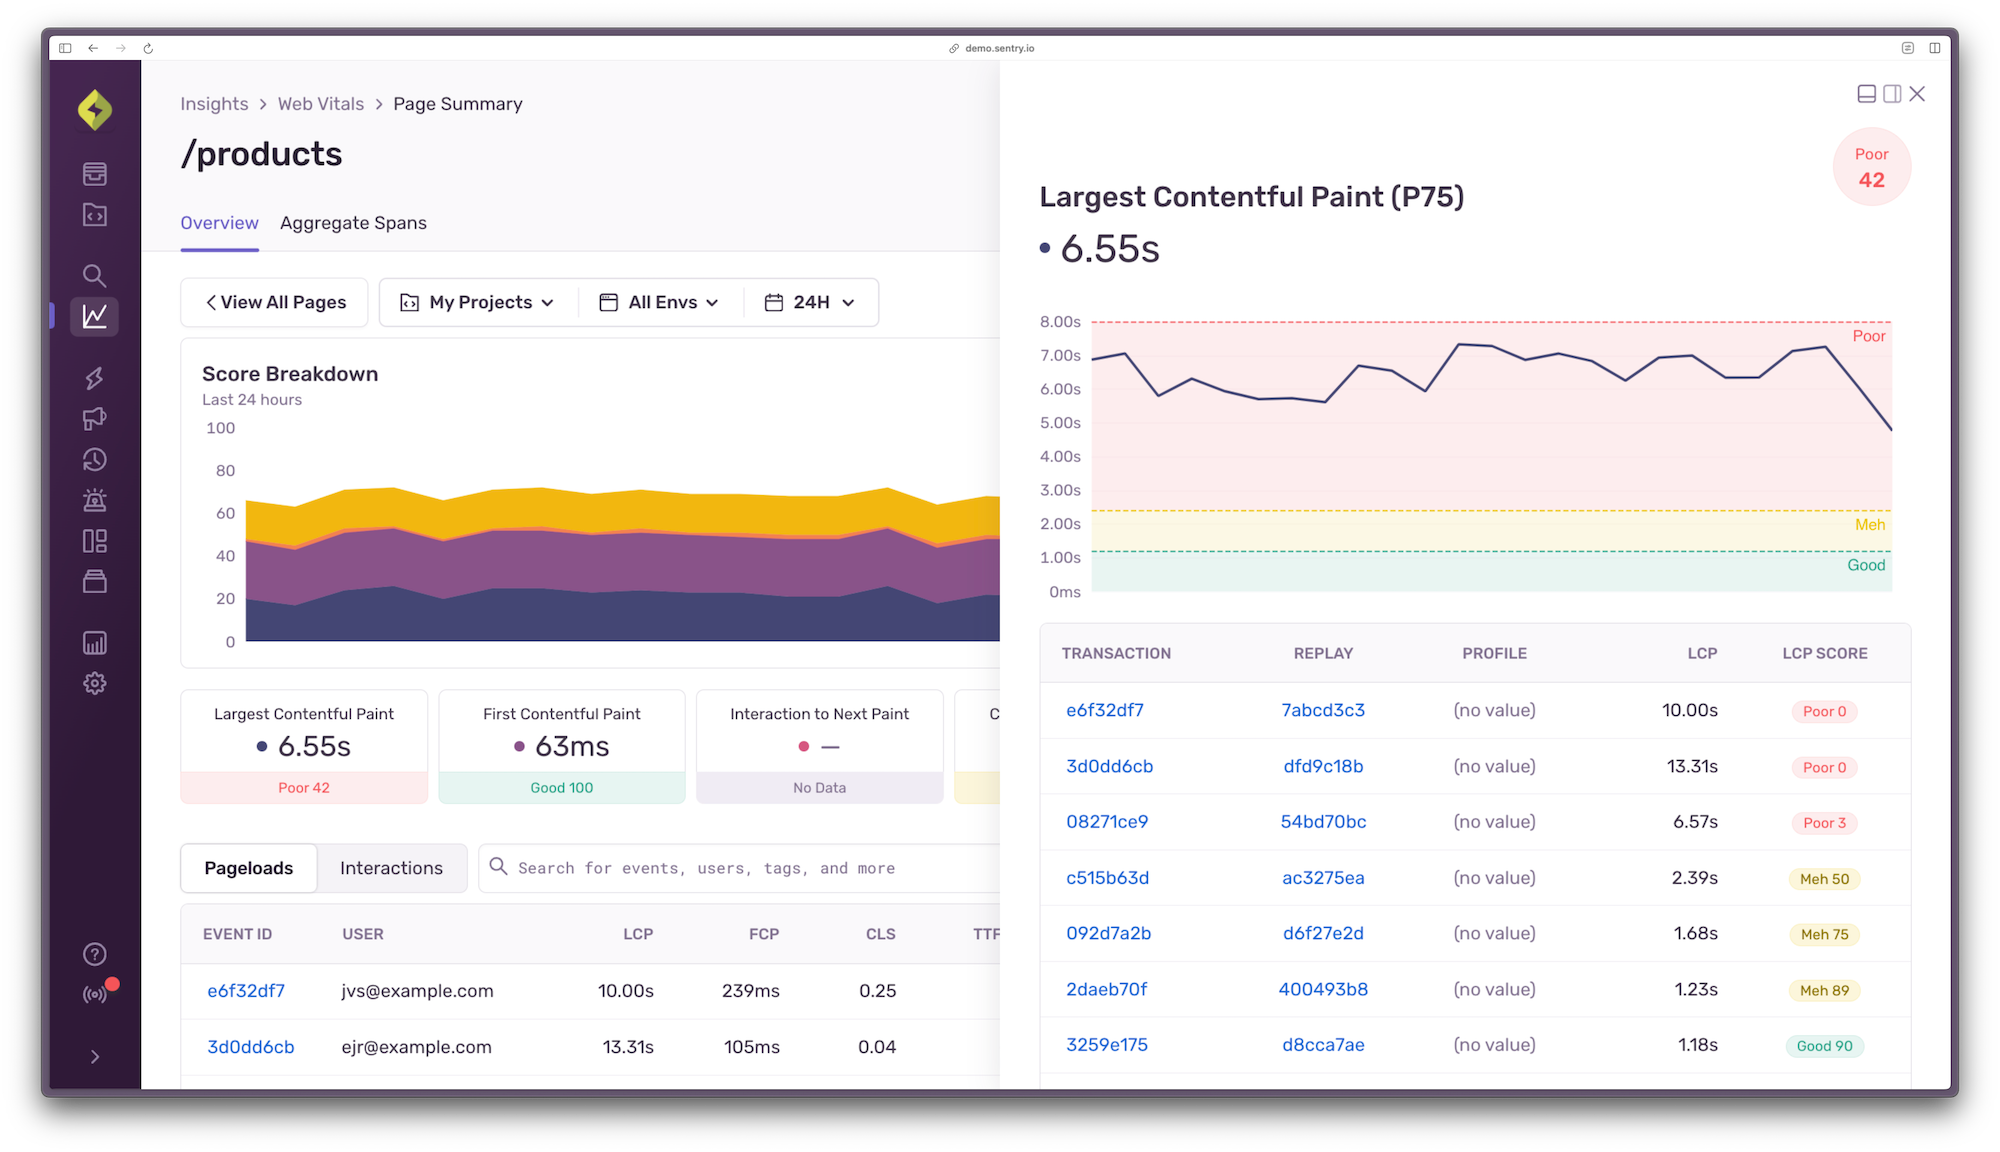
The next step is to explore the full trace of events. There are many ways into the trace view in Sentry, but from this CWV summary, you can click into the LCP score block (which in this case is 6.55s) to view a set of sampled data with a variety of scores across the spectrum.
Click on the transaction at the top of the table with the worst LCP score to view the trace. Here’s where all of your debugging dreams will come true.
Step 5: Explore the full trace of those page load events to discover where the performance bottlenecks are happening
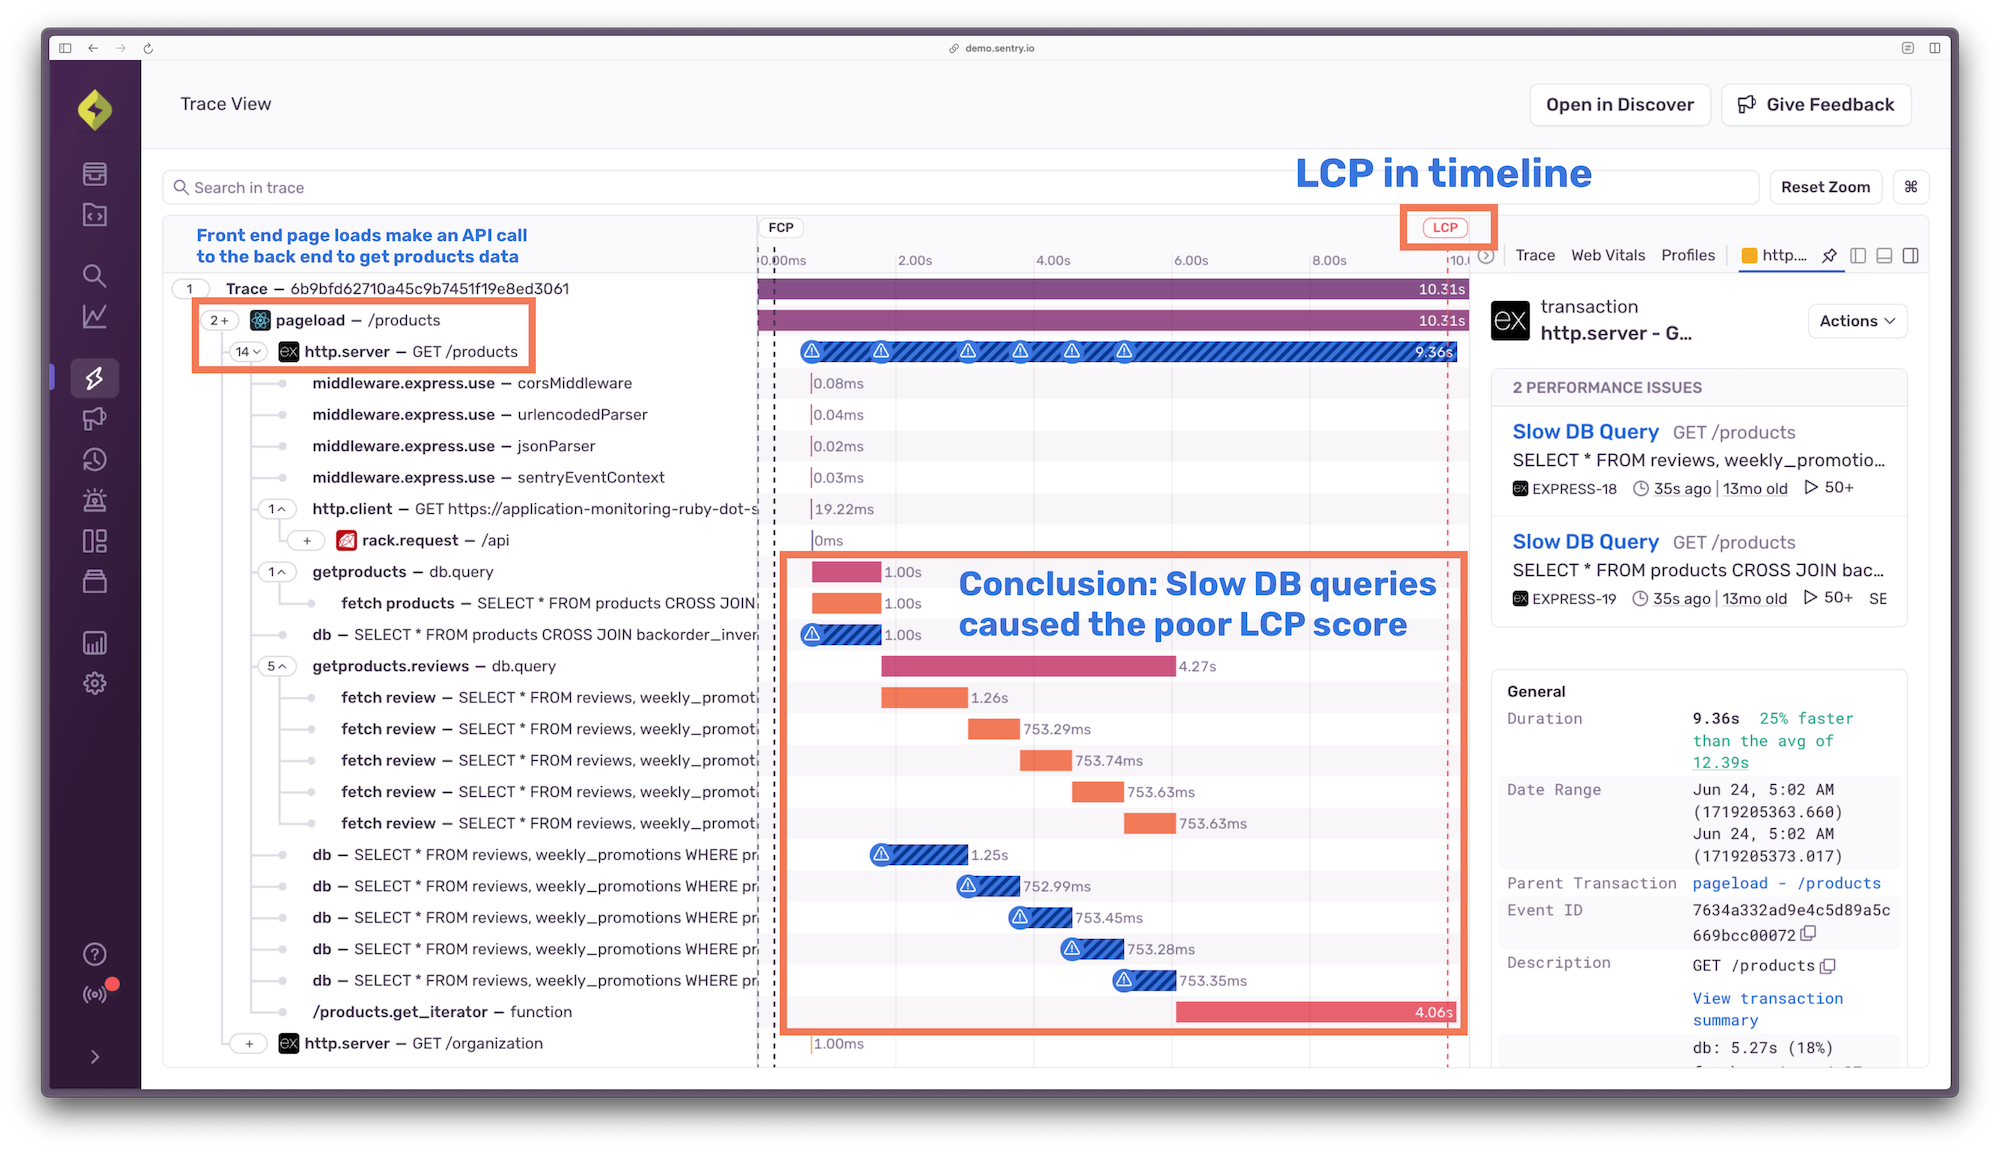
The trace view shows when the LCP happened in the timeline. Every span that was sent to Sentry before the LCP happened is now guilty until proven innocent. Thankfully, we don’t need to interrogate every single span given Sentry has already highlighted the likely causes of any slowdowns with a warning symbol. Expand the spans to investigate deeper until you find the root cause of any bottlenecks. In the case of this application, two slow database queries that happen when a request is made to the products page on the front end are causing the poor LCP score.
We successfully found the root cause of a front end performance issue that didn’t have an obvious fix. We identified the slowdown happened as a result of two specific database queries. It was almost too easy! Now, it’s time to optimize those database queries, which might not be as easy.
But wait, there’s more!
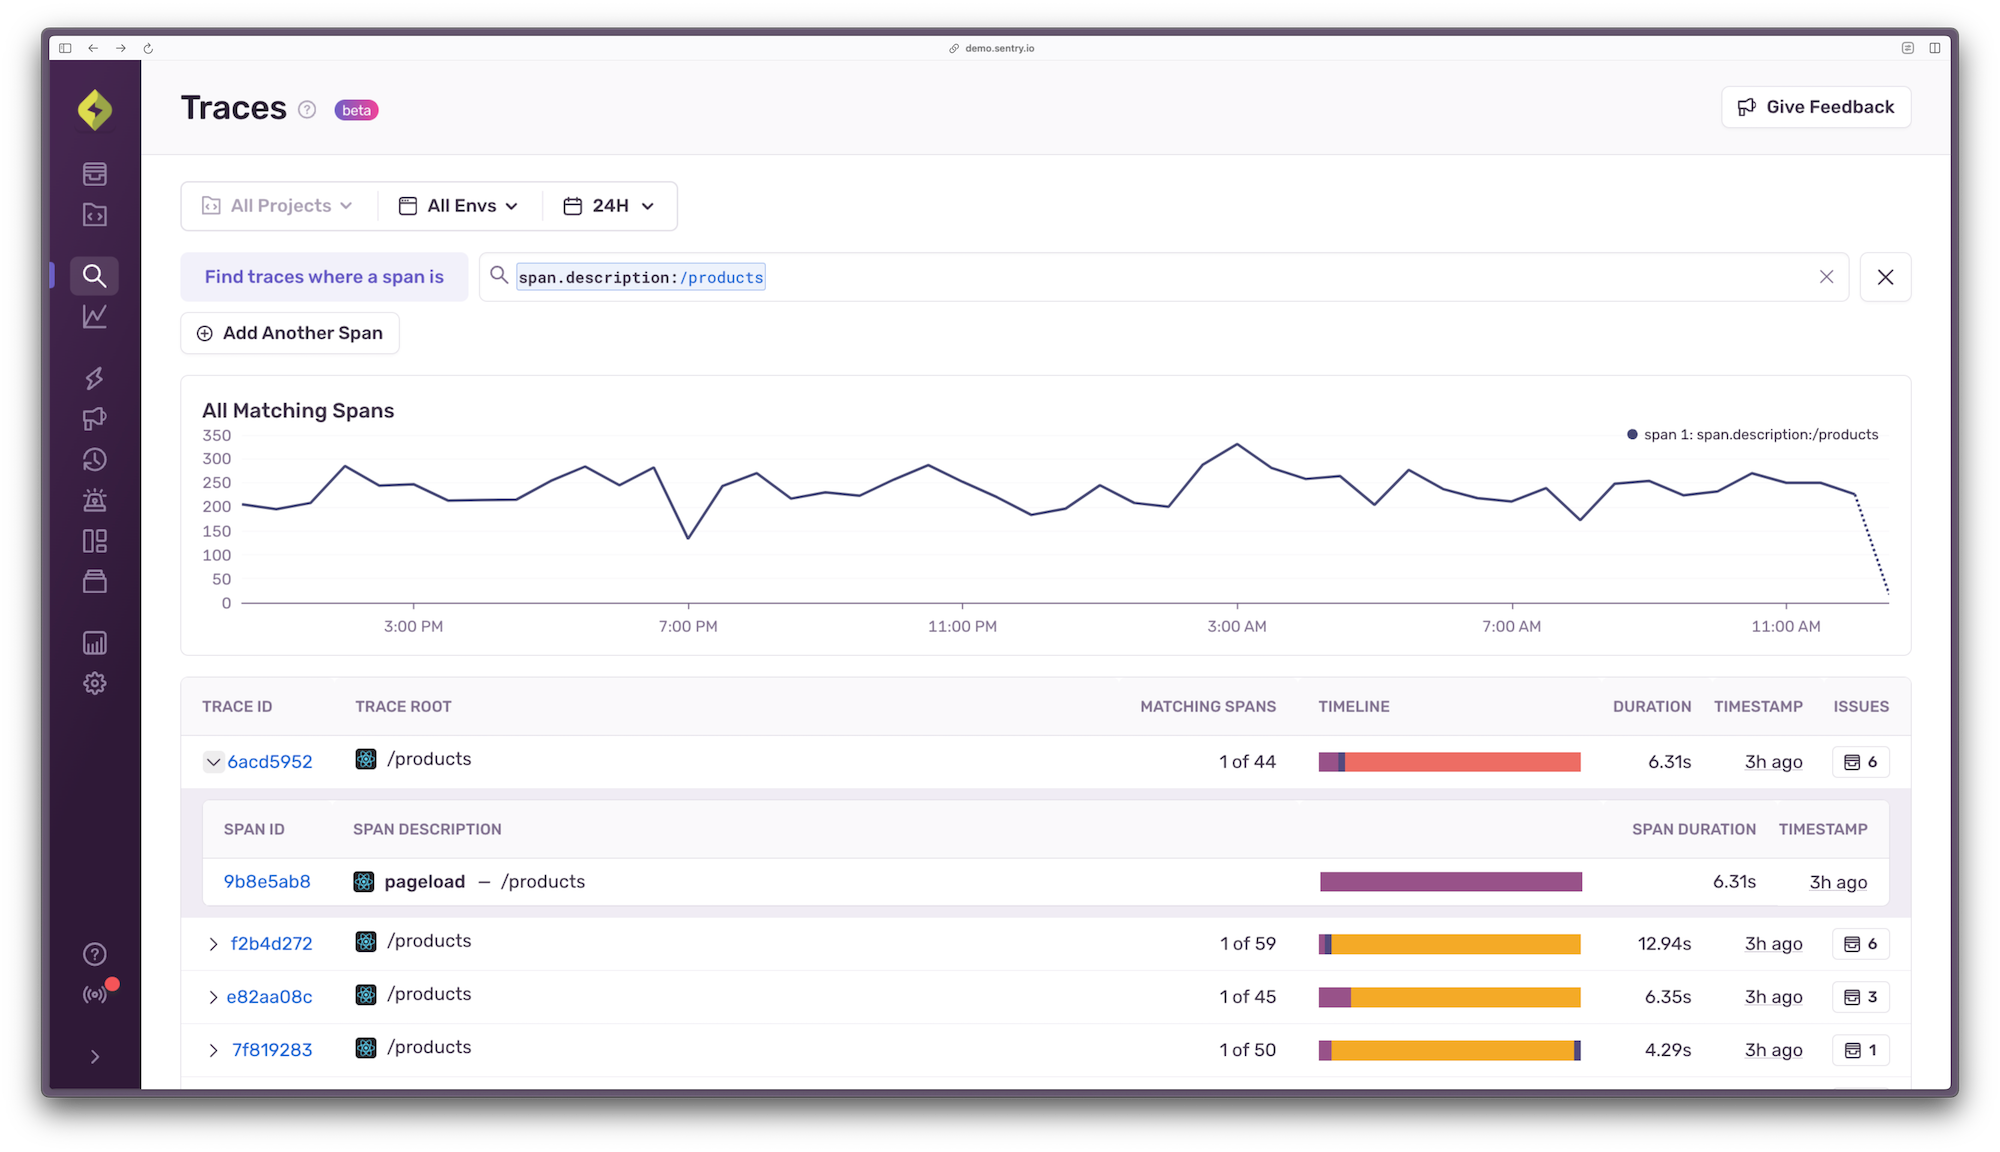
You can skip steps 3-5 and go directly to the Trace Explorer (currently in beta) by navigating to Explore > Trace. On this view, you can filter all spans across your projects by using the search field (which provides hints on what criteria you can filter by).
After discovering the slow LCP issue on the products page, I can use the Trace Explorer to filter all spans by span.description:/products to get a quick overview of the span durations associated with those spans. If I notice anything awry, I can click directly into the trace to investigate.
Try the full debugging experience in real-time
To get an idea of how this Core Web Vitals-based debugging experience might look and feel in the Sentry product, click through this interactive demo.
But wait, there’s even more!
If you’re still not convinced, check out this live Sentry workshop that I recently hosted with Lazar. You’ll get even more insight into how to use Sentry to debug your front-end issues that might have backend solutions, you’ll hear from me about a terrible debugging story that still haunts me to this day, and there may be some jokes. Leave a fun comment if you stop by!

