Usual Performance Suspects: Introducing Suspect Spans
Usual Performance Suspects: Introducing Suspect Spans


A trace is the end-to-end journey of one or more connected spans and a span is an operation or “work” taking place on a service. So when it comes to debugging a performance issue, being able to pick out slow spans out of a line up is the fastest way to seeing the root cause and knowing how to solve it.
Suspect Spans surfaces a list of spans that correspond to where the most time in a transaction is spent. Instead of clicking into every trace in an attempt to identify the bad actor, check out the Spans tab or Suspect Spans section in every transaction summary and jump directly to the span that needs your attention.
But, this isn't your uncle's performance monitoring. We don’t just show you when your service or application is slow, we show you where and how to solve it. While our newest addition, Suspect Spans, helps you address the slowest spans, not all transactions are the same. That's why we built Operations Breakdown and Suspect Tags, to give you a different level of granularity to help you solve any performance problem.
Using Suspect Spans to eliminate redundant queries
A few weeks ago, one of our Product Managers noticed a slow loading table on one of Sentry’s pages. Because we knew the endpoint and transaction behind that table, we could easily locate the transaction in our performance monitoring tool. We opened up the transaction in Performance and then clicked on the Span tab.
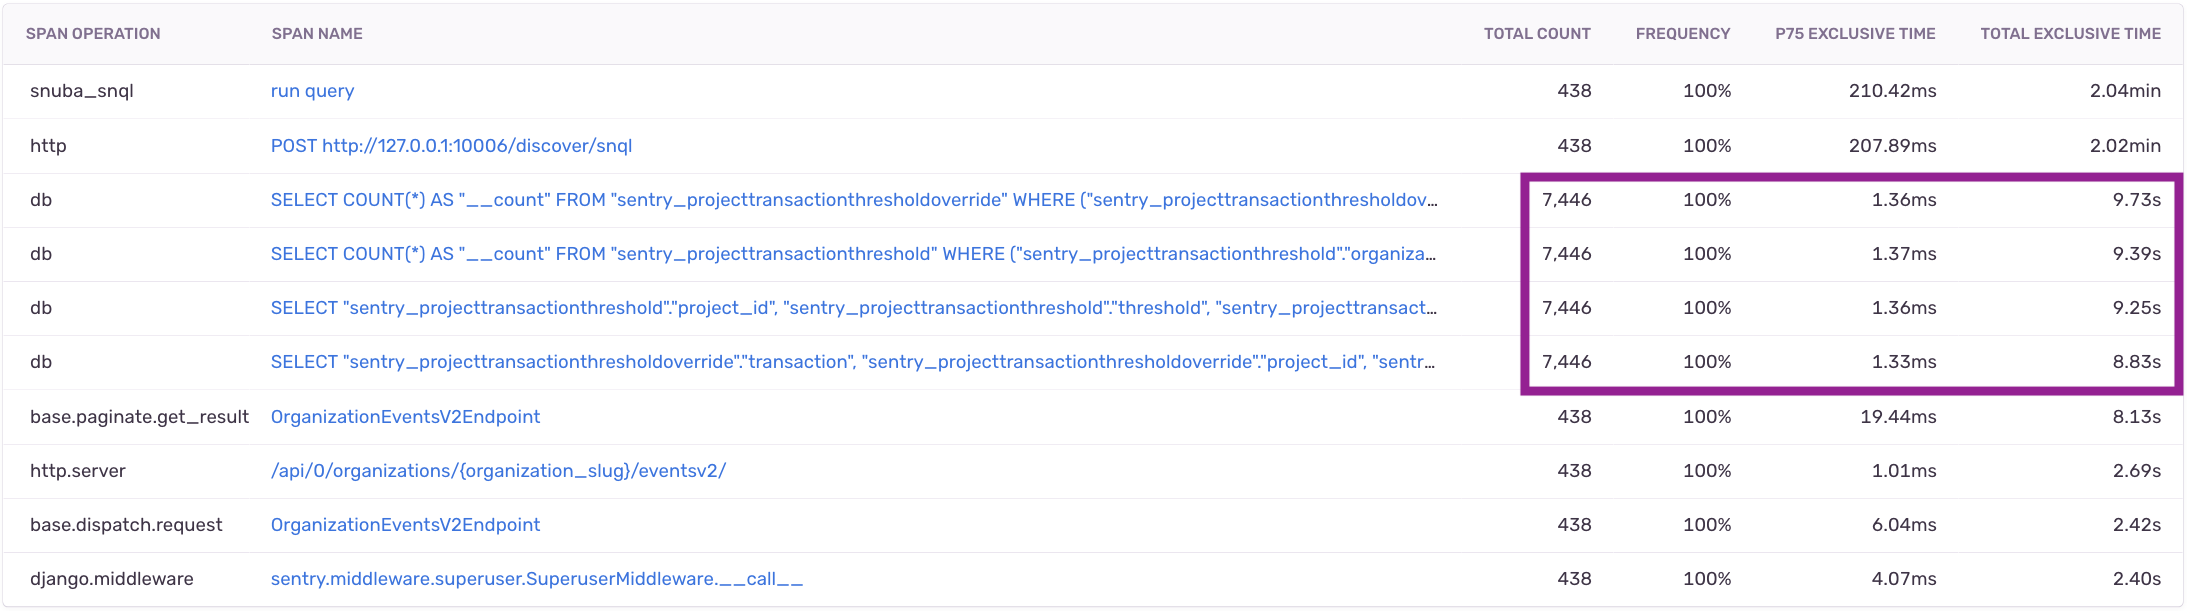
Suspect Spans identified four redundant database queries. The table queried the database 17 times to pull the exact same data. Since the value from the query was always the same, we reduced the cost of running that query by caching the value.
Before
After
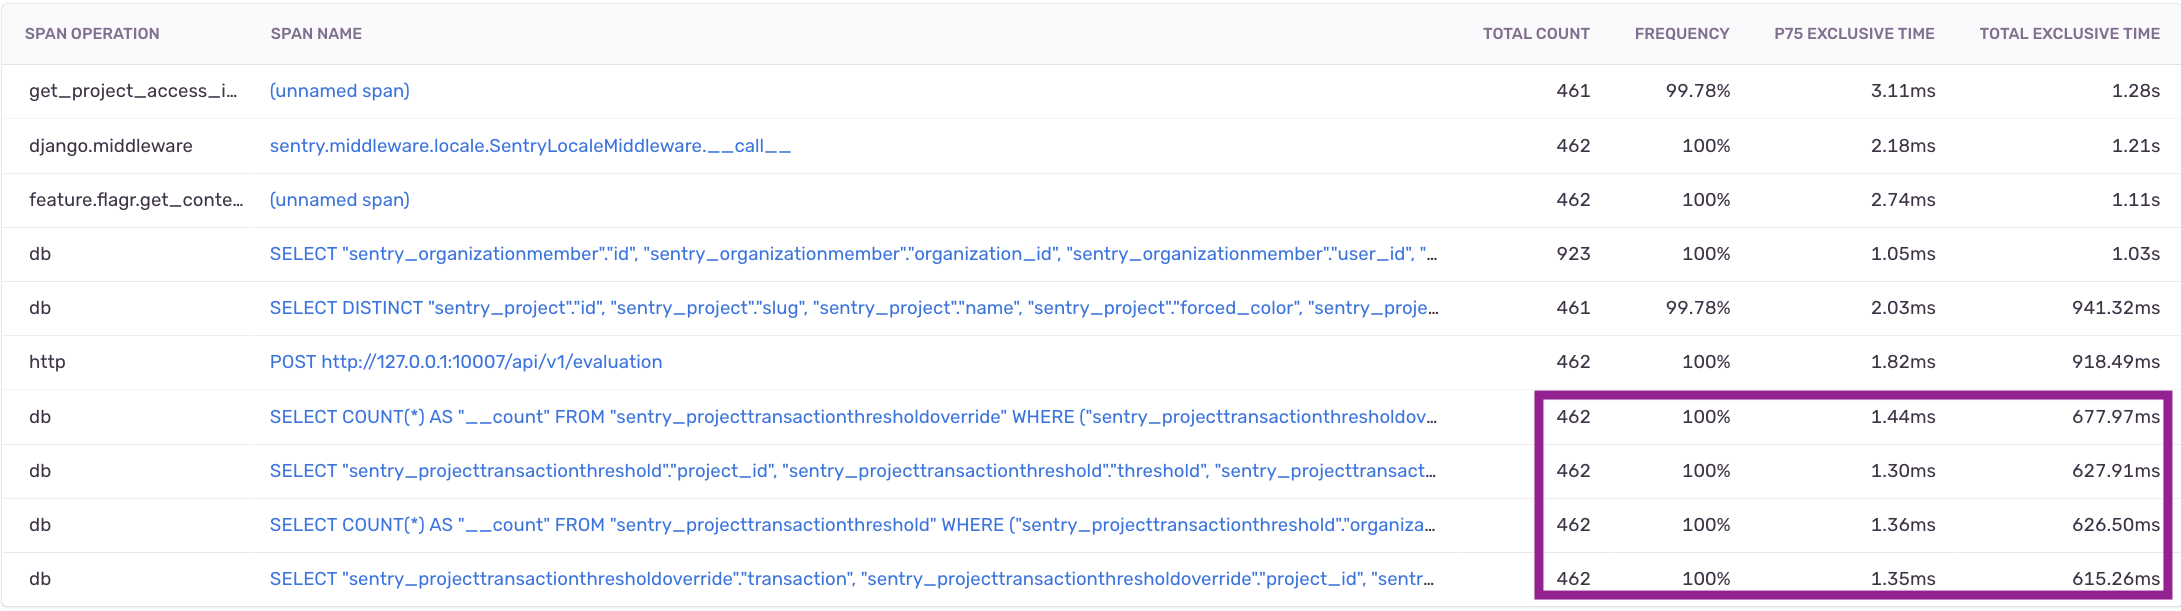
Making this change resulted in a reduction in the number of queries from 4 * 17 = 68 to just 4 per request, reducing the overall response by ~35%.
Suspect Spans points you to the transactions with spans that are likely responsible for slowing it down. We summed up the time spent inside a span using Total Exclusive Time. With this filter, you can sort the transaction table by count and P50/75/95 or 99 exclusive times — so you can focus your time and energy on high-impact transactions. Use Total Count and Total Exclusive Time to see the example spans that occur frequently and take up the most time. You can also use Average Count to spot N+1 problems faster or use Operations Breakdown to show you how much time was spent in each operation within a transaction.
Spotting Outliers with Operations Breakdown
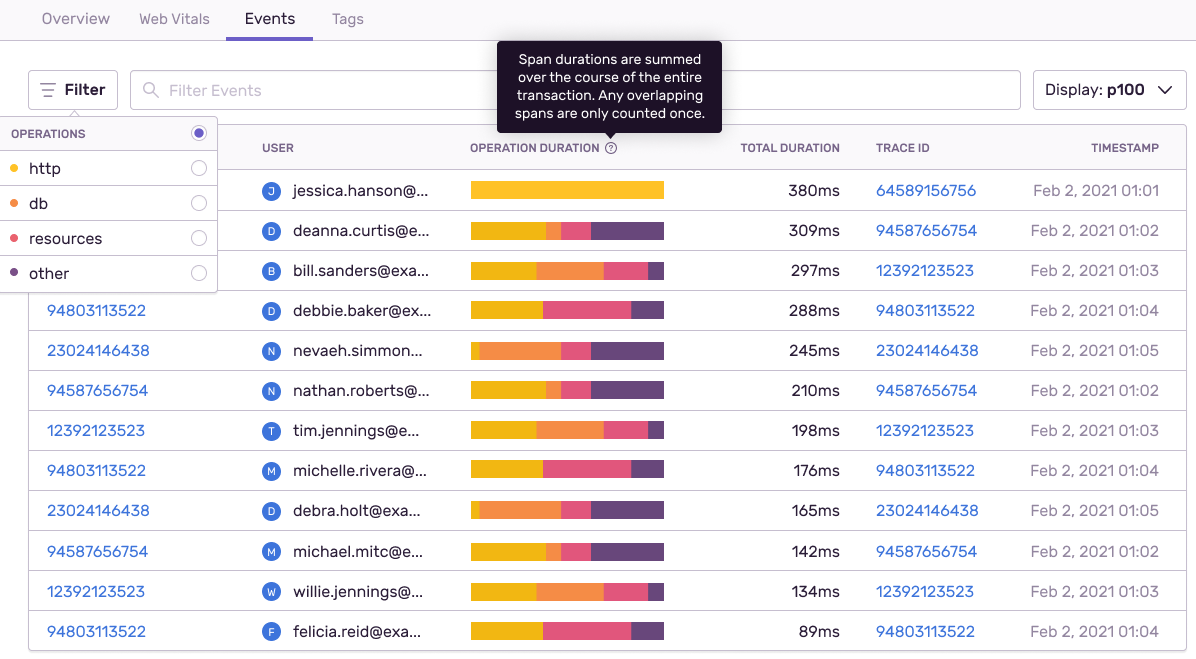
Most transactions have variations, especially if something isn’t working right. When variations happen, you can sort how much time was spent on each operation. In these situations (like the first user below), you can use Operations Breakdown to see why those transactions differed from the performant ones.
In this case, the transaction didn’t even get to the query or resource span. Instead, all of the time was consumed on the HTTP span, where it probably errored out. You can use Operations Breakdown with Suspect Spans to see which transactions have the greatest impact on your user’s experience. So, when you understand which transactions to prioritize, you can focus your efforts on the issues that impact your users most.
Surface common events that slow down a transaction with Suspect Tags
Sometimes when you’re dealing with lots of data, it’s hard to investigate an issue when there is so much noise. When a problem arises, the distribution of event tags can provide clues to help you uncover the cause of the issue. Using the heat map, you can explore tags that are disproportionately represented in your slow transactions.
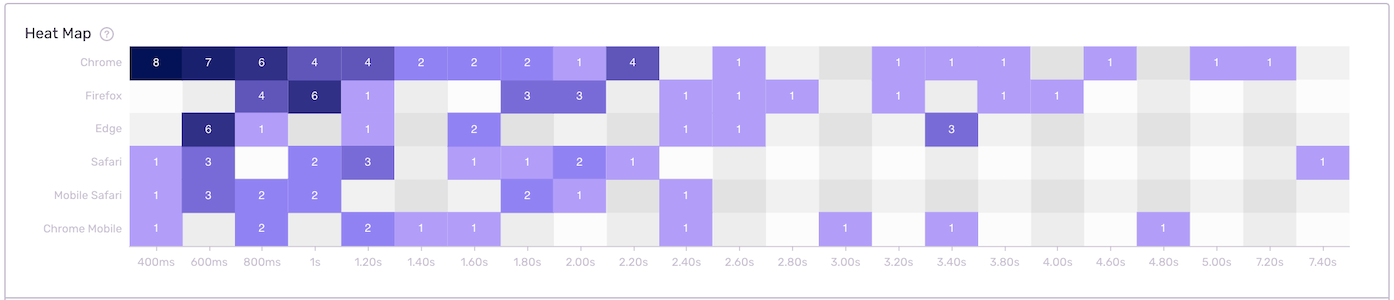
When you look at the transaction summary, you can see a list of suspect tags that correspond to slower transactions. You can click on the tag value to filter out transactions that match to slow performance. Alternatively, you can add custom tags, which make it easy to find and visualize performance groups within your transactions.
Get started with Performance and drop us a line at our forum or on Discord. And if you’re new to Sentry, you can try it for free today or write to sales@sentry.io to get started.


