Distributed Tracing 101 for Full Stack Developers


Ben Vinegar - Last Updated:

This is part one of a two-part series on distributed tracing for full-stack developers. It covers what distributed tracing is and how it works. Part two looks at Why you need distributed tracing, but we'll get to that one later.
In the early days of the web, writing web applications was simple. Developers generated HTML on the server using a language like PHP and communicated with a single relational database like MySQL. Most interactivity was driven by static HTML form components. While debugging tools were primitive, understanding the execution flow of your code was straightforward.
In today’s modern web stack, it’s anything but. Full-stack developers are expected to write JavaScript executing in the browser, establish interoperability with multiple database technologies, and deploy server-side code on different server architectures (for example, serverless). Without the right tools, understanding how a user interaction in the browser cascades into a 500 server error deep in your server stack is nigh impossible. Enter: distributed tracing.

Me trying to explain a bottleneck in my web stack in 2021.
Distributed tracing is a monitoring technique that links the operations and requests occurring between multiple services. This allows developers to “trace” the path of an end-to-end request as it moves from one service to another, letting them pinpoint errors or performance bottlenecks in individual services that are negatively affecting the overall system.
In this post, we’ll learn more about distributed tracing concepts, go over an end-to-end tracing example in code, and see how to use tracing metadata to add valuable context to your logging and monitoring tools. When we’re done, you’ll understand the fundamentals of distributed tracing and how you can apply tracing techniques to be more effective in debugging your full-stack web applications.
But first, let’s go back to the beginning: What is distributed tracing again?
Distributed tracing basics
Distributed tracing is a method of recording the connected operations of multiple services. Typically, these operations are initiated by requests from one service to another, where a “request” could be an actual HTTP request or work invoked through a task queue or some other asynchronous means.
Distributed tracing has two fundamental concepts: spans and traces.
A span is a named and timed operation that represents a part of the application’s flow. Spans can refer to broad operations – for example, the operation of a web server responding to an HTTP request – or a task as granular as a single invocation of a function.
A trace describes the end-to-end journey of one or more connected spans. A trace is considered a distributed trace if it connects spans (“work”) performed on multiple services.
Let’s take a look at an example of a hypothetical distributed trace:
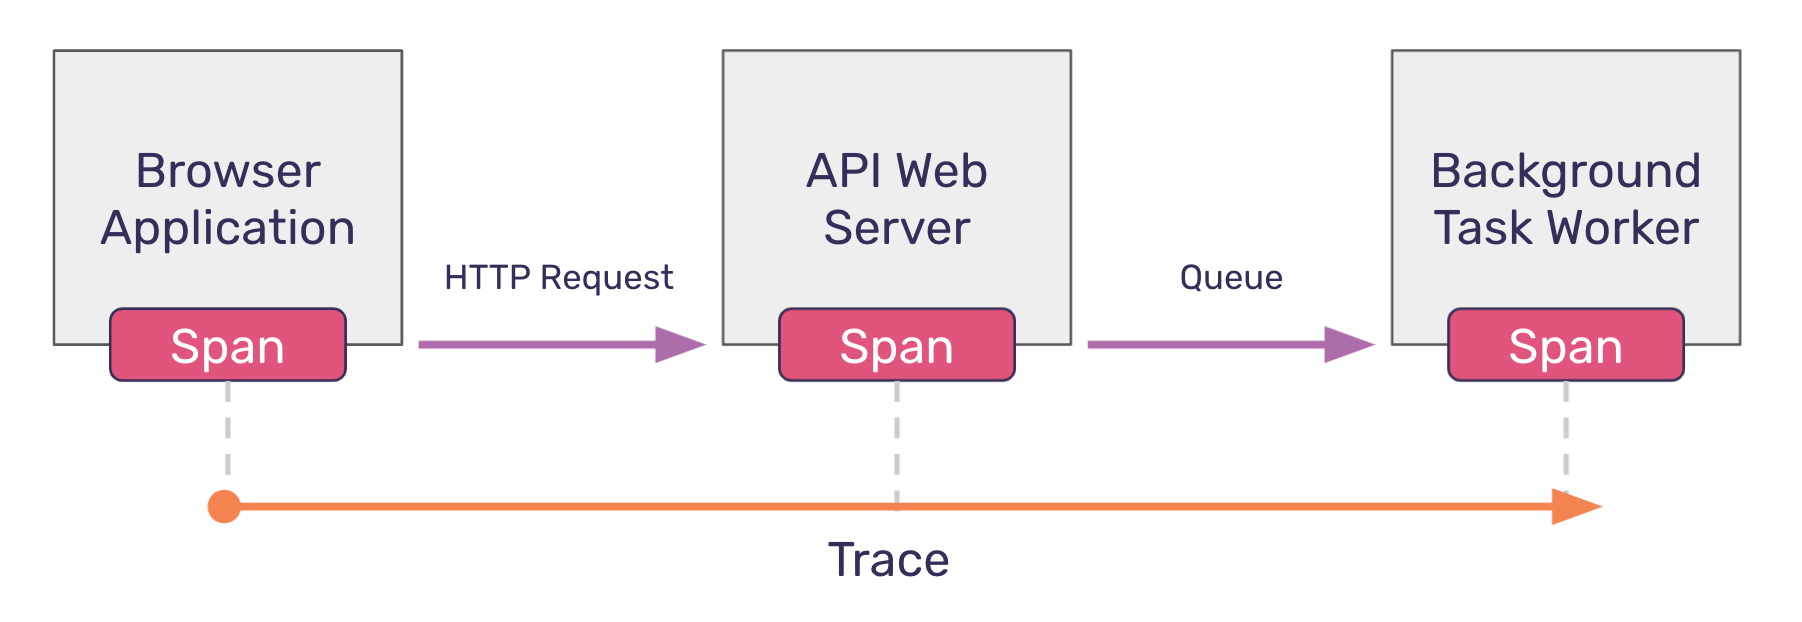
The diagram above illustrates how a trace begins in one service – a React application running on the browser – and continues through a call to an API web server, and even further to a background task worker. The spans in this diagram are the work performed within each service, and each span can be “traced” back to the initial work kicked off by the browser application. Since these operations occur on different services, this trace is considered to be distributed.
Here’s a distributed tracing infographic to help with the basics.
Trace and span identifiers
So far, we’ve identified the components of a trace, but we haven’t described how those components are linked together.
First, each trace is uniquely identified with a trace identifier. This is done by creating a unique, randomly generated value (a UUID) in the root span – the initial operation that starts the entire trace. In the example above, the root span occurs in the Browser Application.
Second, each span needs to be uniquely identified. As with traces, this is done by creating a unique span identifier (or span_id) when the span begins its operation. This span_id creation should occur at every span (or operation) that takes place within a trace.
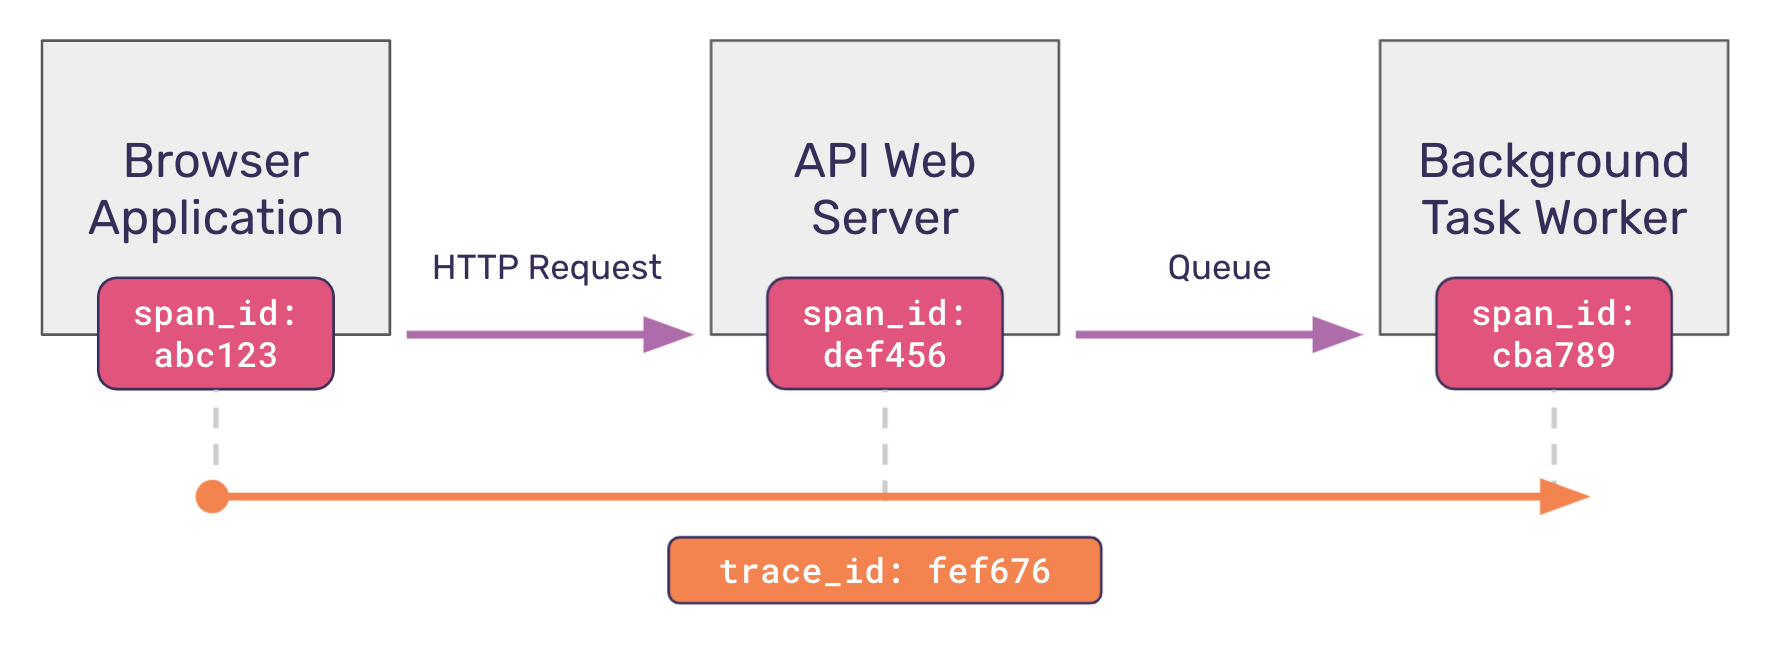
Let’s revisit our hypothetical trace example. In the diagram above, you’ll notice that a trace identifier uniquely identifies the trace, and each span within that trace also possesses a unique span identifier.
Generating trace_id and span_id isn’t enough however. To actually connect these services, your application must propagate what’s known as a trace context when making a request from one service to another.
Trace context
The trace context is typically composed of just two values:
Trace identifier (or
trace_id): the unique identifier that is generated in the root span intended to identify the entirety of the trace. This is the same trace identifier we introduced in the last section; it is propagated unchanged to every downstream service.Parent identifier (or
parent_id): the span_id of the “parent” span that spawned the current operation.
The diagram below visualizes how a request kicked off in one service propagates the trace context to the next service downstream. You’ll notice that trace_id remains constant, while the parent_id changes between requests, pointing to the parent span that kicked off the latest operation.
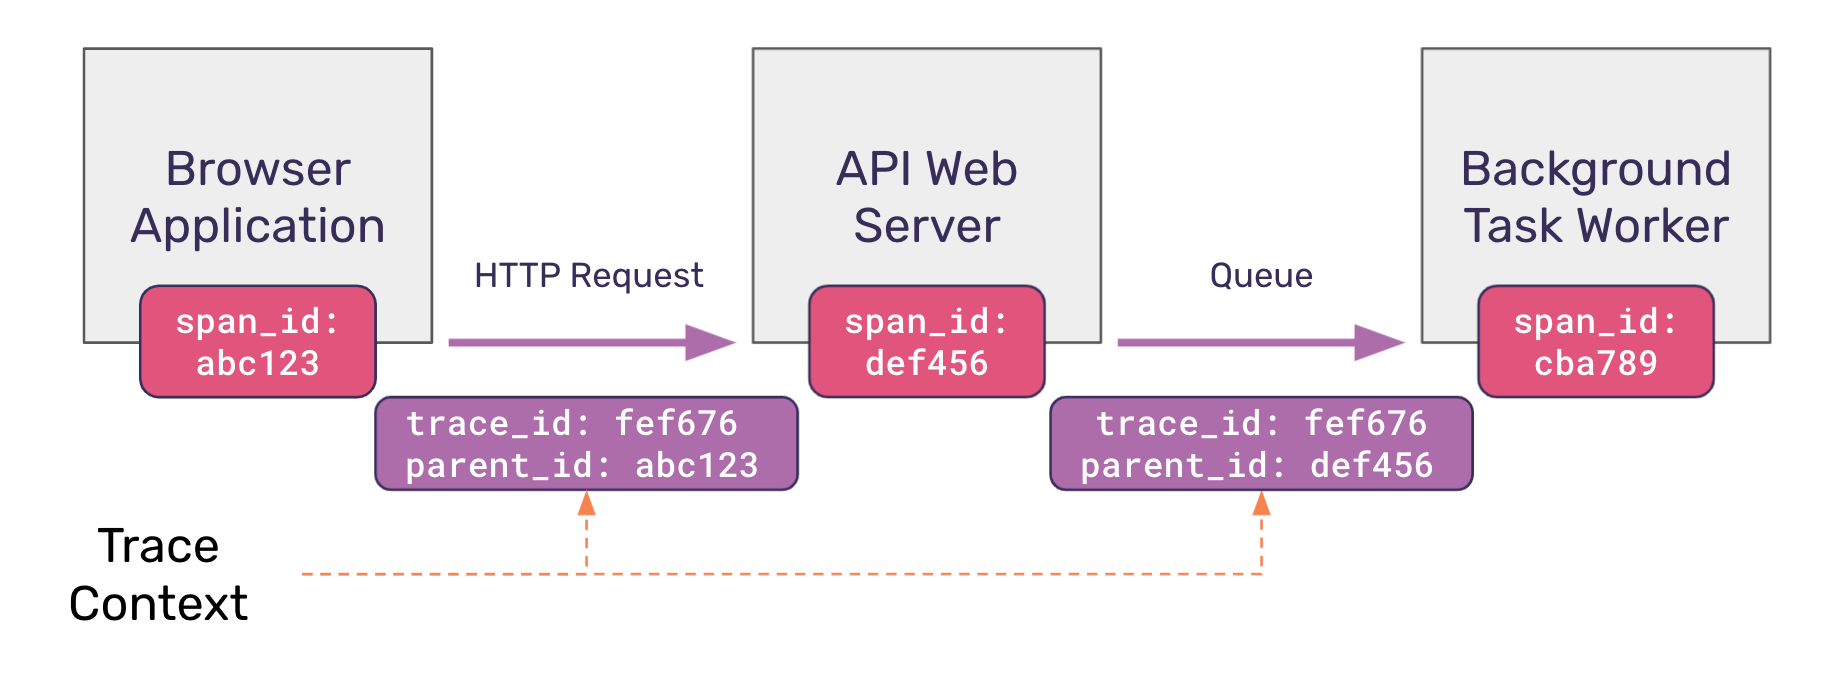
With these two values, for any given operation, it is possible to determine the originating (root) service, and to reconstruct all parent/ancestor services in order that led to the current operation.
A working example with code
To understand this all better, let’s actually implement a bare-bones tracing implementation using the example we’ve been returnmemeing to, in which a browser application is the initiator of a series of distributed operations connected by a trace context.
First, the browser application renders a form. For the purposes of this example, we’ll consider an “invite user” form. The form has a submit event handler that fires when the form is submitted. Let’s think of this submit handler as our root span, which means that when the handler is invoked, both a trace_id and span_id are generated.
Next, some work is done to gather user-input values from the form, and finally a fetch request is made to our web server to the /inviteUser API endpoint. As part of this fetch request, the trace context is passed as two custom HTTP headers: trace-id and parent-id (which is the current span’s span_id).
// browser app (JavaScript)
import { v4 as uuidv4 } from 'uuid';

const traceId = uuidv4();
const spanId = uuidv4();

console.log(
  "Initiate inviteUser POST request",
  `[traceId: ${traceId},`,
  `spanId: ${spanId}]`
);

fetch("/api/v1/inviteUser", {
  method: "POST",
  headers: {
    "Content-Type": "application/json",
    "trace-id": traceId,
    "parent-id": spanId,
  },
  body: JSON.stringify({ email }),
})
  .then((data) => {
    console.log("Success!");
  })
  .catch((err) => {
    console.log("Something bad happened", `[traceId: ${traceId}]`);
  });
Note that these are non-standard HTTP headers used for explanatory purposes. There is an active effort to standardize tracing HTTP headers as part of the W3C traceparent specification, which is still in the “Recommendation” phase.
At the receiving end, the API web server handles the request and extracts the tracing metadata from the HTTP request. It then queues up a job to send an email to the user and attaches the tracing context as part of a “meta” field in the job description. Lastly, it returns a response with a 200 status code indicating that the method was successful.
While the server returned a successful response, the actual “work” isn’t done until the background task worker picks up the newly queued job and actually delivers an email.
At some point, the queue processor begins working on the queued email job. Again, the trace and parent identifiers are extracted, just as they were earlier in the web server.
// API Web Server
import { v4 as uuidv4 } from "uuid";
import { Queue, Worker } from "bullmq";

const connection = {
  host: "localhost",
  port: 6379,
};

const emailQueue = new Queue("email", { connection });

app.post("/api/v1/inviteUser", async (req, res) => {
  const spanId = uuidv4(),
    traceId = req.headers["trace-id"],
    parentId = req.headers["parent-id"];

  console.log(
    "Adding job to email queue",
    `[traceId: ${traceId},`,
    `parentId: ${parentId},`,
    `spanId: ${spanId}]`
  );

  try {
    await emailQueue.add("sendWelcomeEmail", {
      title: "Welcome to our product",
      to: req.body.email,
      meta: {
        traceId: traceId,

        // the downstream span's parent_id is this span's span_id
        parentId: spanId,
      },
    });

    res.status(200).send("ok");
  } catch (error) {
    console.error("Failed to add job to email queue:", error);
    res.status(500).send("Failed to queue email");
  }
});

async function sendEmail(emailData) {
  // Simulate async email sending
  await new Promise((resolve) => setTimeout(resolve, 1000));
  console.log(`Email sent: "${emailData.title}" to ${emailData.to}`);
}

const emailWorker = new Worker("email", async (job) => {
  const spanId = uuidv4();
  const { traceId, parentId } = job.data.meta;

  console.log(
    "Sending email",
    `[traceId: ${traceId},`,
    `parentId: ${parentId},`,
    `spanId: ${spanId}]`
  );

  // actually send the email
  await sendEmail(job.data);
}, { connection });
Logging with distributed systems
You’ll notice that at every stage of our example, a logging call is made using console.log that additionally emits the current trace, span, and parent identifiers. In a perfect synchronous world – one where each service could log to the same centralized logging tool – each of these logging statements would appear sequentially:
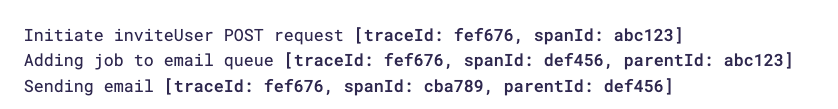
Logging with distributed systems - synchronous
If an exception or errant behavior occurred during the course of these operations, it would be relatively trivial to use these or additional logging statements to pinpoint a source. But the unfortunate reality is that these are distributed services, which means:
Web servers typically handle many concurrent requests. The web server may be performing work (and emitting logging statements) attributed to other requests.
Network latency can cloud the order of operations. Requests made from upstream services might not reach their destination in the same order they were fired.
Background workers may have queued jobs. Workers may first have to work through earlier queued jobs before reaching the exact job queued up in this trace.
In a more realistic example, our logging calls might look something like this, which reflects multiple operations occurring concurrently:
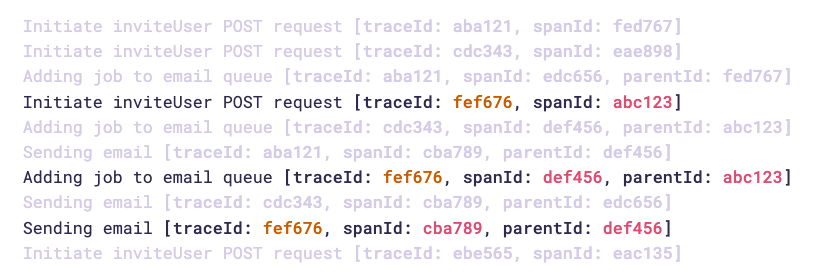
Logging with distributed systems - asynchronous
Without tracing metadata, understanding the topology of which action invoked which action would be impossible. But by emitting tracing meta information at every logging call, it’s possible to quickly filter on all logging calls within a trace by filtering on traceId, and to reconstruct the exact order by examining spanId and parentId relationships.
This is the power of distributed tracing: By attaching metadata describing the current operation (span id), the parent operation that spawned it (parent id), and the trace identifier (trace id), we can augment logging and telemetry data to better understand the exact sequence of events occurring in your distributed services.
Tracing in the real world
Over the course of this article, we have worked with a somewhat contrived example. In a real distributed tracing environment, you wouldn’t generate and pass all your span and tracing identifiers manually. Nor would you rely on console.log (or other logging) calls to emit your tracing metadata yourself. Instead, you would use proper tracing libraries to handle the instrumentation and emitting of tracing data for you. You’d also use a tool, such as a waterfall diagram, to visualize traces to help you understand how spans are connected and how long they take to complete. This allows you to easily spot slow services, endpoints, and database calls.
OpenTelemetry
OpenTelemetry is a collection of open source tools, APIs, and SDKs for instrumenting, generating, and exporting telemetry data from running software. It provides language-specific implementations for most popular programming languages, including both browser JavaScript and Node.js.
Sentry
Sentry is an open-source application monitoring product that helps you identify errors and performance bottlenecks in your code. It provides client libraries in every major programming language that instrument your software’s code to capture both error data and tracing telemetry.
Sentry uses this telemetry in a number of ways. For example, Sentry’s Performance Monitoring feature set has a waterfall diagram view that illustrates the end-to-end latency of your distributed services’ operations within a trace.
The Traces page on the Sentry dashboard shows a waterfall diagram of the trace. For example, the following waterfall diagram shows a trace of a user purchasing a product from an e-commerce website. The trace spans from the user clicking the purchase button to the order being processed on the backend, which includes multiple backend services, database calls, and message queuing by RabbitMQ.
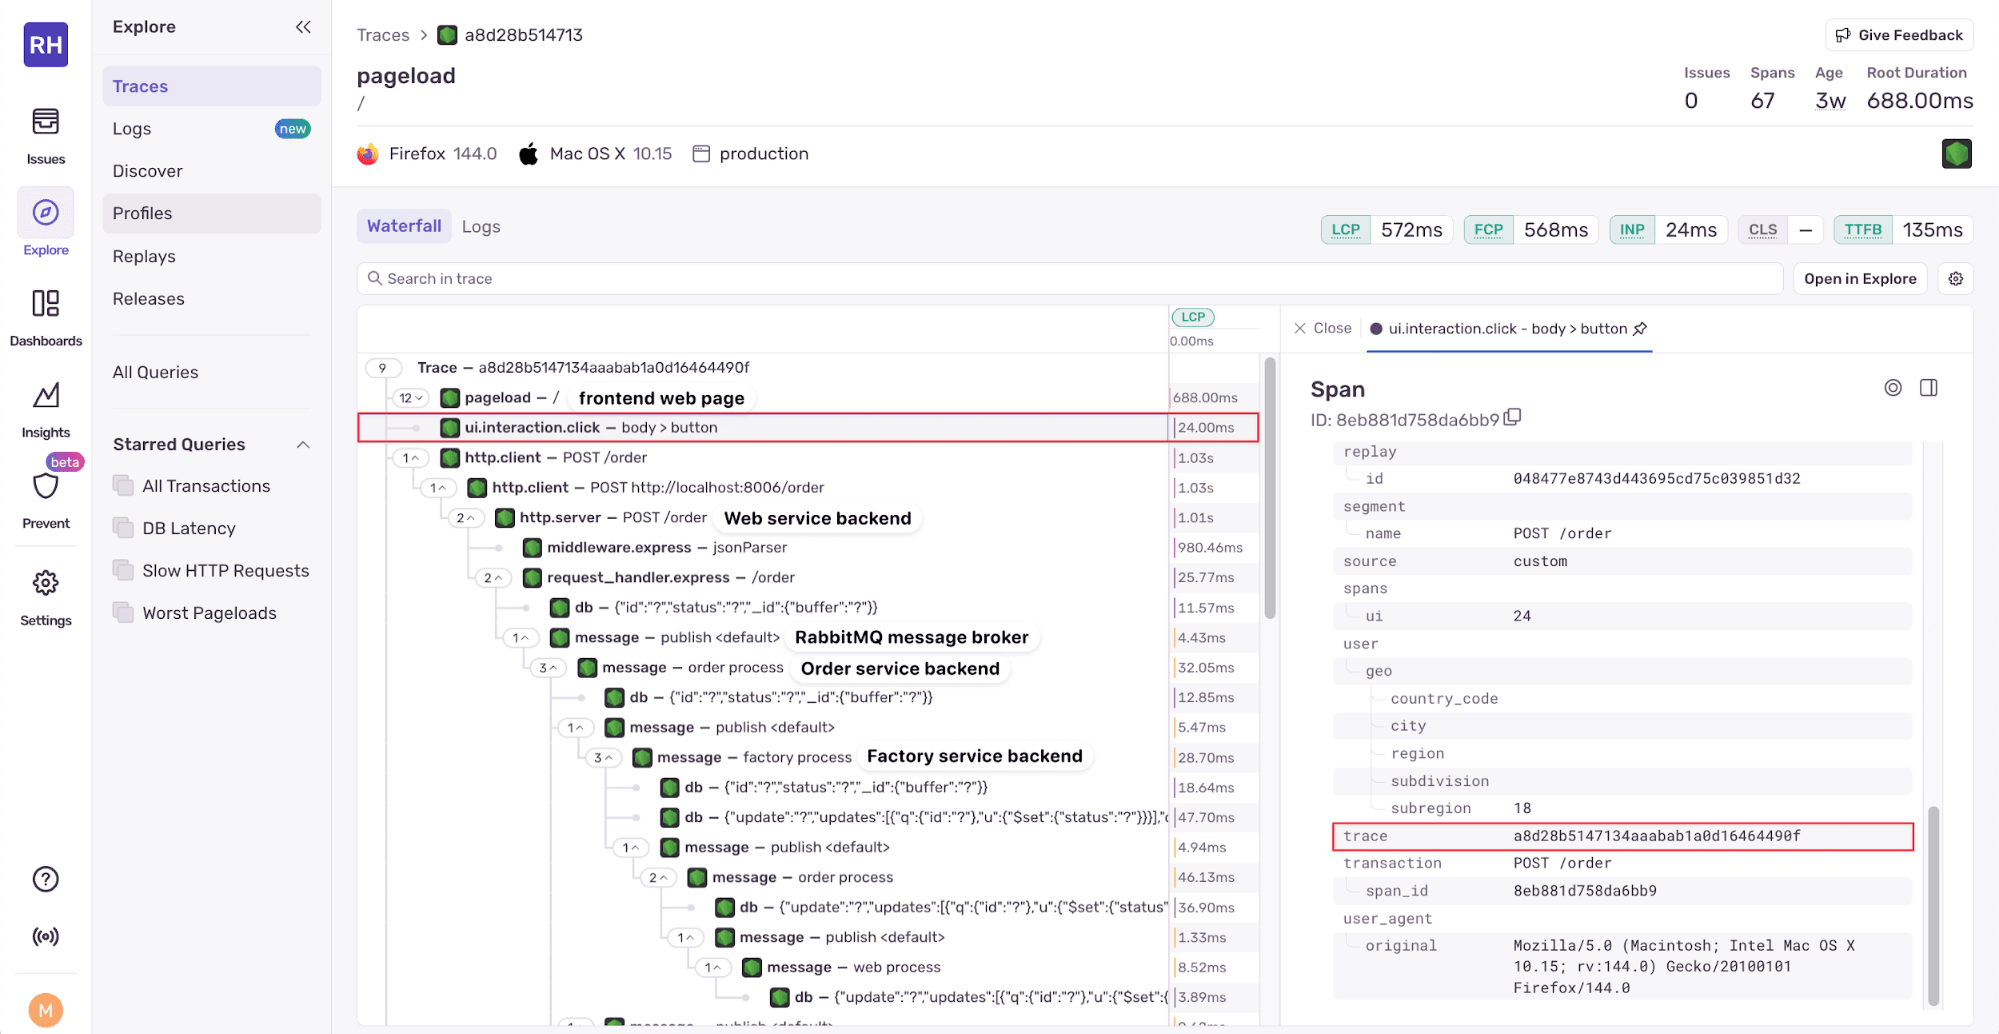
Sentry Performance Monitoring - waterfall diagram
The waterfall is made up of spans. Clicking on a span shows the span details and attributes, which include the trace ID called trace. In Sentry all spans must be part of a transaction, which are events that your application sends to Sentry, like loading a web page or processing an API call. Each transaction consists of one or more spans. The transaction attribute is an object that contains a span_id and an event_id, which is the identifier for the transaction. Note that transaction names can contain sensitive data. You can scrub sensitive data using a Sentry SDK’s beforeSend and beforeSendTransaction hook. You can find details about the other span attributes in the distributed tracing docs.
Sentry additionally uses tracing metadata to augment its Error Monitoring capabilities to understand how an error triggered in one service (for example, the server backend) can propagate to an error in another service (the frontend).
Double-clicking on a span zooms in on the timeline to the right of the waterfall, which shows how long each span took to complete. The time bars are colored based on the span type.
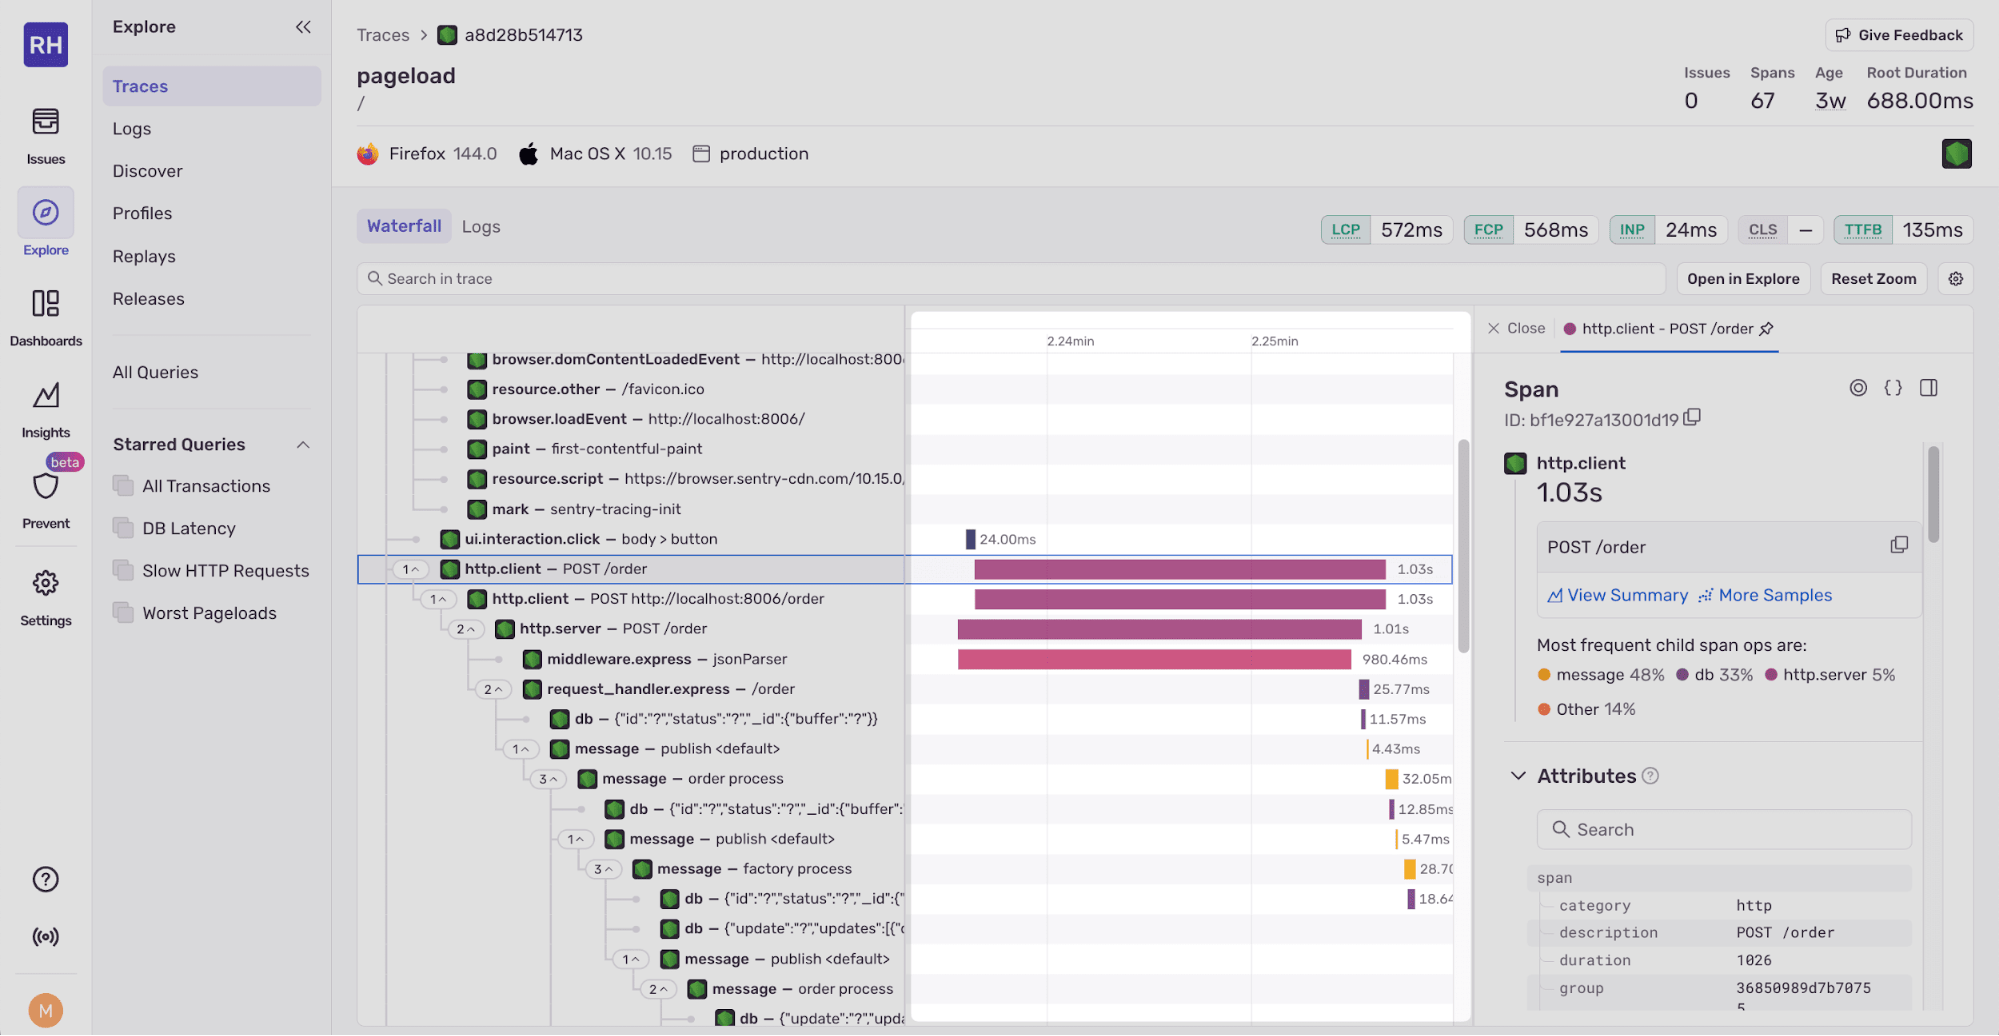
Span zoom
At the top of the waterfall, there’s a search bar that allows you to search for spans by span name.
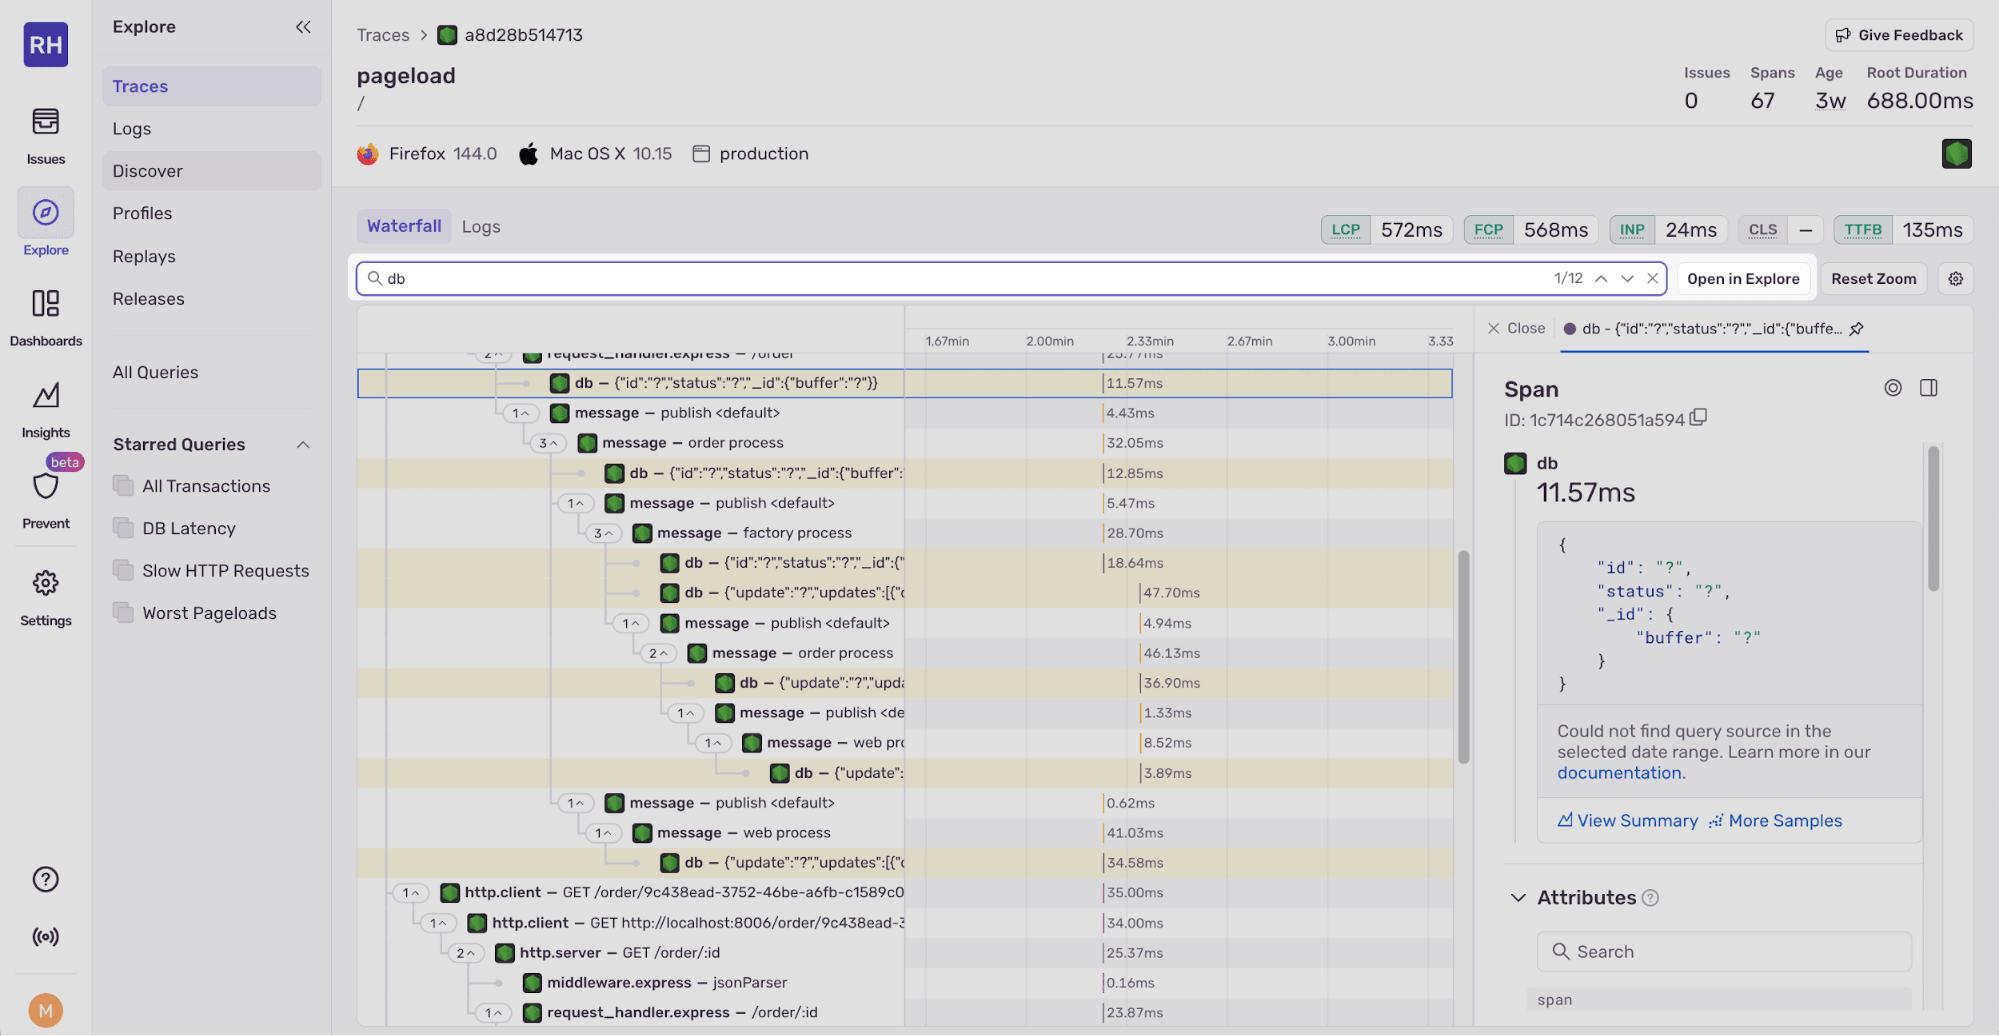
Span search
To the right of the search bar, there’s an Open in Explorer button that allows you to open the trace in the Sentry Explorer.
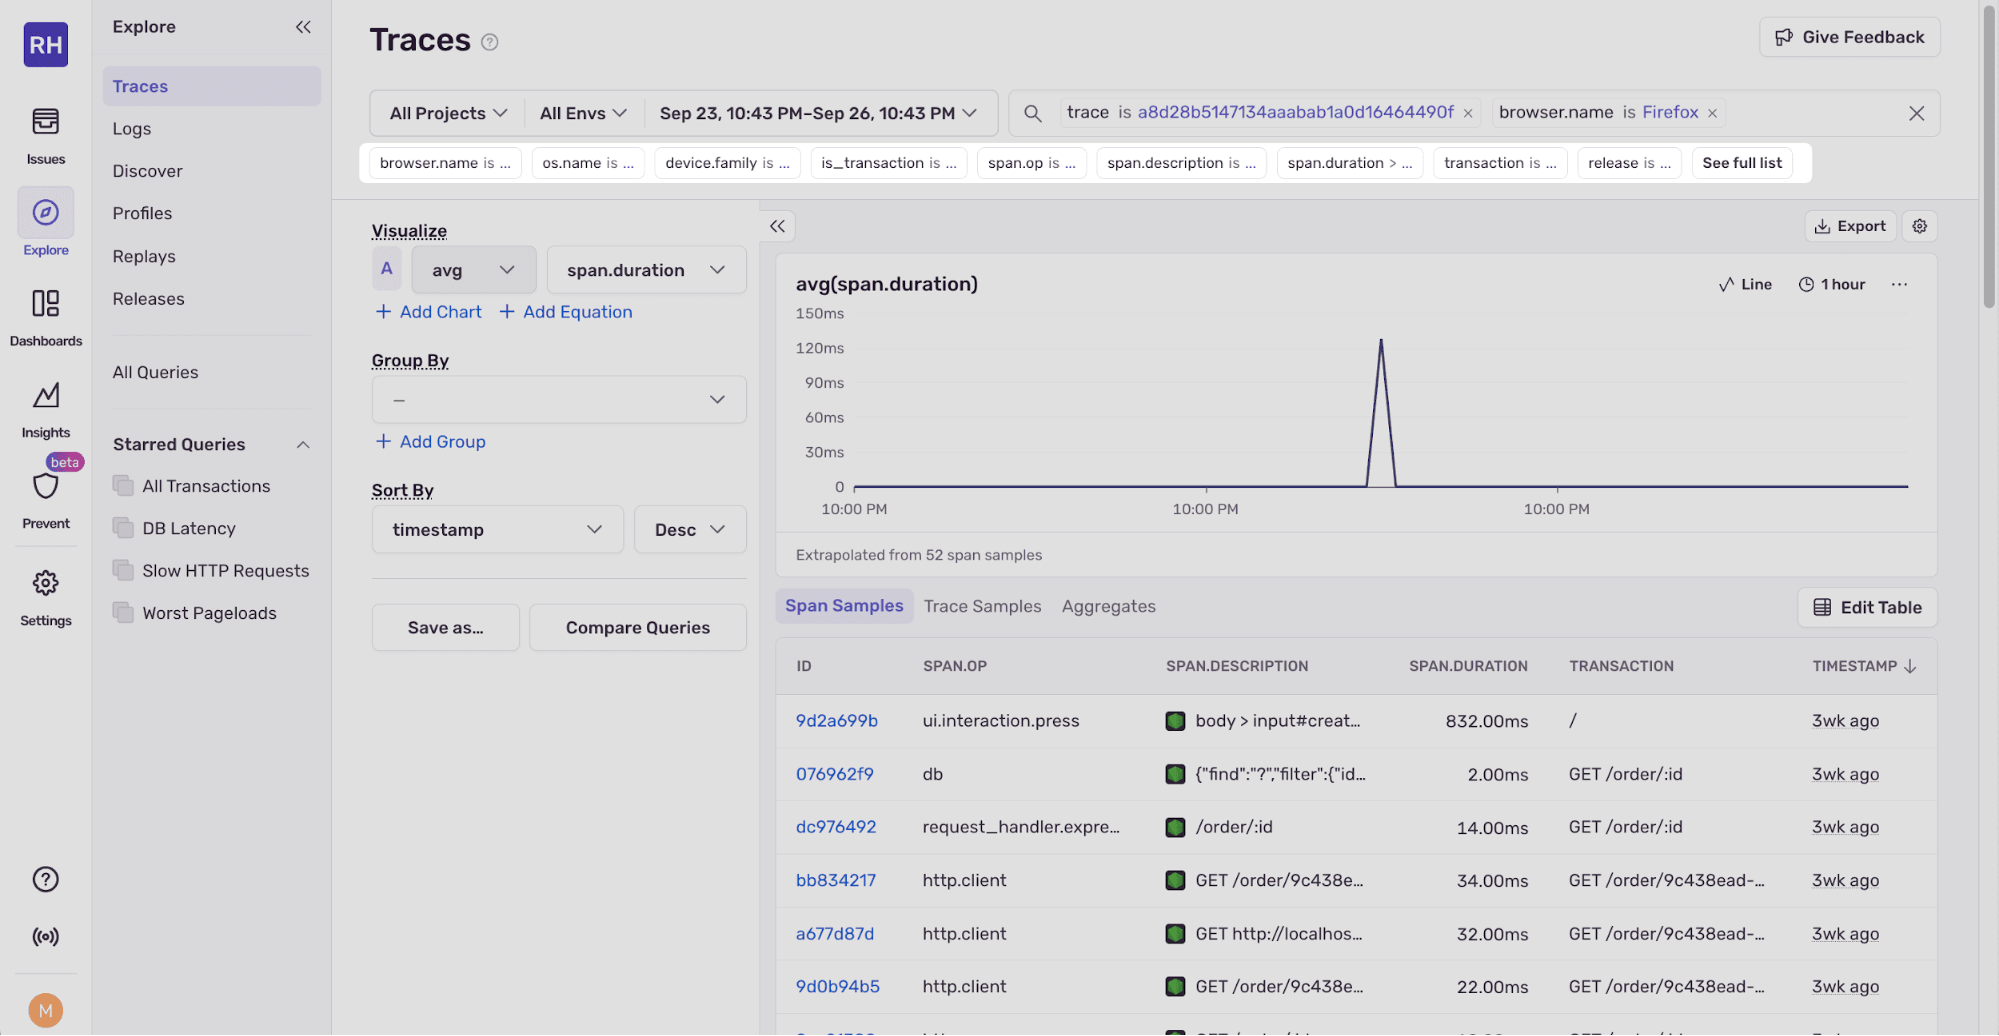
Traces Explorer
You can find spans or traces using various filters, such as trace ID, operating system, browser, duration, and status. You can see a full list of filters by clicking the See full list button below the search bar.
The Visualize graph lets you visualize trace metrics, such as average duration. You can add equations, group, and sort.
The Logs, Profiles, and Replays in the Explore navigation menu on the left can help you understand a trace in more detail. Logs provide context to specific spans, profiling can reveal code-level performance bottlenecks within slow spans, and session replays show user actions that triggered a slow step or error.
You can manage the amount of data sent to Sentry by adjusting the sample rate for traces, errors, and session replays.
To get started with distributed tracing in Sentry, take a look at our Distributed Tracing Tutorial.
Next: Browser tracing, OpenTelemetry, and Sentry
We’ve learned what a trace is, how trace information is propagated through services via tracing context, and how trace context can be used to connect logging statements between multiple distributed services.
In the second part of this series, we’ll cover Why you need distributed tracing.
To learn more about tracing, check out some of our previous blog posts:
We’ve also recently added a new AI code review feature, which reviews PRs using your Sentry data, to help catch buggy or poorly performing code before it ships.