Support for Database Performance Monitoring in Node
Support for Database Performance Monitoring in Node
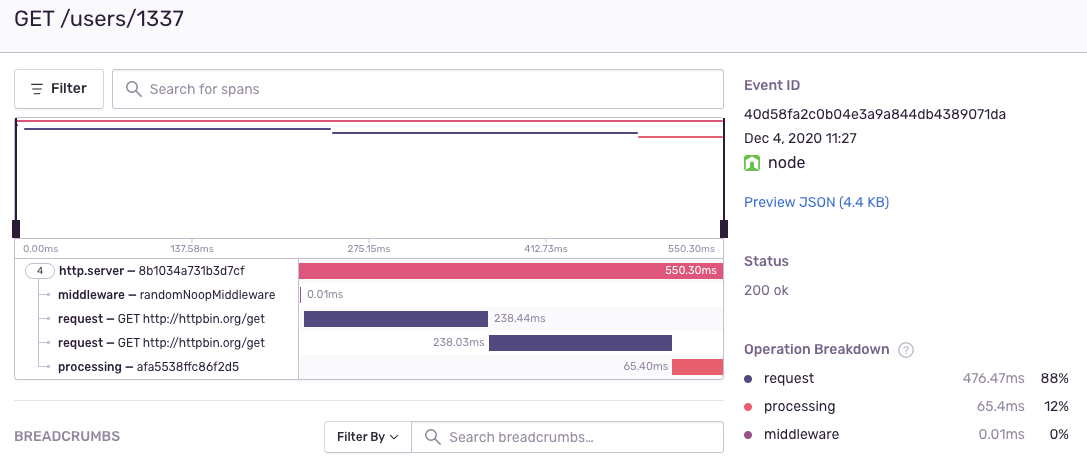
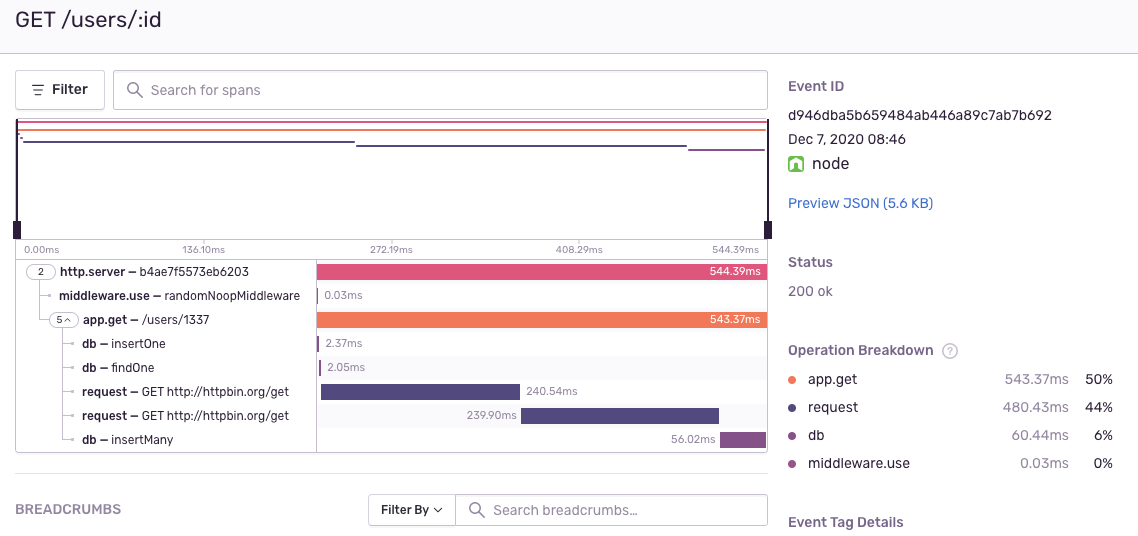
Application performance monitoring is great because it lets you see whether your application is fast or slow, and which parts need speeding up. For Node developers, those "parts" are most often endpoints handling incoming requests. Since the introduction of our performance monitoring offering in July 2020, Node devs have been able to use the Sentry SDK, @sentry/node, to measure the total time it takes to process each request, but we made some significant improvements since then. Compare those two screenshots:
Before:
After:
Here's what's different:
Our Express integration now properly groups transactions using parameterized route names
We now auto-instrument database queries for popular database client libraries
If you use Mongo, PostgreSQL, or MySQL, you can now
Sentry.init({
...
integrations: [
new Tracing.Integrations.Mongo(),
// or new Tracing.Integrations.Postgres(),
// or new Tracing.Integrations.Mysql(),
],
...
});and immediately your transactions will start being populated with all the information you'll need to identify your slow queries and whip them into shape.
We brought these improvements to SQLAlchemy and the Django ORM, Laravel (PHP), and will be rolling imrpovements for Active Record in Rails soon.
Now go out there and get those queries optimized! Try Sentry for free.


