React.js Performance Guide
React.js Performance Guide

Which JS framework is the most performant? React, Vue, Svelte, Angular,…? When trying to answer this question, we often get lost in comparing benchmarks for reactivity, bundle size, memory usage and other factors.
Of course we want to choose the best framework to create performant apps! But your app will only benefit from framework performance if you also follow best practices for performance optimization of web apps in general, and React apps in particular.
So, where to start? What impacts performance? This guide will cover the basics of React performance optimization, and list some tools and resources that will help you dive deeper into this topic.
Why you should invest in performance
Better Performance = Better user experience
Nobody has time for slow apps. People want to get things done fast – your app is their tool. Performance helps you build trust in your app and brand, and create a good experience.
Better Performance = Better conversion and retention rates
A good user experience boosts your conversion and retention rates (= how many people sign up and keep using your app). That way, performance is directly contributing to your app's success.
Better Performance = Better SEO
Search engines rank performant pages higher, and they also take user engagement into account. If your users stay longer because they can find what they need efficiently, it will impact your SEO performance positively.
Better Performance = Better scaleability and lower cost
A codebase that follows performance best practices is easier to maintain and scale when things are getting more complex, and will cause fewer infrastructure costs.
8 common React performance problems & how to fix them
When we’re talking about performance, we usually mean metrics measuring our app’s load time and responsiveness.
Load time describes how long it takes to load all the code and assets the app needs. We measure it with metrics like FCP (First Contentful Paint), LCP (Largest Contentful Paint) or TTI (Time to Interactive).
Responsiveness or runtime performance describes everything that has to do with smooth (re-)rendering. The performance of your React code is a big factor in this. An important metric that we use to measure responsiveness is INP (Interaction to Next Paint). Additionally, we can measure transaction durations with profiling and monitoring tools, or look at frame rates, CPU or memory usage.
We need to take both of these performance indicators into account if we want to develop apps that load and feel fast. So let's explore some common problems and their React-specific (and non React-specific) solutions!
1. Large bundle size
The larger your app is, the longer it takes to load. While that sounds obvious, it’s one of the areas where we usually get big performance wins, quickly. Our goal is always to send as little code (and other assets) to the browser as possible.
Use and optimize a bundler: Bundlers like Webpack or Vite support many performance-critical features like code splitting, minification, tree-shaking, module bundling, dependency optimization, asset optimization out of the box. If you use Webpack, don’t forget to set the mode to
productionto make use of its optimizations, or check the official Vite performance recommendations.Optimize your dependencies: Review and remove imported libraries that cause unnecessary bloat using tools like bundle analyzers/visualizers, and routinely check the cost of third party code before adding it in the first place.
Enable Gzip or Brotli compression in your web server config (which is usually enabled by default if you use a CDN).
To go deeper on this topic, learn the 8 most common ways to optimize your javascript bundle size in this blog.
2. Unoptimized assets
Unoptimized assets impact our bundle size. Optimizing images, media and fonts and delivering them efficiently will usually make your app load significantly faster.
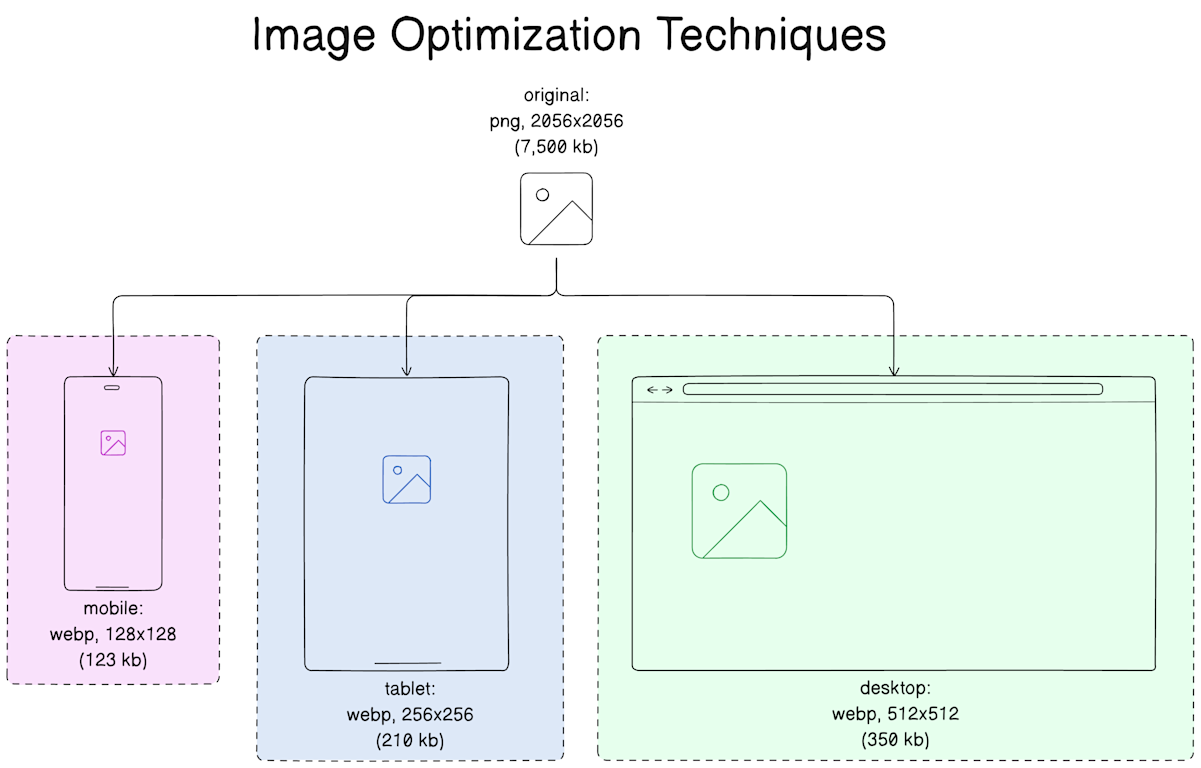
Optimize images: Use modern image formats like WebP or avif, which uses a more efficient compression algorithm compared to JPG or PNG. Resize and compress your images automatically during your build process, and use responsive image techniques (like <img srcset> or <picture>) to load images in the correct resolution
Optimize fonts: All web fonts impact your performance load time andrendering. Only load fonts you really need (using the WOFF2 format if possible), and you can further optimize your font files by discarding characters you don’t need (using e.g. Munter/subfont if you self-host your fonts).
Question the necessity of design choices like large media slideshows or 6 different font styles, pointing out performance implications to the designers on your team.
3. Unnecessary and slow re-renders
Re-renders are often costly and slow. We want to keep an eye on the frequency, performance and timing of re-renders in our apps.
Check for slow renders and bottlenecks by analyzing your runtime performance with tools like the performance panel of the Chrome DevTools. (See the tools list below!)
Check for unnecessary update cascades caused by nested component structures.
Use React memoization techniques to avoid small component changes triggering unnecessary re-renders. React Compiler will take over a lot of this work automatically, minimizing unnecessary re-renders for simple components – but you might still need to use manual memoization for more complex scenarios.
memolets you memoize components, preventing re-renders of child components when their props have not changeduseMemolets you cache calculation valuesuseCallbacklets you cache function definitions
Use virtualization for large lists to speed up your initial and re-renders.
Define functions outside of the render scope. Or use the
useCallbackhook we mentioned above.
4. Inefficient state & component structure
As your app grows, you might find that you have built monolithic components that handle too many responsibilities, with props getting passed through multiple layers of nested component trees. This also causes costly re-renders throughout your UI, making your app feel slow and harder to maintain.
Split your components wisely: (Re-)structure your components into small, focused units with well-defined responsibilities. This gives you way better control about which parts of the UI will re-render after a component update.
Make use of
Fragmentto avoid unnecessary element wrappers. It allows you to group a list of children without adding extra nodes to the DOM.Use the Context API to avoid prop drilling. It lets you share data across nested components.
Avoid storing too much data in your global state, and instead keep the state as localized as possible (close to where you need it) for more efficiency. That prevents parts of your UI to re-render due to changes that don’t even affect them.
Use state managers: For more complex apps, state management libraries like Redux, or more lightweight alternatives like Zustand or Jōtai can give you more control about state if you start to struggle with managing updates. That way, you can subscribe your components only to the data they need.
5. Too many requests & network latency
Efficient data fetching and asset delivery can speed up load times and prevent an unresponsive UI whenever new data is coming in.
Avoid unnecessary API requests: Don’t re-fetch data if it hasn’t changed, and reuse previously fetched data for repeated requests. Use libraries like SWR or TanStack Query to manage and cache API requests efficiently.
Avoid blocking or synchronous requests delaying rendering: Batch multiple requests into a single one, or parallelize them using Promise. Load blocking scripts asynchronously using the async or defer attributes.
Throttle and debounce events: Throttling and debouncing are used to control the rate at which functions are executed to prevent updates from happening too frequently. We want to throttle the frequency of updates reacting to scrolling, window resizing or mouse movements, and we can debounce the execution of a search until the user has stopped typing (to e.g. 300ms after their last keystroke). You can use the useDebounce / useThrottle hooks from the useHooks library for this.
Avoid extensive user tracking: Yes, user data is great to collect so you can make decisions about how to make your app better, but tracking scripts and excessive analytics will slow down your app significantly. Client-heavy tracking solutions are usually bloated and make repeated requests. Batch events sent to analytics servers to minimize requests.
Use server-side rendering (SSR) or static site generation (SSG): Fetching data on the server during build / request time makes sure that the content is rendered with all necessary data already.
Use a CDN to deliver content more efficiently, by serving your users from a geographically close server.
6. Unnecessary resource usage
Sometimes we waste resources with too many, or inefficient operations, causing slow rendering, high memory usage and a slow or unresponsive UI.
Use Web Workers for CPU-intensive tasks: Consider using Web Workers to move tasks like sorting or filtering of request results, or processing images off the main thread, so the UI can run without being blocked.
Avoid memory leaks: Uncleaned resources like obsolete event listeners or timers can lead to memory leaks, increasing resource usage over time. Ensure that
useEffecthooks return a cleanup function to remove them when your components unmount or update.Use CSS instead of JS animations: Animating elements using JS can be resource-intensive and often block the main thread. CSS animations on the other hand run on the GPU instead, and won’t disturb rendering or user interactions. They are a better choice for smooth transitions, scaling, rotation and element movements.
7. Inefficient loading strategies
Some resources are more important than others. Everything that is needed to quickly finish the initial rendering should ideally be loaded first – but often we unwittingly block the main thread with non-essential scripts, slowing everything down. Being smart about loading assets and resources will make our apps feel a lot more performant.
Avoid loading all JS and CSS upfront: To avoid a slow initial rendering, use code splitting (Webpack or Vite can split your code by route or component), and consider inlining critical CSS in the
<head>section of your HTML.Load components on demand: Use React.Lazy to lazy-load components like modals or dropdowns, and use Suspense to show placeholders / a fallback UI while waiting.
Don’t load what you don’t need (yet): Use virtualization to only render the visible portion of large data lists, and use the
IntersectionObserverAPI to defer loading sections or heavy content like video embeds or charts until they come into the viewport.Prioritize critical resources, deprioritize non-essential ones: Use the
preloaddirective to prioritize assets (like fonts), and useprefetchto load resources that will likely be needed for future interactions during idle time. Cache assets, so your users don’t have to download them multiple times.
<img src="https://cdn.mywebsite.io/amazing_image.png"
     loading="lazy"
     alt="The most amazing image you've ever seen." />
Learn more about lazy loading in this blog “From LCP to CLS: Improve your Core Web Vitals with Image Loading Best Practices”.
8. Slow perceived performance
What loads fast, and what feels fast to the user is not the same. Users perceive apps to be slow due to delays in rendering, lack of immediate responsiveness to interaction or layout shifts.
Use concurrent rendering (cautiously): Concurrent Mode lets you interrupt non-urgent rendering tasks (using the useTransition hook) and prioritize more important updates to make your UI feel more responsive. Use it for example when updates like filtering or searching through a dataset while the user is typing slows things down, and you want to prioritize the user interaction to keep it smooth. (Too) enthusiastic usage of concurrent rendering can cause unwanted re-renders, so always check its impact with the developer tools / profiler.
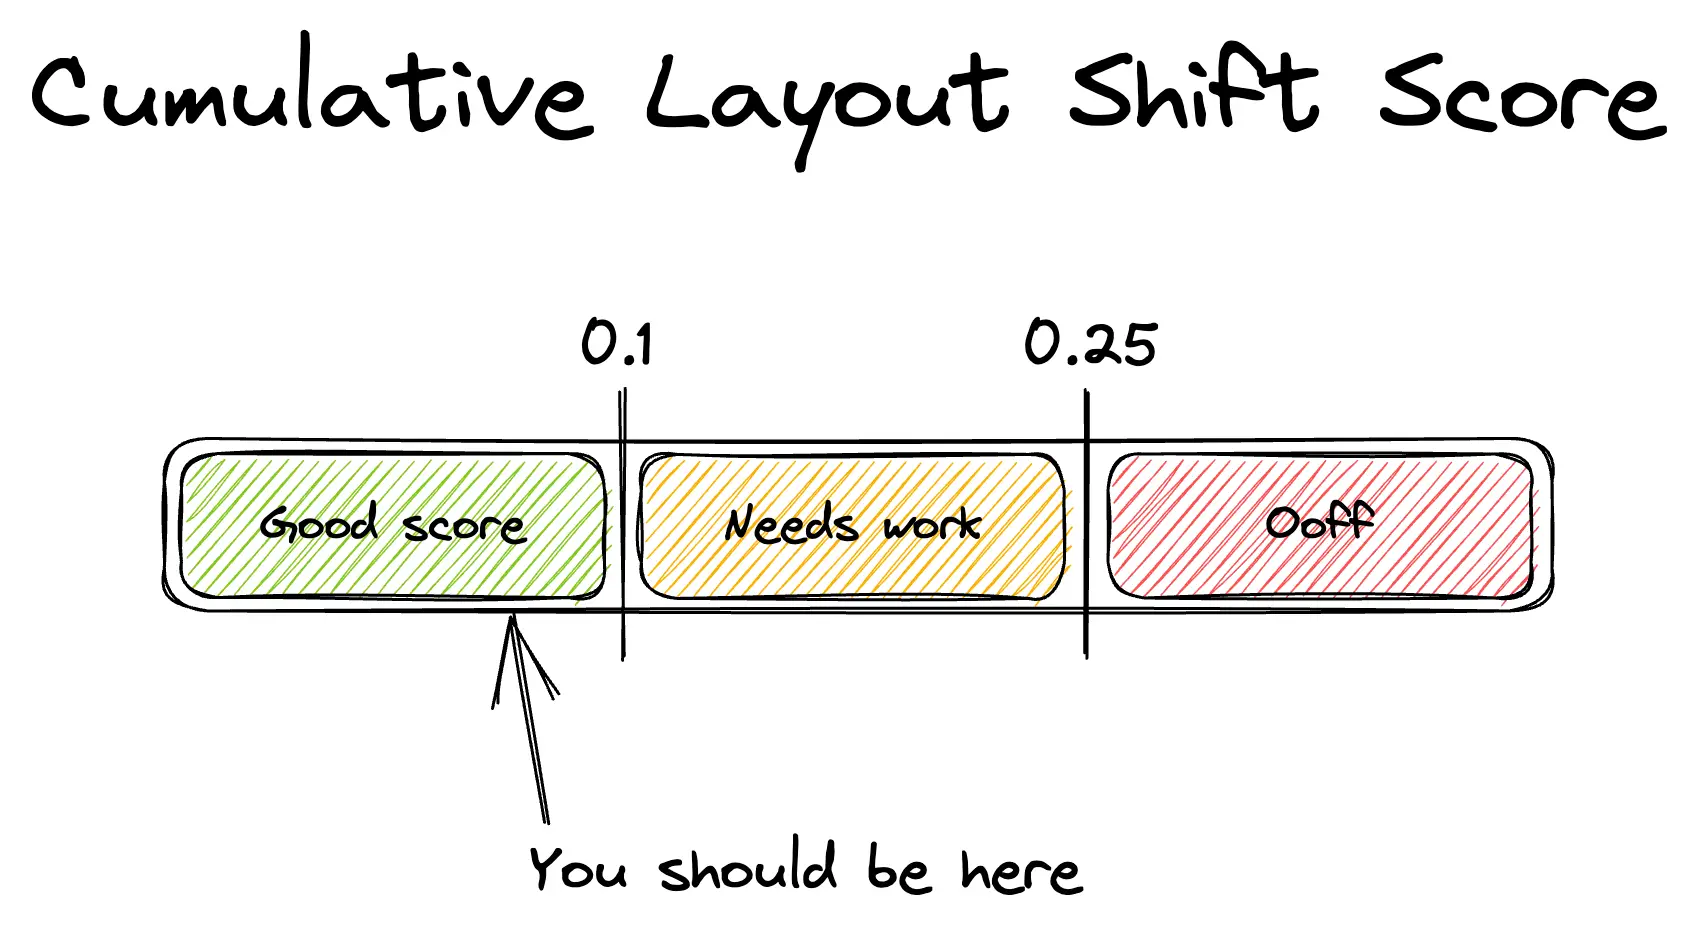
Minimize layout shifts: Layout shifts occur when elements like images or ads load after the initial content and the layout jumps around – captured with the cumulative layout shift (CLS) metric that is part of the core web vitals. In the worst case, you’re yanking text away that your user has already been reading. (Have you visited a recipe blog recently? Then you know how annoying this is!) Instead, reserve space for images, videos and dynamic content using fixed element dimensions.
Provide content previews: If you need time to load e.g. data of a feed, use skeleton loaders or placeholders to give users an impression of the content that is being loaded. You know this from social media sites – it’s tested to lower frustration with loading times.
Give feedback about loading processes: Users might think your app is unresponsive if you just freeze up the page whenever an action takes time (e.g. form submissions or API calls). Show a loading spinner or other status message.
Don’t over-animate: Don’t overuse transitions, especially for repeated interactions – it may be nice the first time, but annoying afterwards. Also, don’t set animation durations for interactions longer than 300ms.
Tools to measure & improve React performance
Measure React app performance
“We can’t optimize what we don’t measure.“ There are many tools that help you to audit the current state of your React app performance:
Chrome Performance panel: Access the performance tab of your Chrome DevTools and record interactions to get a detailed timeline of scripting, rendering and paint events. It helps you detect the cause of slow page loads caused by rendering delays or layout shifts.
Lighthouse / Lighthouse CI: (Automatically) audit performance, accessibility, SEO and other best practices with Lighthouse performance scoring. It shows you how your app scores for metrics like FCP (first contentful paint) and TTI (time to interactive). You can start an audit in the Chrome DevTools, or use the Lighthouse CI tool to integrate it in your build pipeline.
React DevTools Profiler: Use the Profiler tab in your React DevTools to capture profiling data about the rendering behavior of your components. It visualizes the time spent rendering each component. This lets you debug slow ones, and optimize your hierarchy.
WebPageTest: To see how your site performs on slower networks and at different geographic locations, run a test with WebPageTest.
Google PageSpeed Insights & Analytics: Get results for the metrics included in the core web vitals with PageSpeed Insights. It also shows how your site performs on different devices. Alternatively, you can get real-world data from your users in your Google Analytics dashboard. With Google Analytics, you can also track the performance of custom events.
Load test: With load testing tools like k6, locust.io (both OSS) or Artillery, you can identify performance bottlenecks that occur under heavy traffic.
Debug React performance
To investigate issues during development, you can make use of these tools:
Profiler: Measure the rendering performance of specific components by wrapping them in a <Profiler>.
Why did you render?: This tool notifies you about potential unnecessary rerenders in your app made with React or React Native, and lets you track rerenders of specific components.
React Scan automatically identifies performance issues and highlights components that you should optimize. It’s easy to integrate, as there are no code changes needed
Million: Million Lint is an IDE extension that automatically detects (React) code that impacts your performance and suggests ways to improve it.
Bundle Analyzers: Identify large third-party libraries that have an impact on your bundle size with the bundle analyzer tools of Webpack and Vite.
Monitor React performance
If you want to keep track of your React app’s performance over time and in real-world scenarios, it makes sense to implement a monitoring service.
Performance monitoring is included in most full-stack application monitoring products. Adding one of them to your apps makes sure you’ll get notified immediately if your users experience an issue – e.g. a temporarily slow API call causing a bottleneck.
There are many different services available that offer React integrations, providing detailed information about component performance. Shameless plug, consider using Sentry for React performance monitoring.
Sentry reports errors and performance issues as they happen, and collects contextual code-level information that helps you to fix them.
More resources about (React) performance
This guide is a starting point – hopefully you got a good introduction and many ideas for optimizing your React applications
Nonetheless, here are some more resources if you want to keep learning:
