Profiling Beta for Python and Node.js
Profiling Beta for Python and Node.js
A couple months ago, we launched Profiling in alpha for users on Python and Node.js SDKs — today, we’re moving Profiling for Python and Node.js to beta. Profiling is free to use while in beta — more updates to come when we near GA.
Profiling is a critical tool for helping catch performance bottlenecks in your code. Sentry’s profiler gets you down to the exact file/line number in your code that is causing a slow-running query. You can see immediately why a particular function is taking so long to execute and optimize them in your code to improve application performance.
We've made some improvements to our Profiling product in our latest release:
Python Updates
Support for
geventSentry Profiling now supports
geventin Python; this impacts all users who use thegeventlibrary (often paired with the Gunicorn WSGI HTTP server), who should now see the code running within thegeventcoroutines (request handling code) where previously we would not capture that data.
Support for profiling all transactions (not just WSGI requests)
Previously, Sentry could only profile WSGI requests. Now, all transactions (including ones started manually) are profiled, making this behavior consistent with other SDKs that support profiling.
Neither of these feature updates require any additional configuration— as long as you update your SDK, they will start working and you’ll see profiling insights immediately.
Node.js Updates
Support for Node.js 18 and 19
Sentry Profiling now supports the latest versions of Node.js (v18 and v19).
Support for Google Cloud Run
We fixed a bug where the Node.js profiler would segfault when deployed to a Google Cloud Run environment. You’ll now be able to successfully profile in production when deploying to Google Cloud Run.
The package now ships with precompiled binaries so building from source is less often necessary.
Product Feature Improvements
In addition to our enhanced SDK support, we have also improved the user experience with a few new Profiling feature updates. With Sentry Profiling, users can now:
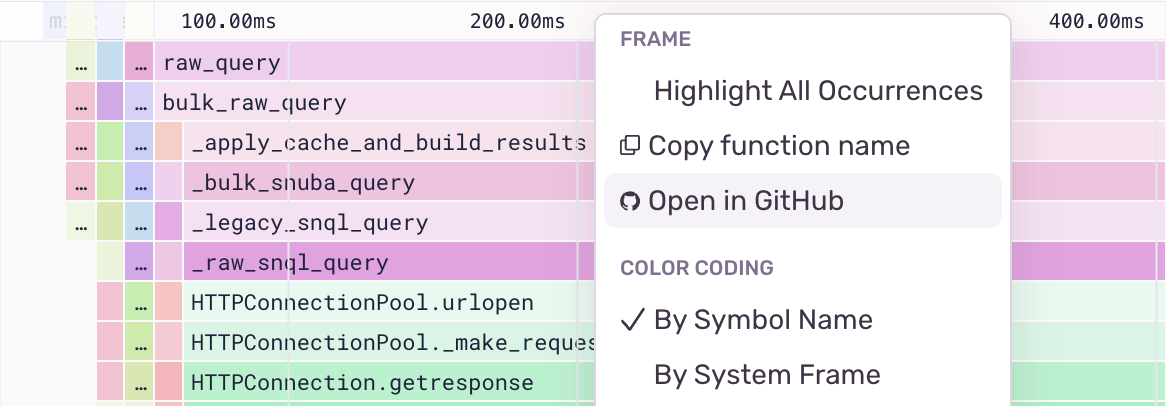
Link from functions in the flame graph to code in GitHub
Right click on a function frame in the flame graph to navigate to the code for that function in GitHub, when source mappings are configured. This takes you directly to the source code for a long-running function, which means you can quickly write a fix for your performance problem and reduce troubleshooting time.
This works for Node.js and Python projects that have source code management configured.
Visualize spans from the transaction on the flame graph
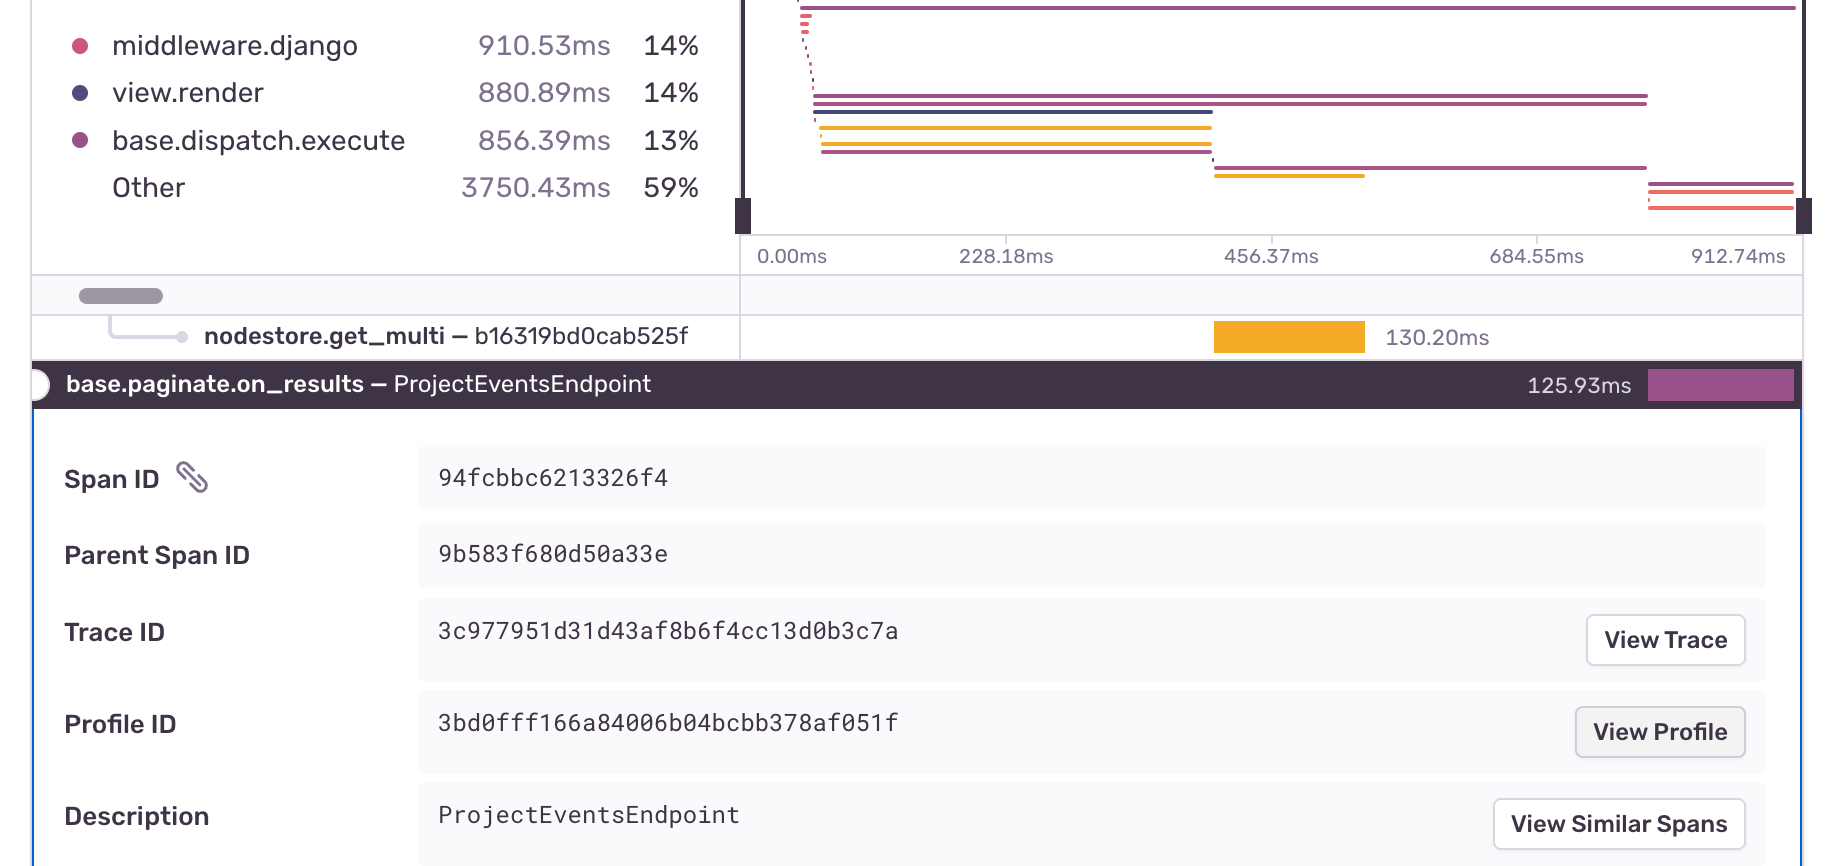
All profiles that have an associated transaction will render the spans from the transaction directly on the flame graph. This allows you to easily understand exactly what code is executing during a particular span in a single, unified view rather than having to go back and forth between the transaction and the profile.
Navigate from a span to the corresponding profile
If you have Sentry tracing enabled, you can go to the transaction event details page, select a span from the waterfall view, and click the “View Profile” button to navigate to the part of the profile where that span occurs. This allows you to go from a high-level view of your performance problem and drill into the problematic functions associated with the span of interest.
Conclusion
As we continue to iterate on Sentry’s profiling capabilities, we’ve heard from many early customers that Sentry Performance and Profiling often go hand-in-hand in their performance workflow.
Sentry Performance allows customers to trace across services and identify slow-running database queries and external calls. For example, one of our Profiling customers states:
"Seeing the slowest API calls in Sentry Performance has been very useful -- we've done some performance optimizations and seen a dramatic improvement in p50s and p95s." — Shane Holcombe, Developer at Aunty Grace (Australian healthcare company)
Profiling complements tracing by giving file and line-level detail about what areas in your code need to be optimized in order to reduce your CPU consumption. With Performance and Profiling two together, you can correlate profiles with transactions, identify the root cause of your slow requests, and quickly fix them.
Get started with profiling today with just a few clicks. Make sure you have Performance instrumented first (it takes just 5 lines of code).
P.S. If you’ve never heard of a profiler, want to know how profiling compares to logging or tracing, or are just curious — check out our Profiling 101 blog series explaining the basics of what profiling is and why you might want to profile your application in production.
See here for some more Python profiling examples or Node profiling examples. We’d also love to hear from you in GitHub, Discord, or email us at profiling@sentry.io to share your thoughts and feedback.


