You can already send OTel traces to Sentry. Point your OTLP exporter at Sentry’s endpoint, set environment variables, and your spans show up in the trace explorer. Our OTLP setup guide and “You Don’t Need to Pick One” walk you through that.
But those spans are islands. You get a trace waterfall in Sentry, sure. What you don’t get is the thing that makes Sentry valuable:
Click an error => see the OTel trace that caused it
Click a span => see the Sentry errors that fired inside
That connection between your OTel performance data and your Sentry error data doesn’t exist unless something on the SDK side actively wires them together.
That’s what the OtlpIntegration for Python, Ruby, Node.js, Go, PHP, .NET, and Java does.
Trace connectedness: the problem the raw OTLP endpoint can’t solve
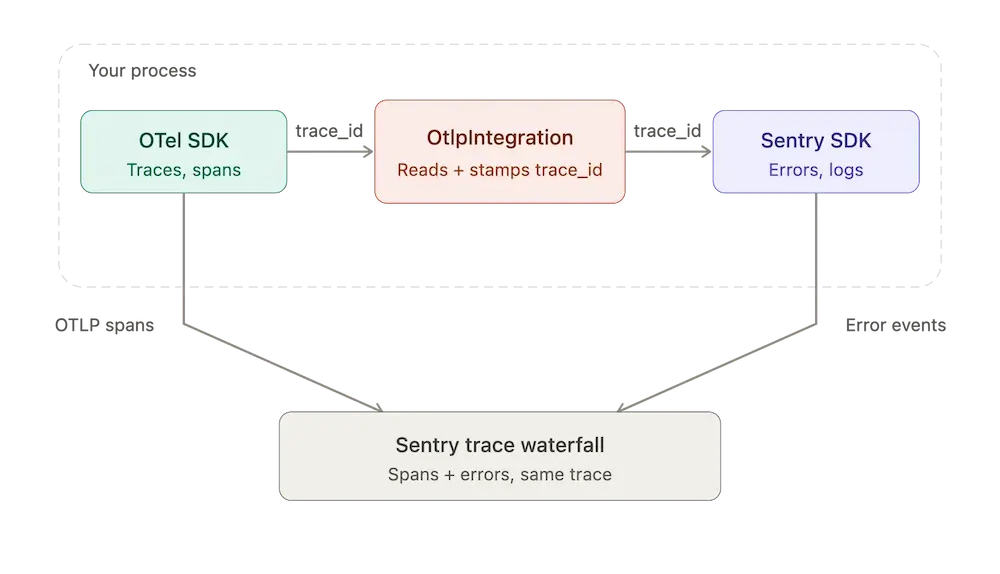
When you use a standalone OTel SDK with Sentry’s OTLP endpoint, two separate systems run in your process:
The OTel part manages traces and spans.
The Sentry SDK manages errors, logs, application metrics, session replay, and profiling.
They share a process but not a context. When the Sentry SDK captures an error, it doesn’t know which OTel trace is active. When the OTel SDK exports a span, it doesn’t know a Sentry error happened during that span.
The OtlpIntegration bridges that gap. It reads the active OTel trace context and stamps the trace_id and span_id onto every Sentry event. That’s what makes an error show up inside its OTel trace waterfall, and what makes the trace waterfall show which spans had errors.
What the OtlpIntegration does under the hood
It does three things:
Configures an OTLP exporter pointed at Sentry’s ingestion endpoint, derived from your DSN. Your OTel spans flow into Sentry over standard OTLP.
Reads the active OTel trace context and stamps it onto every Sentry event (errors, logs, application metrics, etc.) so they appear connected in the trace waterfall.
Optionally registers a SentryPropagator for compatibility with services using Sentry’s native tracing. (Note: this auto-setup is being removed in the next major version across all SDKs, and propagation will be a documented opt-in instead.)
Why this replaced our previous approach
Our previous strategy, which we call POTel, deeply integrated the Sentry SDK with OpenTelemetry. That approach had its benefits: Sentry and OpenTelemetry spans could be interleaved within the same trace, context propagation was unified, and users could take advantage of OpenTelemetry’s instrumentation ecosystem with minimal friction.
Our new approach makes a different trade-off. Rather than requiring every Sentry SDK to integrate deeply with OpenTelemetry, backend SDKs now work independently, with no mandatory OpenTelemetry dependency or coupling to OpenTelemetry’s release cycle. In exchange, we give up in-process span interleaving, but gain a solution that is consistent, portable, and practical across all supported backend SDKs.
For users who need the tighter integration, Java continues to support the original POTel approach, where its mature OpenTelemetry ecosystem makes that model a good fit.
Two env vars and an init call
For Python, all you need is two environment variables for the exporter and two lines in your initialization code.
The integration picks up the OTLP exporter config from OTEL_EXPORTER_OTLP_TRACES_ENDPOINT and OTEL_EXPORTER_OTLP_TRACES_HEADERS, sets up a TracerProvider with a BatchSpanProcessor, and wires trace context onto Sentry events. If you already have your own TracerProvider, the integration detects it and skips auto-setup. Other SDKs follow the same pattern with language-appropriate idioms. See the OTLP integration docs.
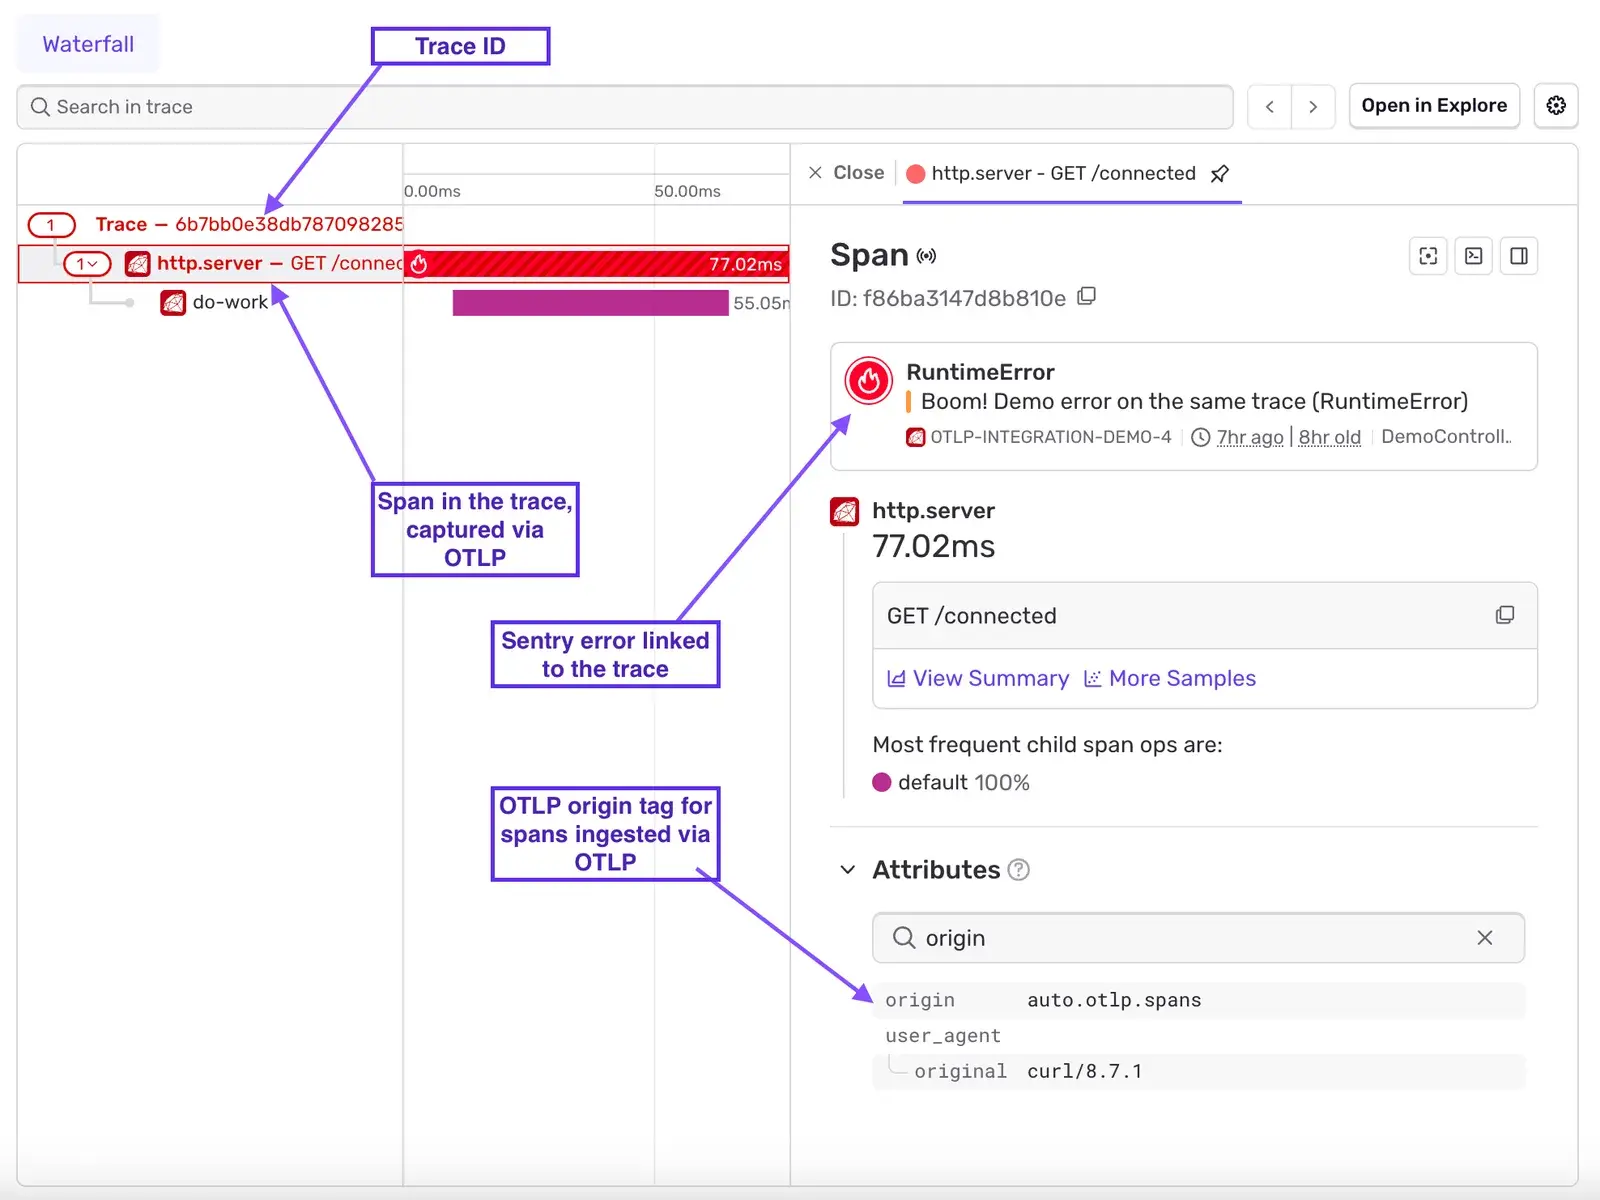
And here’s what you get in Sentry:
Where POTel still lives (and where it doesn’t)
Java is the only SDK where POTel is the current long-term path. Java’s OTel ecosystem is mature and stable. The deep integration gives real value there: Sentry scopes propagation, automatic breadcrumb capture, the works. The OTLP integration exists as an additional option, not a replacement.
JavaScript (Node.js) is in transition. Today, the full Node.js SDK still bundles OpenTelemetry with automatic instrumentation (POTel). We’ve also shipped a lightweight mode (imported from @sentry/node-core/light) that drops the OpenTelemetry dependencies entirely. You still get errors, logs, metrics, and manual spans; you just don’t get automatic instrumentation. In v11, we take a similar lightweight approach. There is no OTel TracerProvider set up, but you do get automatic, Sentry-native auto-instrumentation.
Who is this for?
This is a great fit for teams that:
Are already invested in OTel for backend tracing. They have TracerProvider set up, auto-instrumentation running, maybe even an OTel Collector. They don’t want to rip that out to adopt Sentry tracing.
Use (or evaluate) Sentry for errors. The value proposition: “keep your OTel traces, add Sentry for errors, and the integration connects them. Click an error, see the trace. Click a span, see the errors.”
Run a polyglot backend. The integration works across multiple Sentry SDKs. An org with Python microservices talking to Go services talking to a .NET monolith can instrument each with OTel and see unified traces in Sentry.
Traces and logs yes, errors and metrics no
You get:
OTel spans in Sentry’s trace waterfall, stitched with Sentry errors, logs, and other events on the same trace
Distributed tracing across services, whether they use Sentry native tracing or OTel
OTLP log ingestion (but see caveat below)
You don’t get:
Errors via OTLP. The most common misconception. Errors still require a Sentry SDK. OTLP handles traces and logs, not exceptions. If a customer only wants to point an OTLP exporter at Sentry and skip the SDK, they get traces but no error tracking.
Interleaved Sentry and OTel spans in the same process. You choose one tracing system per service. Don’t set traces_sample_rate on the Sentry SDK if you’re using OTel tracing, because it produces duplicate spans.
OTLP logs connected to errors without OTLP traces. The log-to-error link depends on shared trace context. If you only need logs without tracing, Sentry’s native logging is the better path.
Propagation is becoming opt-in
The automatic SentryPropagator setup is being removed across all SDKs (Python, Ruby, .NET, Java). OTel only allows one global propagator at a time, so silently registering one can conflict with whatever the user has already configured. Users who need sentry-trace header injection for mixed environments will set up a composite propagator themselves.
Most bugs sit in the backlog forever because fixing them costs more than the feature they compete with. With Sentry, Seer, and cloud coding agents, that math has changed.
Good logs are not just messages. They are small, queryable events with stable names, scalar attributes, and enough context to debug production systems.
Learn how to trace MongoDB queries in your .NET apps using OpenTelemetry instrumentation and Sentry's OTLP support, with full correlation to errors and replays.