TL;DR — If your backend already uses OpenTelemetry, you can send traces and logs to Sentry by changing a few environment variables. No SDK swap, no instrumentation rewrite. Point your OTLP exporter at Sentry’s endpoint, add the Sentry SDK on the frontend for browser context, and you get one connected trace from click to backend span.
You already instrumented the backend with OpenTelemetry. Your services emit spans. Your teams know the OTel APIs. Maybe you already run a Collector. So when you start evaluating Sentry, the obvious question is:
Do you need to replace your OpenTelemetry setup with the Sentry SDK?
No.
The practical answer is usually: keep OpenTelemetry where it already works, add the Sentry SDK where it gives you more application context, and send OpenTelemetry Protocol (OTLP) events to Sentry. For a web app, that often means using the Sentry SDK on the frontend for browser tracing, errors, logs, Session Replay, and source maps, while keeping OpenTelemetry on the backend for existing service instrumentation.
One scope note: OTLP can carry traces, logs, and metrics. At this moment, Sentry’s OTLP ingest supports logs and traces, not metrics. We’re considering adding support for them in the future.
The important part is separating two decisions that often get lumped together:
How traces stay connected across frontend and backend.
How backend OTLP events are exported to Sentry.
Once you separate those, the architecture gets a lot easier to reason about.
Sentry vs OpenTelemetry is the wrong question
The first decision is trace linking. If a user clicks a button in your React app and that click triggers a backend request, the frontend and backend need to agree on the same distributed trace context. In this example, the Sentry frontend SDK sends W3C traceparent headers (configurable through the propagateTraceparent option), and the OpenTelemetry backend continues the trace.
That linking is handled by the frontend SDK configuration:
Sentry.init({ integrations: [ Sentry.browserTracingIntegration(), ], tracesSampleRate: 1.0, // ensure traceparent headers get sent propagateTraceparent: true, tracePropagationTargets: [ 'localhost', '127.0.0.1', /^http:\/\/localhost:8000\/api\//, /^http:\/\/127\.0\.0\.1:8000\/api\//, // your backend endpoint here ],})
The second decision is export. After your backend creates telemetry, where do those OTLP events go?
There are two common options:
Send OTLP events directly from the backend to Sentry’s OTLP endpoint.
Send OTLP events to an OpenTelemetry Collector, then have the Collector forward them to Sentry’s OTLP endpoint.
That trace-continuation step is what lets a Sentry-instrumented browser action become the parent of backend OpenTelemetry work, regardless of which OTLP export option you choose.
Direct OTLP and Collector forwarding both end at Sentry’s OTLP endpoint. The difference is whether your service talks to Sentry itself or talks to a Collector first.
Approach
Use it when
What you get
Tradeoff
Direct OTLP to Sentry
You have one backend service or project and want the smallest setup
Fewer moving parts and a short path from service to Sentry
Less central control over processing, sampling, and routing
Collector forwarding
You have multiple services, already run a Collector, need processing, or want multi-vendor routing
Centralized routing, batching, processing, sampling, and easier vendor evaluation
Another component to deploy and operate
Direct OTLP is the simplest path for a single backend project:
Collector forwarding is the better fit when your observability setup is already more than one app talking to one destination. It gives you one place to receive telemetry from many services, batch it, process it, and send it to one or more backends.
That last part matters when you are evaluating Sentry. You can keep routing telemetry to an existing vendor while also forwarding a copy to Sentry, then compare the debugging experience without rewriting backend instrumentation.
There is one important Sentry-specific detail for larger setups: a generic OTLP HTTP exporter points at one Sentry project endpoint with one project key. If you send every service through that one exporter, every service lands in the same Sentry project. For multi-project routing, use the Sentry exporter. It can route OTLP events to projects based on a resource attribute like service.name, and it can auto-create missing projects when configured with the right Sentry API permissions.
A demo architecture
Let’s check out a demo project that uses the Collector forwarding path:
The frontend lives in frontend/. It is a React + Vite app using @sentry/react. The backend lives in backend/. It is a FastAPI service using the OpenTelemetry SDK, FastAPI instrumentation, SQLAlchemy instrumentation, manual spans, and standard logging in checkout logic. The Collector lives in collector/ and forwards those OTLP events to Sentry.
The point of the demo is not that every layer uses the same SDK. The point is that every layer participates in the same trace, with backend logs attached to that debugging context.
The frontend uses the Sentry SDK
The Sentry setup is in frontend/src/instrument.ts. It enables browser tracing, Session Replay, logs, and trace propagation:
The frontend checkout flow is in frontend/src/hooks/useCheckoutLab.ts. It creates Sentry spans for user-facing work, logs useful state changes, and captures unexpected errors:
There is no manual trace header code in that request. The Sentry browser tracing integration handles the propagation as long as the destination matches tracePropagationTargets.
It creates an OpenTelemetry TracerProvider, attaches service resource attributes, exports spans over OTLP HTTP, and registers W3C trace-context propagation:
It also configures OTLP log export. The backend creates a LoggerProvider, attaches an OTLPLogExporter, and adds an OpenTelemetry LoggingHandler to the app logger:
This is easy to miss. If your browser is making cross-origin requests and CORS blocks the propagation headers, your frontend and backend traces can split apart even if both sides are instrumented correctly.
The checkout flow adds manual OTel spans and logs
The backend service code in backend/app/services/checkout.py models a checkout workflow. It creates manual OpenTelemetry spans for business operations:
def validate_cart(engine: Engine, payload: CheckoutRequest) -> dict[str, ProductRow]:
    with tracer.start_as_current_span("checkout.validate_cart") as span:
        requested_ids = [item.product_id for item in payload.items]
        span.set_attribute("cart.item_count", len(payload.items))
        ...
The checkout path includes spans for:
checkout.validate_cart
checkout.reserve_inventory
checkout.calculate_tax
checkout.payment
checkout.write_order
checkout.send_confirmation
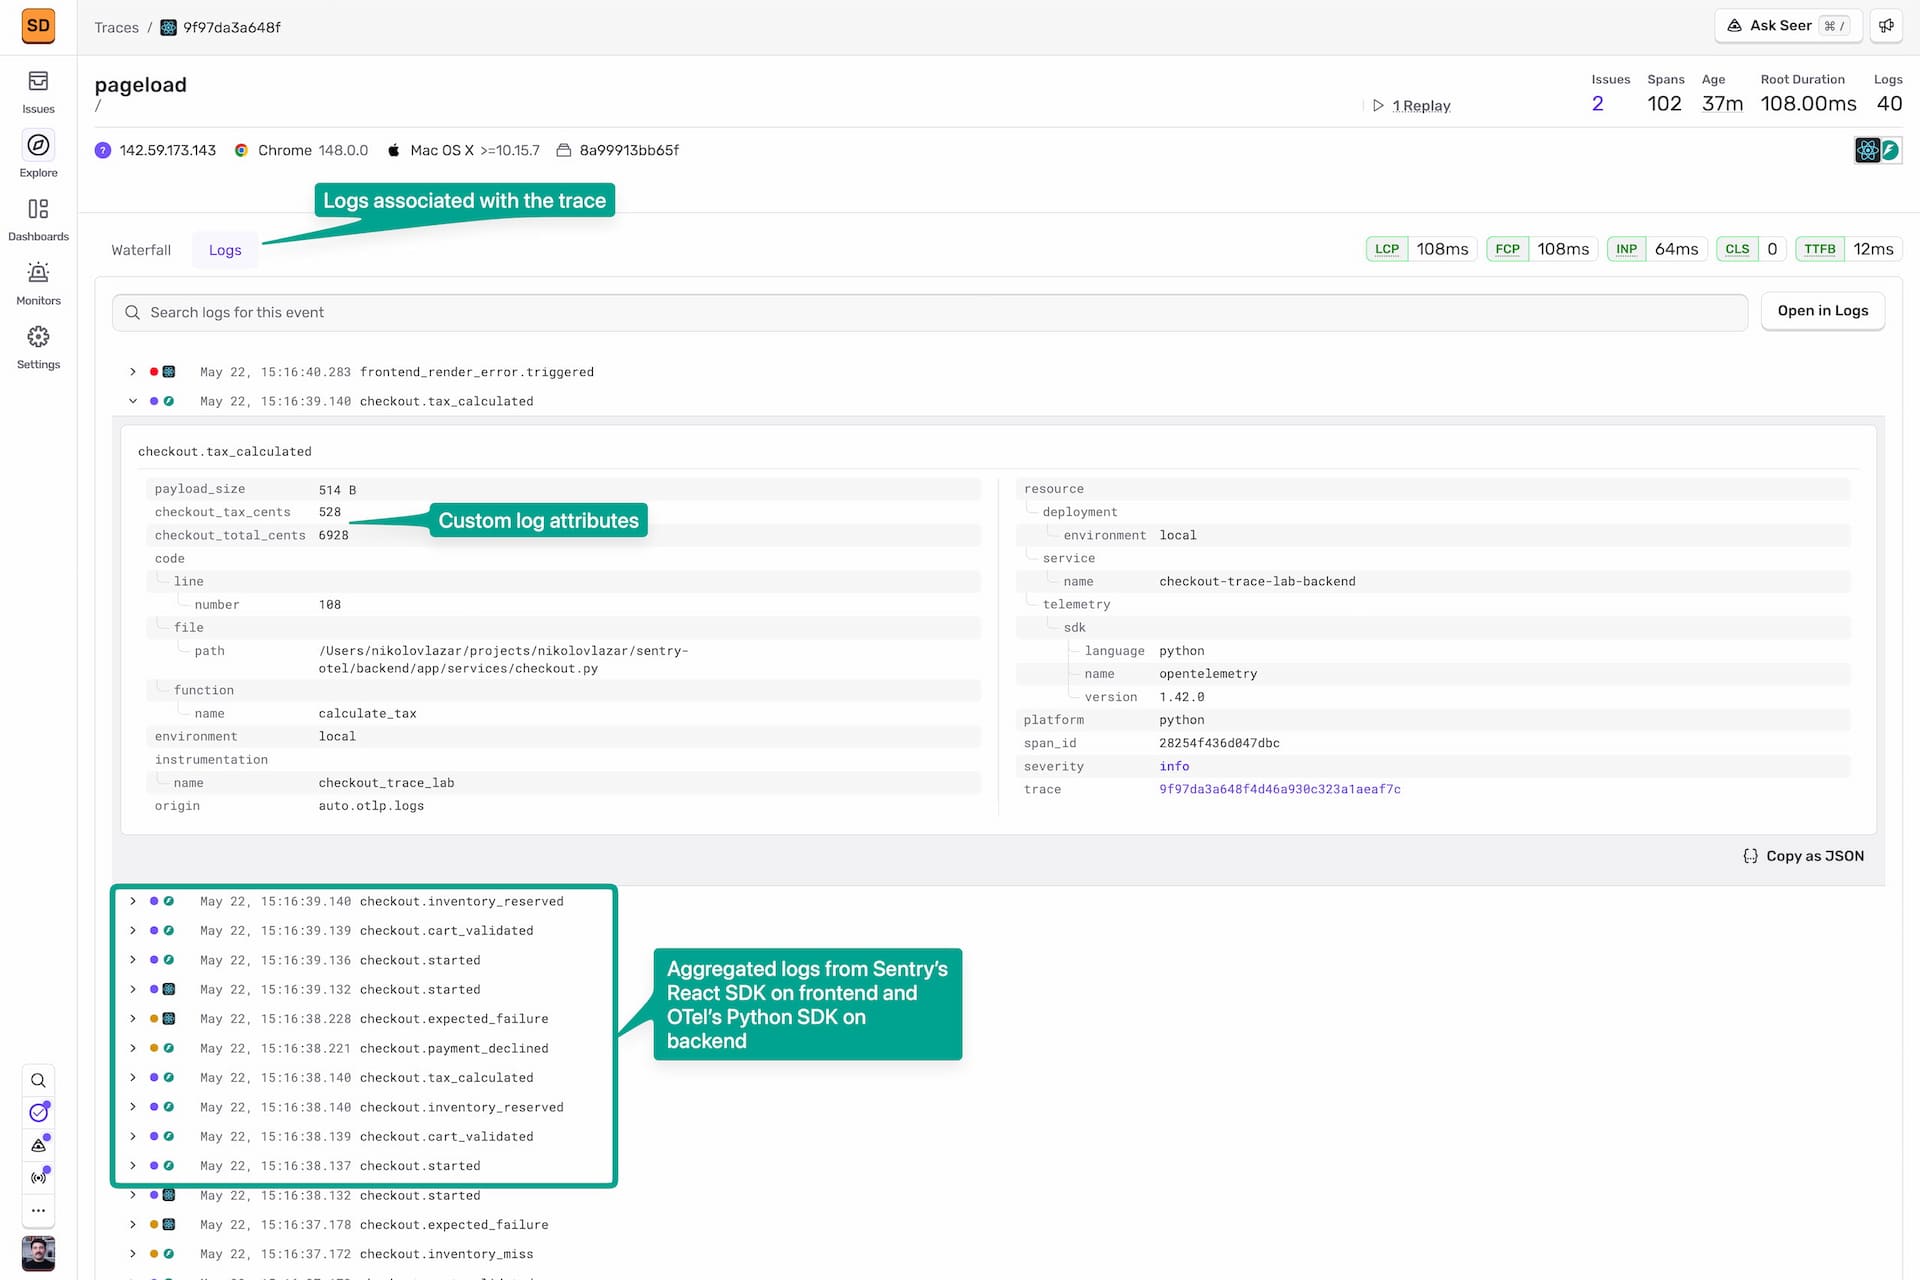
It also emits backend logs for the same business steps, such as checkout.started, checkout.cart_validated, checkout.inventory_reserved, checkout.payment_approved, checkout.order_written, and checkout.completed. Those logs go through Python’s standard logging API, then the OpenTelemetry LoggingHandler exports them through OTLP.
This is the part OTel-first teams care about most. Those spans and logs stay in the OpenTelemetry pipeline. You do not need to rewrite them with Sentry.startSpan() or Sentry logging APIs just to view the trace and related logs in Sentry.
Reminder: this demo uses generic otlphttp for a single Sentry project. For multi-project routing or automatic project creation, swap it for the sentry exporter.
The configured pipelines send to both the debug exporter and Sentry:
That is the Collector forwarding pattern: the backend sends OTLP events to one local endpoint, and the Collector decides where that telemetry goes next.
What each layer is responsible for
The cleanest way to understand this architecture is by ownership.
The frontend Sentry SDK owns browser-specific debugging context:
Browser spans and frontend transactions
Frontend errors and React error boundaries
Session Replay
Frontend logs
Source maps through the Sentry Vite plugin
Trace propagation to the backend
The backend OpenTelemetry SDK owns backend instrumentation:
FastAPI request spans
SQLAlchemy spans
HTTPX spans if the backend calls other services
Manual checkout spans
Backend logs exported with OpenTelemetry
Resource attributes such as service.name and deployment.environment
OTLP export to the Collector
The Collector owns routing and processing:
Receiving OTLP on 4317 and 4318
Batching telemetry
Printing debug output locally
Forwarding to Sentry’s OTLP endpoint
Providing the place to add sampling, transforms, filters, or multi-vendor routing later
This is why Sentry and OpenTelemetry are not competing choices here. They are doing different jobs in the same observability pipeline.
What you can see in Sentry
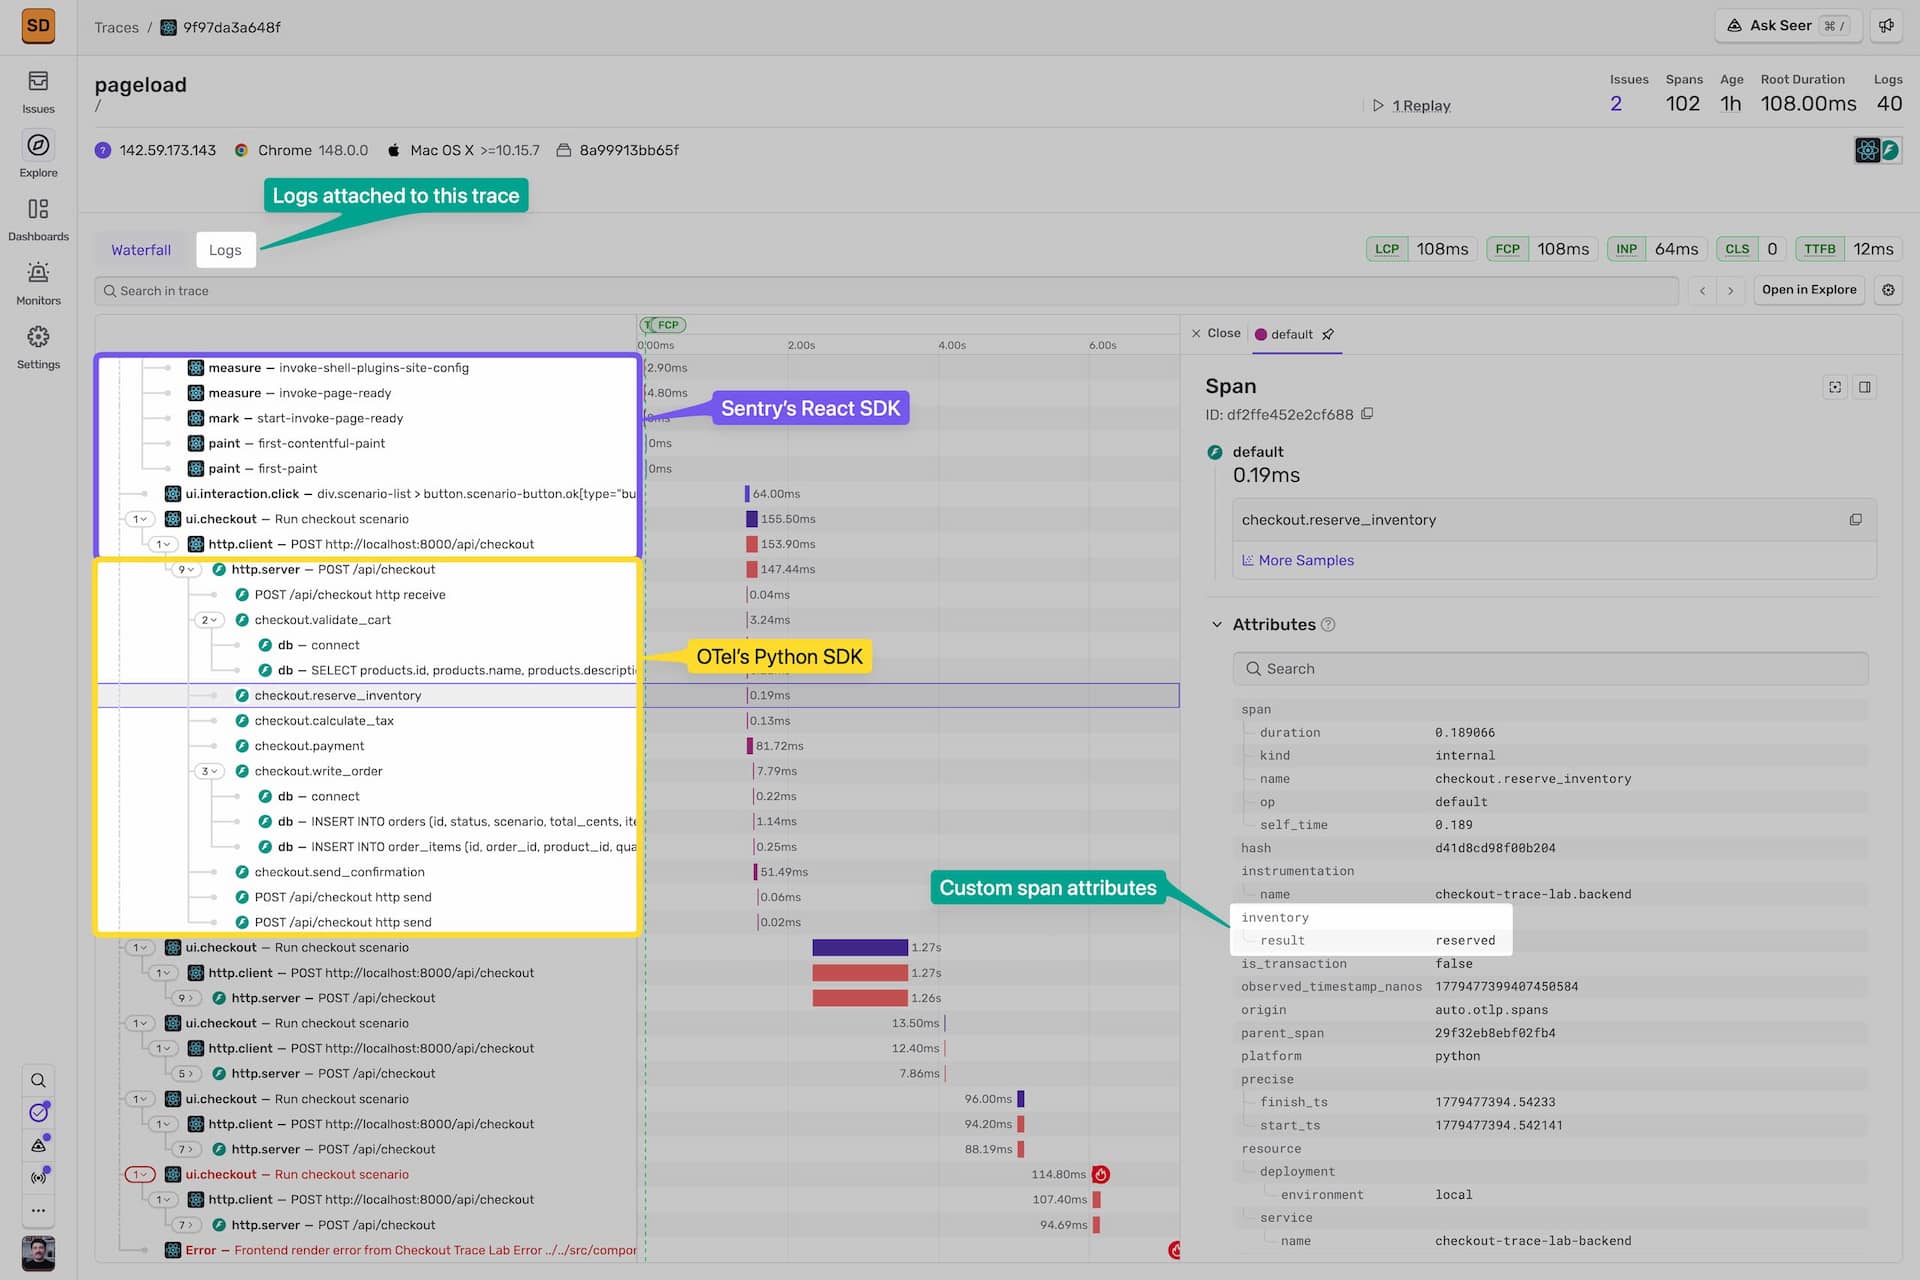
In the demo, I ran the checkout scenarios from the same frontend session. In Sentry, they show up as one connected trace that starts in React and continues through the FastAPI backend. You can see the normal checkout, slow payment, inventory miss, payment declined, and backend crash work in the same distributed trace instead of jumping between separate tools.
The backend logs are associated with that trace too. Logs like checkout.started, checkout.inventory_reserved, checkout.payment_slow_path, and checkout.completed come from Python’s standard logging API, get exported through OTLP, and land in Sentry attached to the same debugging context as the spans.
That is the useful part of the setup: the frontend SDK gives you browser context, the backend keeps its OpenTelemetry spans and logs, and Sentry gives you one place to inspect the full request path.
A decision tree for your own app
Use direct OTLP to Sentry when:
You have one backend service or one project.
You want the fewest moving parts.
You do not need central processing or multi-destination routing yet.
Use Collector forwarding when:
You already run an OpenTelemetry Collector.
You have multiple backend services.
You need services to land in separate Sentry projects.
You need sampling, filtering, transforms, or batching outside the app process.
You want to send telemetry to Sentry and another vendor while evaluating Sentry.
Add the Sentry backend SDK later when:
You need error monitoring. OpenTelemetry does not capture and send errors to Sentry—only the Sentry SDK can capture backend exceptions and link them to the trace, so you can jump from an error to the full request path and inspect the related logs, spans, and context.
You want other Sentry features that are not represented by your current OpenTelemetry data.
That last step is optional, not a prerequisite. You can start with Sentry on the frontend and OpenTelemetry on the backend, then decide later whether adding the backend Sentry SDK is worth it for your services.
Start with the smallest change that preserves your trace
If your backend already uses OpenTelemetry, do not start by rewriting instrumentation. Start by deciding where OTLP events should go.
For a single backend, direct OTLP to Sentry is usually enough.
For multiple services, vendor evaluation, or anything that needs routing and processing, put a Collector in the middle.
Then link your frontend Sentry SDK to your backend OTel SDK with W3C traceparent propagation. That gives you the useful part first: one trace that starts where the user action starts and continues through the backend code you already instrumented. For a step-by-step walkthrough, see how to route your existing OpenTelemetry traces to Sentry.
You do not need to pick Sentry or OpenTelemetry. Use both where they fit.
FAQs
Do I need to remove OpenTelemetry to use Sentry? ▾
No. If your backend is already instrumented with OpenTelemetry, keep that instrumentation and send its OTLP events to Sentry. Add the Sentry SDK where it gives you extra context, such as frontend errors, Session Replay, browser tracing, logs, and source maps.
When should I use direct OTLP instead of a Collector? ▾
Use direct OTLP when you have one backend service or project and want the simplest possible setup. Use a Collector when you have multiple services, need processing or tail-sampling, or want to route telemetry to multiple backends (useful when evaluating Sentry).
What do I lose if my backend only uses OpenTelemetry and not the Sentry SDK? ▾
You can still send backend OTLP events to Sentry. However, OpenTelemetry does not capture and send errors to Sentry—you'll need the Sentry SDK for error monitoring. Other backend-only Sentry SDK features such as profiling and SDK-specific context also require adding the Sentry backend SDK or a Sentry OpenTelemetry integration later.
Does Sentry ingest OTLP metrics? ▾
Not yet. At this moment, Sentry's OTLP ingest supports logs and traces, not metrics. We're working on supporting metrics as well. If you need metrics now, keep your existing metrics pipeline or use Sentry's Application Metrics through the Sentry SDK where supported.
We moved Android SDK operations to a worker isolate, then streamlined scope updates by removing duplicate normalization and encoding JSON directly into UTF-8 bytes.
The back/forward cache is one of the most impactful performance features on the web and one of the least observable, because success looks like silence. Here's how we made it measurable.