Improving mobile performance, from slow screens to app start time

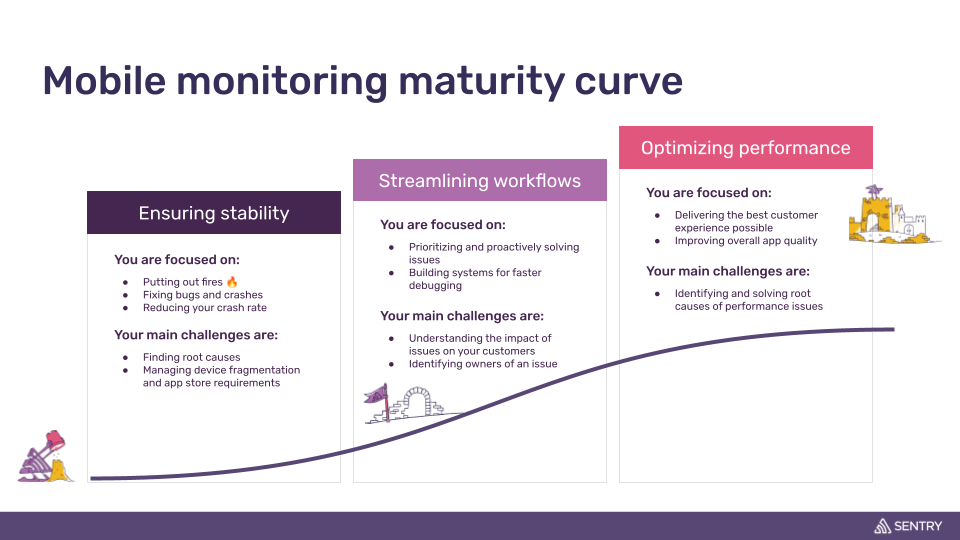
Based on our experience working with thousands of mobile developer teams, we developed a mobile monitoring maturity curve here at Sentry. We hypothesized that once teams achieved stability and were no longer firefighting and fixing crashes, they’d shift to streamlining workflows and eventually focus more on optimizing mobile app performance.
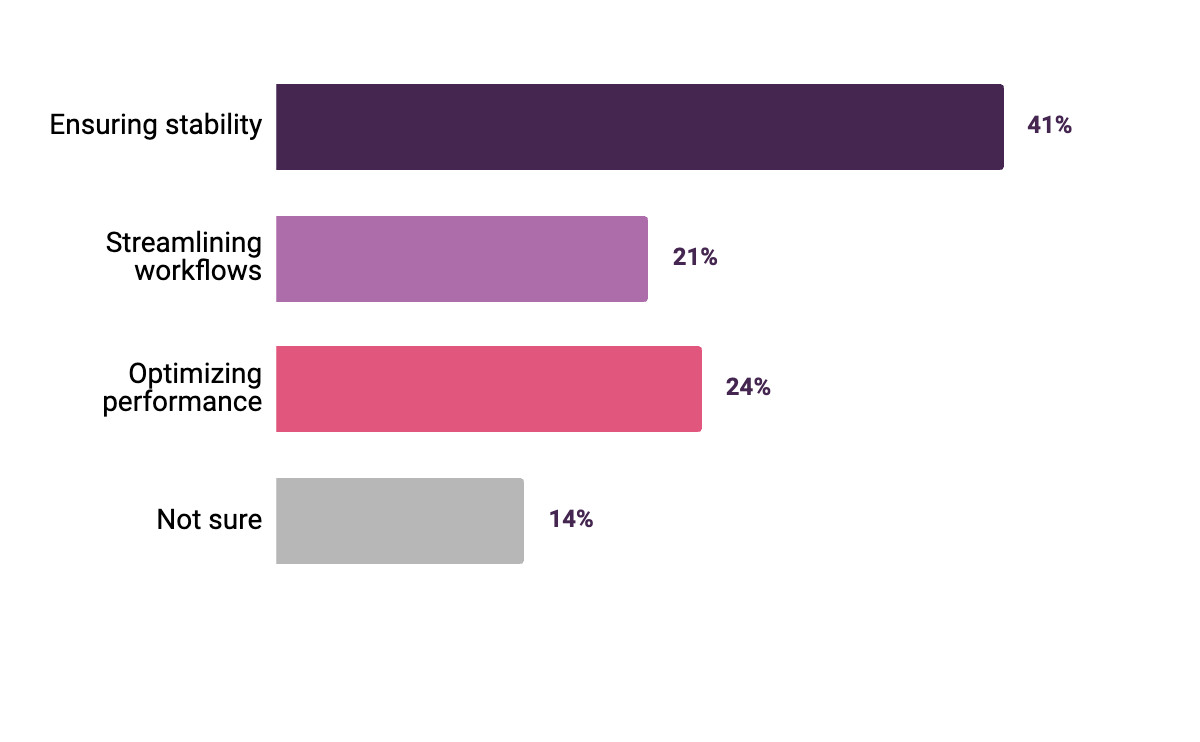
In a recent workshop, we asked mobile devs where they fell on the curve. The results were surprising.
Most developers (41%) were at the “ensuring stability” stage of their mobile monitoring journey. And nearly a quarter (24%) were currently optimizing performance.
Although it requires focus and resources, improving performance is critical to the success of your mobile app. To help developers move up the maturity curve, we’re improving how they can detect and fix mobile performance issues. We can break these improvements down into four key components:
We’ve developed a troubleshooting workflow focused on mobile screen load times, specifically TTID (Time to Initial Display) and TTFD (Time to First Display).
TTID is the time it takes to display the first frame, which lets the user know the app is loading. TTFD is the time it takes for meaningful content to be displayed on the screen and for the app to be fully interactive. No one wants to wait several seconds before being able to scroll through a news article or shop for a snazzy piece of clothing — if either TTID or TTFD are slow, users may exit your app before it even fully loads.
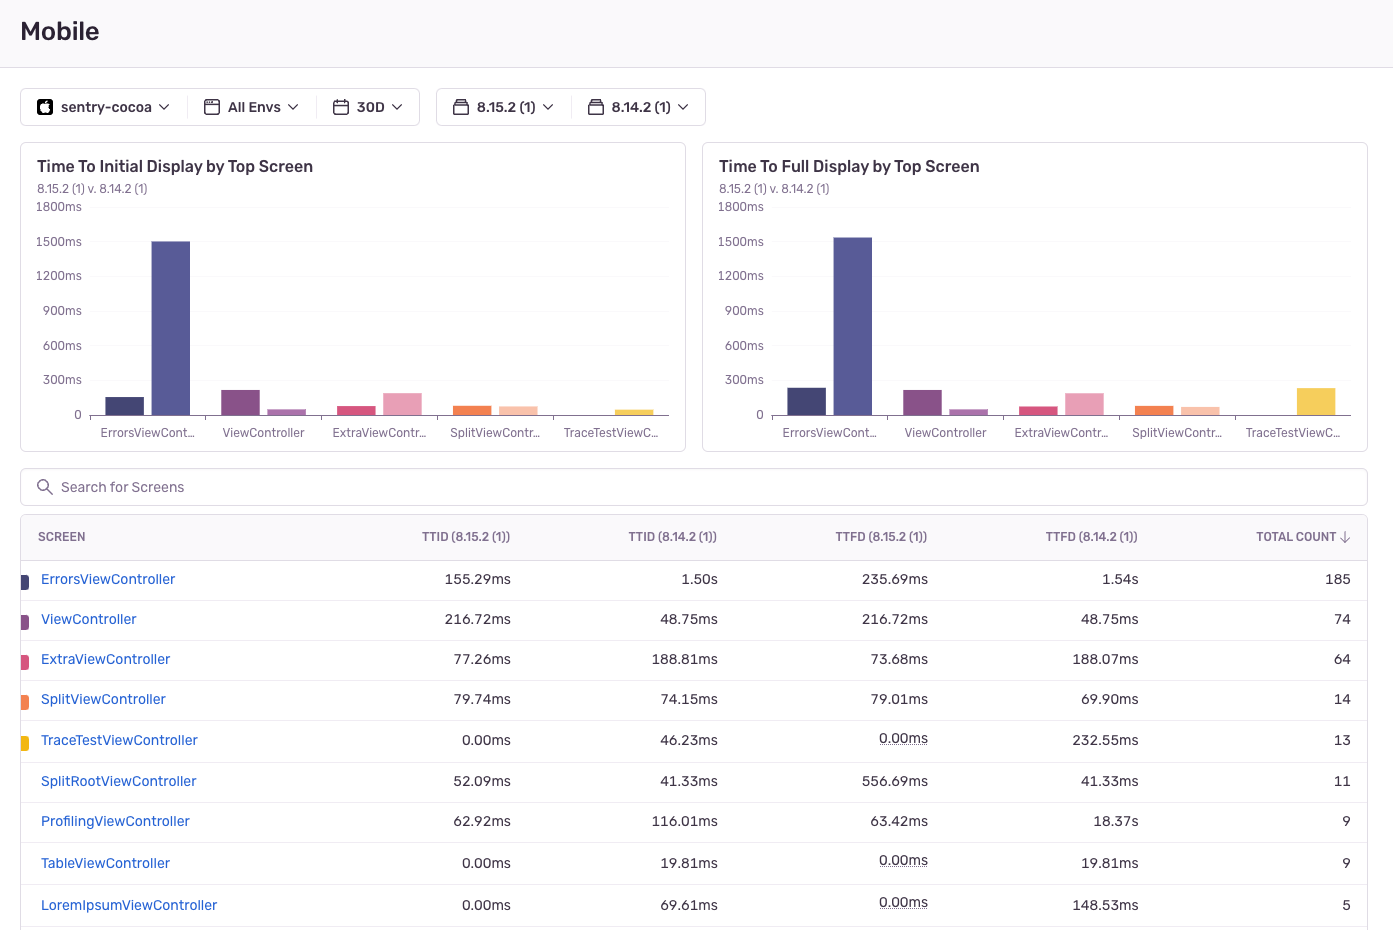
TTID and TTFD highlight work contributing to slow metrics in production. With Sentry’s Screen Loads, you can see user screens with the highest traffic and compare TTID and TTFD across releases. This can highlight potential performance bottlenecks introduced in new releases, so you can then investigate the code changes, dependencies, or assets causing the slowdown. (See screenshot below)
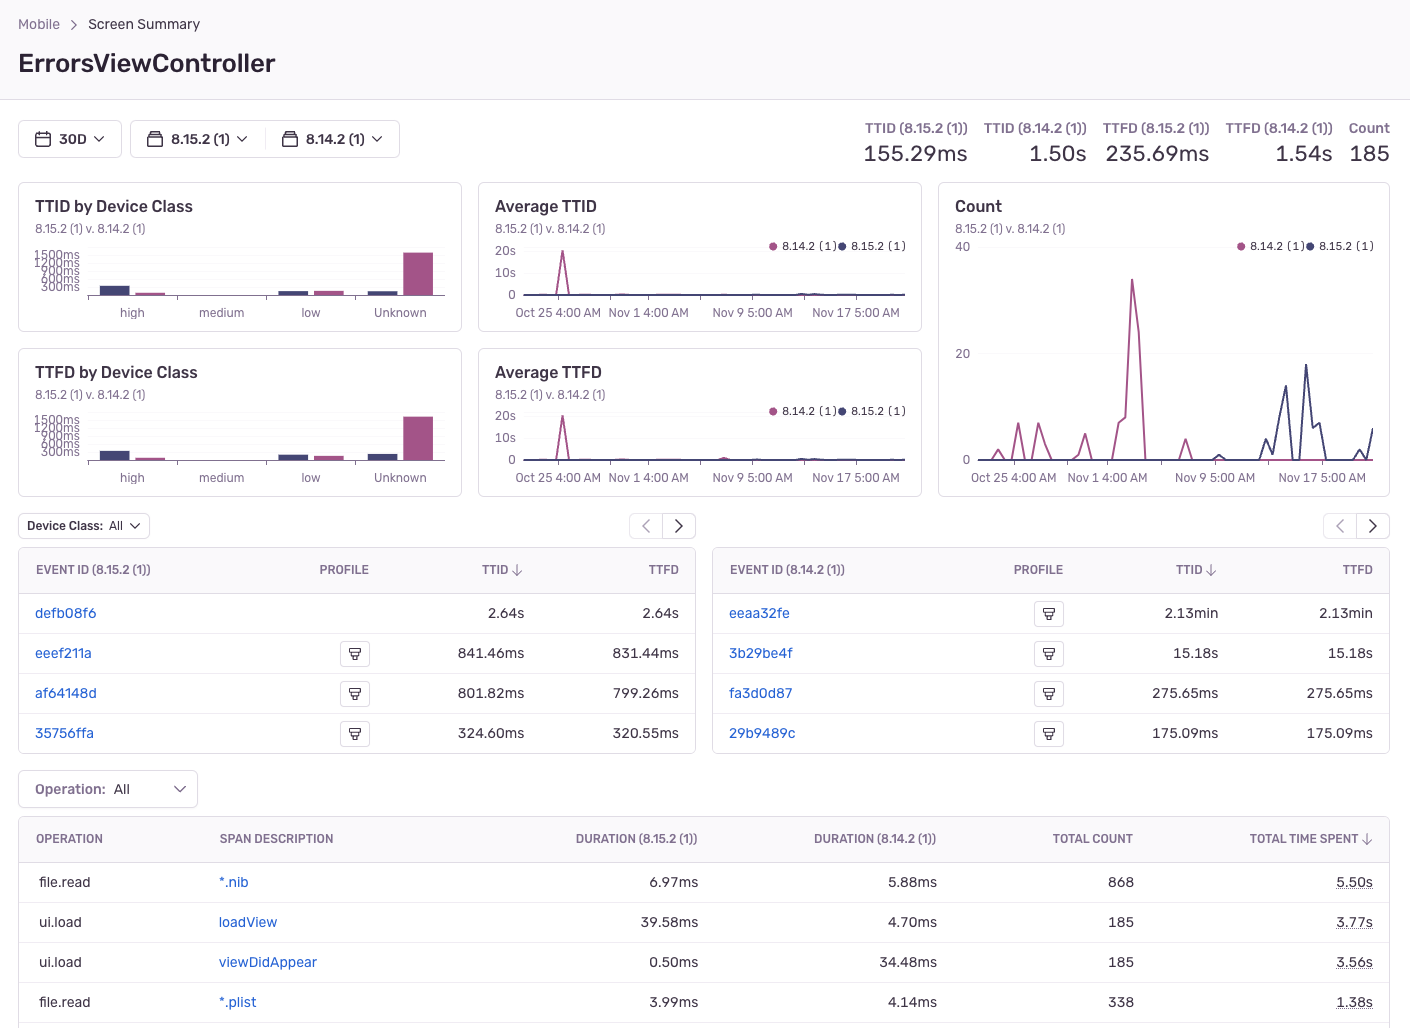
You can also look at screen load summary metrics for a single screen, plus filter by mobile device class and see the average TTID / TTFD across releases. Below the summary graphs, you’ll see the most time-consuming spans — for these, you can also filter by operations. This gives you the necessary context to know which operations are causing your TTID or TTFD to be slow (see screenshot below).
Screen Loads is now available for all Android and iOS users.
Our new mobile Performance updates also help you identify the root causes of slow app starts.
The mobile app launch sequence refers to the steps from when your app is launched up to TTID. A quick app start is crucial for positive user impressions, ensuring high satisfaction, retention, and conversion rates.
Whether it’s a cold start (when your app is launched for the first time) or a warm start (when your app is brought from the background to the foreground) — app start times can also affect how your app is ranked or discovered in the Apple or Google Play store.
In Sentry, you can now use App Start in Sentry’s Performance navigation bar to monitor the performance of your recently released app version.
Like in the example below, you can compare cold (or warm) start times from one release to the next, and identify regressed spans by comparing event IDs from both releases. You can then click into a regressed span to drill even deeper and confirm whether a certain method has experienced an increase in duration.
With the span description, you can identify the class and method, enabling you to pinpoint the dependency causing the regression. And if certain spans are blocking TTID, you can delve into the profile from the span to see the exact function calls causing the slow start.
This workflow is currently available for Android and iOS, with support for React Native coming soon.
With more and more users getting their daily information from their mobile devices, the responsiveness of your mobile app is also strongly tied to store ranking and user retention. To improve application responsiveness, we’ve identified a few stall metrics to provide a workflow around:
Slow and frozen frames - typically, a phone or tablet renders 60 frames per second (fps). At 60 fps, a slow frame is a frame that takes > 16.67 ms to render. A frozen frame is a frame that takes > 700 ms to render.
Frame delays - the user-perceived delayed duration of all rendered frames
Scroll hitches - the time a frame appears on screen later than expected
Each of these metrics indicates if the user is having a rough experience interacting with a mobile application. By surfacing these metrics in an intuitive workflow, we aim to help mobile devs drill into user behavior and understand why these stalls are happening.
Ultimately, we aim to consolidate key metrics for mobile applications into a single view. With one unified mobile service view, you have a starting point to quickly understand if there are any urgent issues or performance regressions release-over-release.
The mobile service view will include:
Application health metrics, like Crashes and ANRs
Performance metrics, including app starts, screen loads, and app responsiveness
Release health metrics, such as release adoption
We’re also exploring summarizing all mobile-centric performance metrics as a single mobile performance score, eventually guiding users through troubleshooting workflows from this view.
At Sentry, we're addressing the need to improve mobile performance by helping developers optimize their screen load times, identify slow starts, eliminate UI Jank, and get their key metrics in a unified view. With new mobile troubleshooting workflows, developers can further enhance user experience.
Where are you on the mobile maturity curve? Drop us a line on GitHub or Discord — we’d love to keep the conversation going. You can also watch this workshop for more best practices for mobile app performance monitoring with Sentry. And, try out Sentry Performance here today if you haven’t already.


