Debugging slow pages caused by slow backends
Debugging slow pages caused by slow backends
As a developer, what should your reaction be when someone says your website is slow to load? As long as you don’t say, “I just let my users deal with it”, you’re already on the right track. Since you’ve chosen to relieve some user suffering, I’m here to help guide you through the process of identifying and fixing those slow loads and performance issues.
The truth is that how you solve performance issues varies, and as a developer, you always want the fastest path to resolution. If you have a small to midsize static site, the Lighthouse score built into your browser's dev tools is probably good enough. It’ll show you your Core Web Vitals for the individual page and will generally give you enough information to make the necessary changes to improve website performance. That said, Lighthouse scores alone shouldn’t be the goal; they’re really just the beginning of the conversation about performance. When your website grows or is no longer static, you’ll likely need more insight and detail for debugging performance issues, and that's where Sentry comes in.
Throughout this post, I’m going to reference a site I’ve developed. This site is far from static, with each route dynamically rendering a custom Pokemon-like card for a user based on their in-game scores for a popular rhythm game. Because of its dynamic nature, it’s impossible to test every route on every browser and every network my users might be using. Instead, I need to monitor the performance of real sessions from real users to know when I have a problem and how I can solve it.
Finding the issue
Without a monitoring tool, you are likely to encounter performance issues in one of two ways: from dogfooding (using your app yourself), or user reports. Dogfooding is important, but you’re likely only using your app on a single, high-end device with a good internet connection; and you should consider if that is common amongst your users. User reports can be very useful, but let’s be honest, they are few and far between if you don’t have obvious reporting channels (and even then it can be unhelpful and/or hard to recreate). Problems arise when trying to act on a low amount of unreliable data and unless you’re constantly reading your logs and timing requests, it’s hard to pin down exactly where you went wrong and why.
Sentry’s User Feedback & Session Replay
With Sentry, you can opt-in (by adding a single line of code) to a User Feedback widget that is present on your site at all times. The widget allows users to report bugs they find directly to your Sentry dashboard with an option to add a screenshot, providing immediate and actionable insights. Additionally, Sentry couples this feedback with a Session Replay event, enabling you to see a full recreation of the user's interaction with your website, including breadcrumbs with additional useful details each time the user clicks a button or navigates around your site. I was recently alerted to a slow page load on my website when a user submitted feedback via Sentry’s widget asking why it took so long to load. Upon checking their session replay, it was clearly very slow to load, but even with the information provided in the feedback and session replay, I wasn’t able to find an obvious problem or quick solution like an oversized image or excess JavaScript. For this issue, I had to dig a little deeper into Sentry's Trace View.
Using Tracing
Tracing in Sentry is a tool used to track the performance of your code by giving you a connected view of your software, linking transactions from your frontend to backend and across services. The Trace View can give you information anywhere from how long each transaction takes all the way down to the device and browser your user was using to help debug more specific issues. Trace Views are also attached to replays, whether triggered by User Feedback or an issue, making it easy for you to dig into everything that happened behind the scenes including when a user loaded a page, clicked a button, or navigated around your site. After consulting the trace in the session replay event (alongside a little digging through the Performance tab) I found that the (pretty egregious) slowdowns on my site were in the load functions during navigation. That's good to know, but I wrote the code over 15 minutes ago, how am I expected to remember what it does? Luckily for me, Sentry provides the details, down to the request, right out of the box.
The fix
Repeat requests
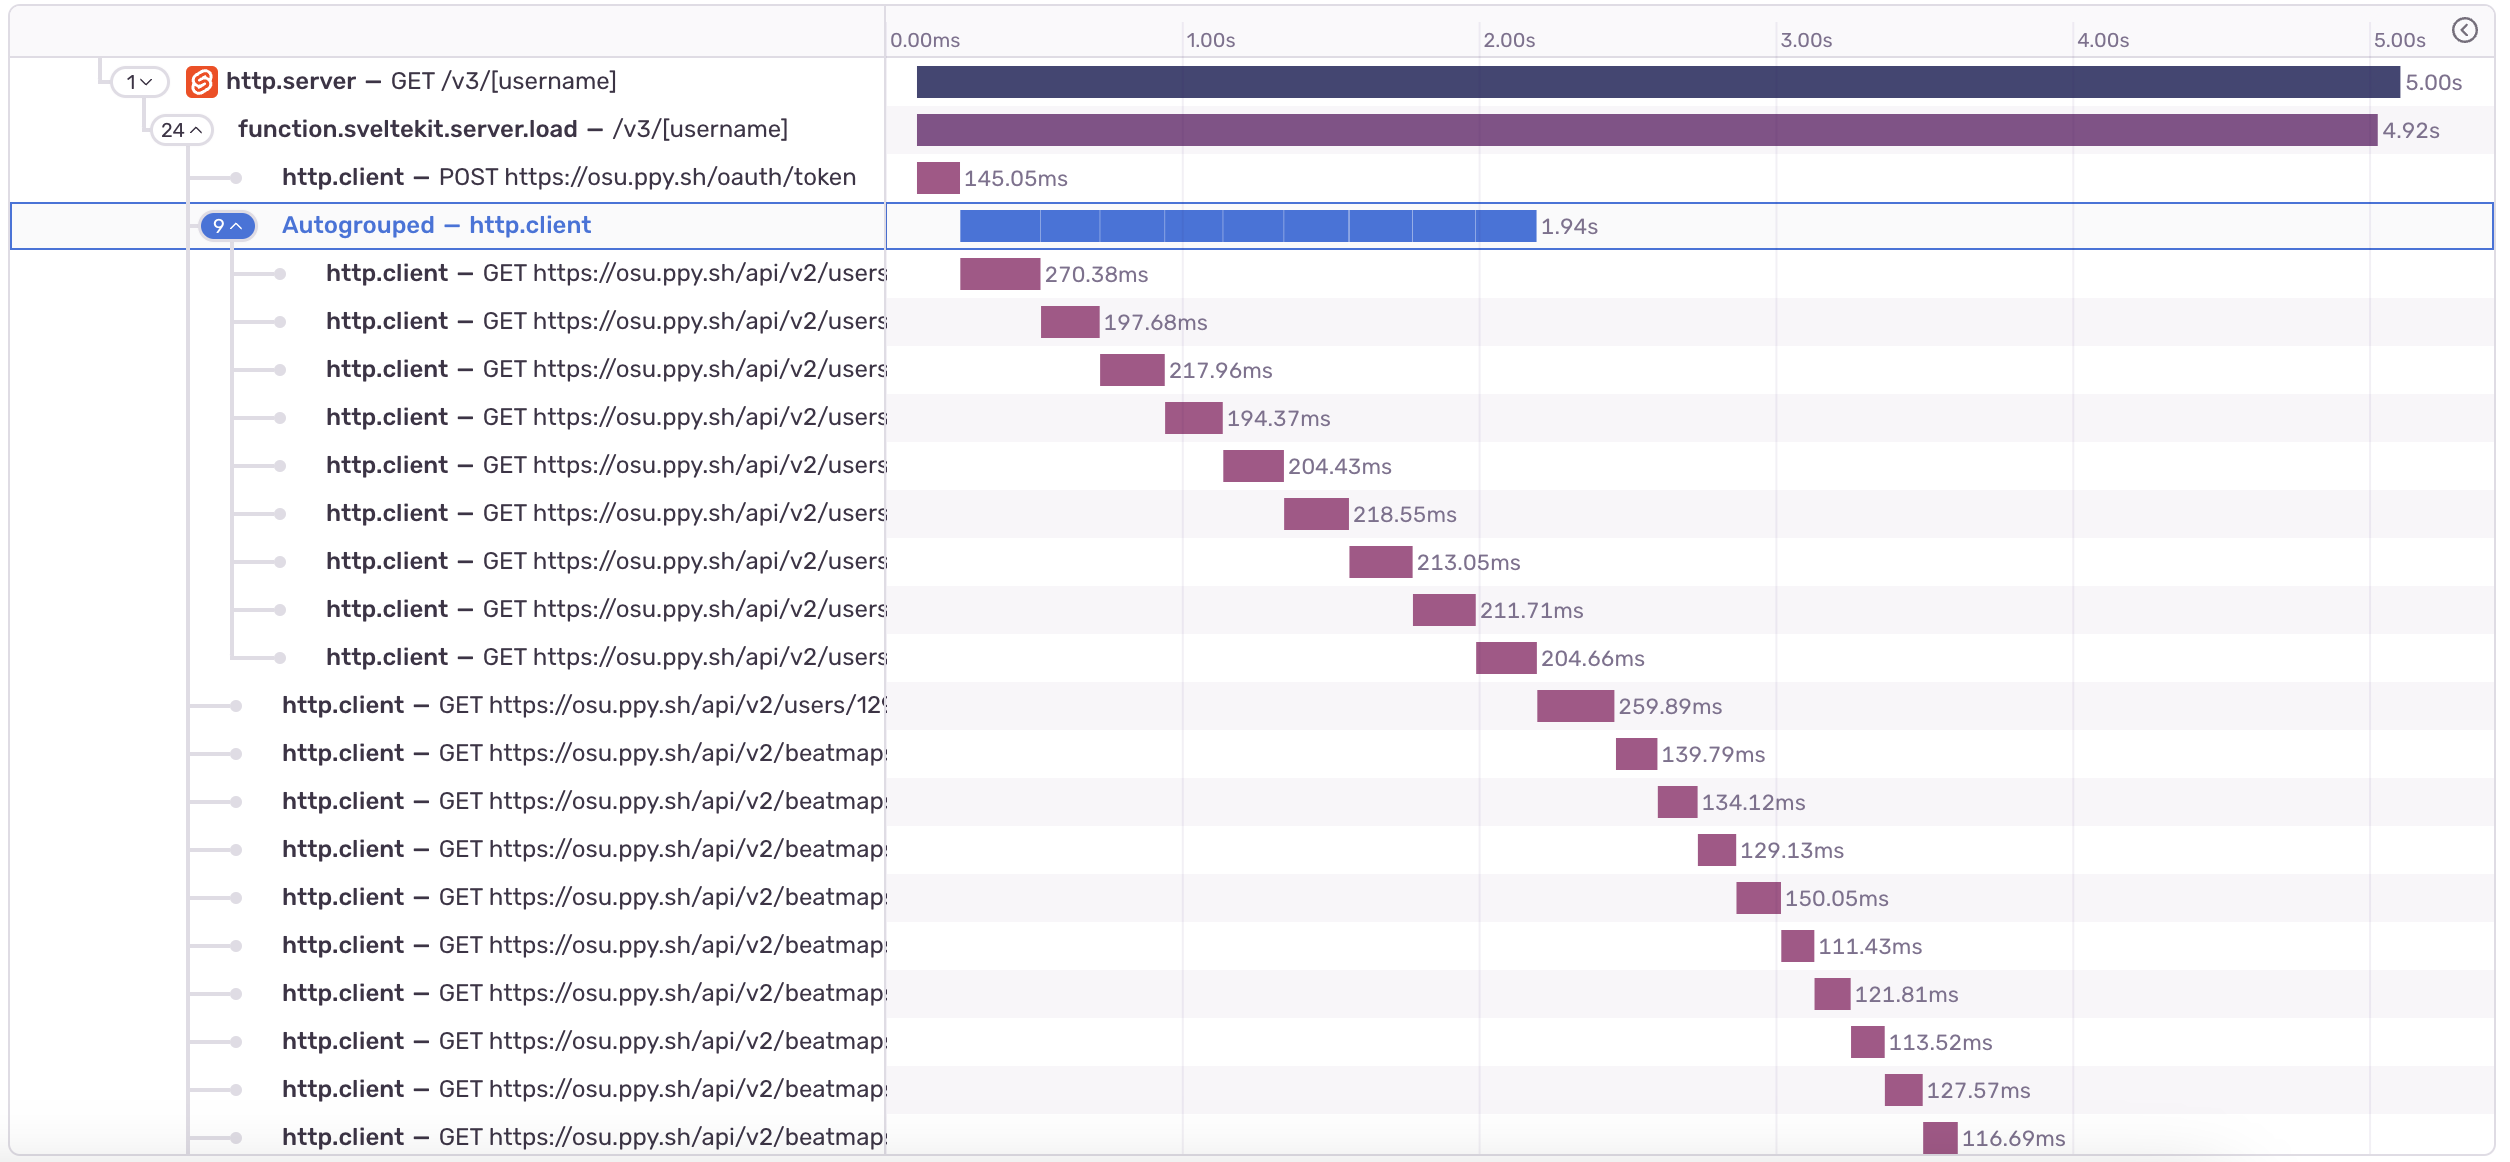
The first mistake I made, and one that should have been obvious when writing it, was unnecessarily making the same request over and over, only retrieving one thing at a time. When I was constructing my “user” object, I needed to pull specific properties from a big chunk of JSON data but instead of just returning the properties I wanted in a single function call, I created my array by calling that same function eight times over, only getting a single property each time.
const userProperties = [
'id',
'avatar_url',
'country_code',
'is_supporter',
'username',
'global_rank',
'playstyle',
'join_date'
];
for (const property of userProperties) {
// Makes a call to an external API
userInfo[property] = await getUserInfo(username, property, token);
}With Sentry’s Trace View, I was able to quickly pinpoint the issue that luckily had a very simple solution. The blue “autogrouped” spans (that took nearly 2 seconds 🤮) was the first thing that stood out to me, and upon expanding it and seeing that each span had the same request endpoint, it was beyond obvious what the fix in my code needed to be.

Request waterfall
Alright, enough of the comically bad code and on to an issue with a less clear solution. In the image above, you can see that even beyond the “autogrouped” requests, there is a little staircase down to the end of the page load. This is called a request waterfall, caused by making requests (in our case, to an external API) in series, only starting one after finishing the previous.
This waterfall is something we want to avoid as much as possible, but there are situations in which requests need to be made in succession (generally when the request of one call relies on the result of the former) and that's initially what I thought was the case with my code. I’m getting a list of song IDs from one call, but to get some more specific information, I need to make a separate request for each specific ID. My initial thought was that since the information can’t all be gathered from a single request, they need to be called one by one and the performance I currently had was just going to be what it was. Fortunately for me, I’m not the first person to have had this problem, and I found two solutions that helped avoid the request waterfall.
Running in series vs parallel
When looking to optimize the performance of your load times, avoiding running requests in series is paramount but not always possible. It’s important to be able to tell when something needs to be run in series and when it doesn’t because whenever possible you should be running requests alongside one another. The opposite of running in series is running in parallel where, as the name suggests, all of the requests run at the same time, and resolve as a group whenever the slowest request finishes. In JavaScript, the difference in the code is quite slim but what actually happens during runtime is vastly different.
//Series
let topPlayInfo = [];
for (let i = 0; i < 20; i++) {
  topPlayInfo.push(await getMapInfo(token, plays[i]['beatmap']['id']));
}

//Parallel
const topPlayInfoPromises = [];
for (let i = 0; i < 20; i++) {
  topPlayInfoPromises.push(getMapInfo(token, plays[i]['beatmap']['id']));
}
const topPlayInfo = await Promise.all(topPlayInfoPromises);
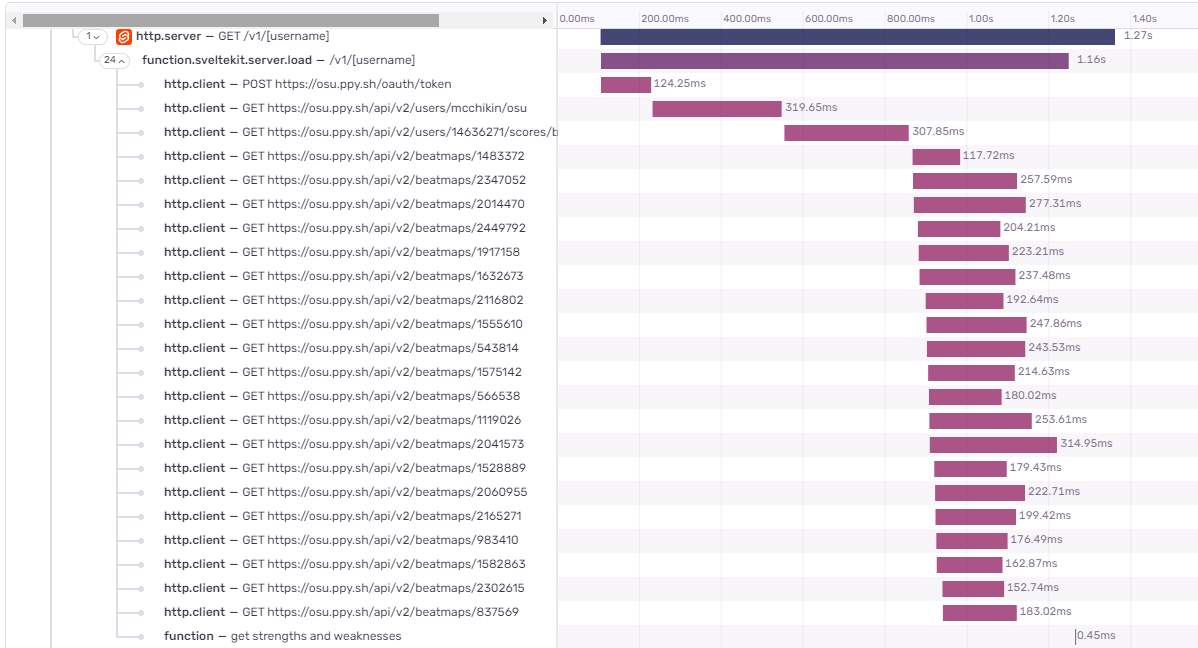
After changing the code from calling requests in series to parallel as seen above, we finally get rid of the dreaded waterfall and can confirm this in Sentry. Comparing the trace of both load functions, we can see that what was once a staircase is now more like a cliff, with the page loading as soon as the slowest request finishes. After changing the way we process the requests, we were able to bring down the p75 (the average page load speed for 75% of users) from 6.5 seconds down to just 2.3, which is good, according to Google’s Lighthouse scoring.

One step further
We can take this massive gain in performance one step even further with promise streaming in SvelteKit (or something like this, in React). Streaming promises from your server’s load function to the client allows your page to render before all of your requests have finished. While this does come with some added complexity of dealing with possible Cumulative Layout Shift, it has the opportunity to drastically improve your page load speed and can make the most important data to your user available more quickly while you wait for additional, non-essential requests to finish.
const topPlayInfoPromises = [];
for (let i = 0; i < 20; i++) {
	topPlayInfoPromises.push(getMapInfo(token, plays[i]['beatmap']['id']));
}

return { topPlayInfo: await Promise.all(topPlayInfoPromises) };
Performance is worth your while
In the beginning of this article, I mentioned that the path to the quickest resolution is always the path that should be taken. Performance issues are unique in the fact that they are not “bugs” and can be overlooked by many developers because they aren’t causing the website to throw errors or crash. However, consistently quick load speeds are equally, if not more, important to a user than an edge case error that happens once every 10,000 sessions. Using Sentry makes finding and resolving these rather abstract issues quite simple, with a focus on showing only the relevant details, while still allowing you to dig deeper into the issue if you need to.
Learn more about debugging performance issues
Want to learn more about how Tracing in Sentry can help you debug your performance issues? Check out Salma’s blog post on tracing your bad LCP score to a backend issue or watch the full workshop below.


