While there are many good tools that make development easier, the post-deployment process of discovery, investigation, and remediation is still painful, confusing, annoying, and lengthy. How do you get alerted when you introduce a bug in production? How do you estimate impact and urgency? How do you quickly get to the root cause of the issue? And when you submit a fix, how do you know if it solved the problem?
Sentry helps you answer these questions while integrating with your existing workflow. With Sentry your workflow might look like this:
You write code.
You deploy that code.
There’s a bug — let’s say it’s a NullPointerException — that users start hitting post-deployment. Sentry picks up the error immediately and alerts you (or whoever is on-call) via Slack, PagerDuty, or one of many other integrations based on your notification rules.
While there are many good tools that make development easier, the post-deployment process of discovery, investigation, and remediation is still painful, confusing, annoying, and lengthy.
This notification takes you to a dashboard that gives you the necessary context to quickly triage the problem — frequency, user impact, which part of the code is affected, and which team member is a likely owner for the issue. Then it shows you detailed information to help you debug, like the stack trace, stack locals, preceding events, commits that likely caused the issue, and custom data captured at the time of the error. You can also automatically start tracking the issue in your project management tool.
After identifying the problem you commit a fix to the repository. At this point, you no longer need to babysit the fix because Sentry watches commits as they go in and automatically resolves the issue when it gets deployed. If the issue returns later, it’s marked as a regression and you’re notified again.
Meanwhile, the user who encountered the error didn’t even need to send you a vague “Your site is broken!” message to help you fix the bug. Notably, though, Sentry can also offer those users a friendly way to send additional information that might help you resolve the issue even faster.
While this is the crux of the workflow, everyone has a slightly different configuration that works best for their specific environment. That’s why Sentry is built to be flexible, so you can tweak it to suit your needs.
How to get there
Step 1 — SDK integration
Sentry is a client/server architecture. You integrate Sentry’s SDK into your application and it starts sending errors to Sentry’s servers as they happen.
Depending on the language/framework, the reporting can be completely automatic or you can choose to send specific errors. For example, to automatically report all uncaught exceptions in your javascript project, you’d add this to your code:
Raven.config('<your project specfic key, called a DSN>').install()Raven.context(function () { initMyApp();});
To capture specific errors you can add:
try { // Do something that should not raise an exception} catch(e) { Raven.captureException(e)}
You can also send custom data that can be used to search and filter issues.
Once Sentry starts receiving errors, you’ll see a dashboard like this one:
Notice how errors of the same type are grouped and ordered. You can see the frequency of the error over time, and the number of users affected in a given period. The search bar allows you to filter issues by properties like frequency, age, users affected, resolution status, environment, or any other custom data that was sent with the error. These searches can be saved so you can quickly get to the filtered view at all times.
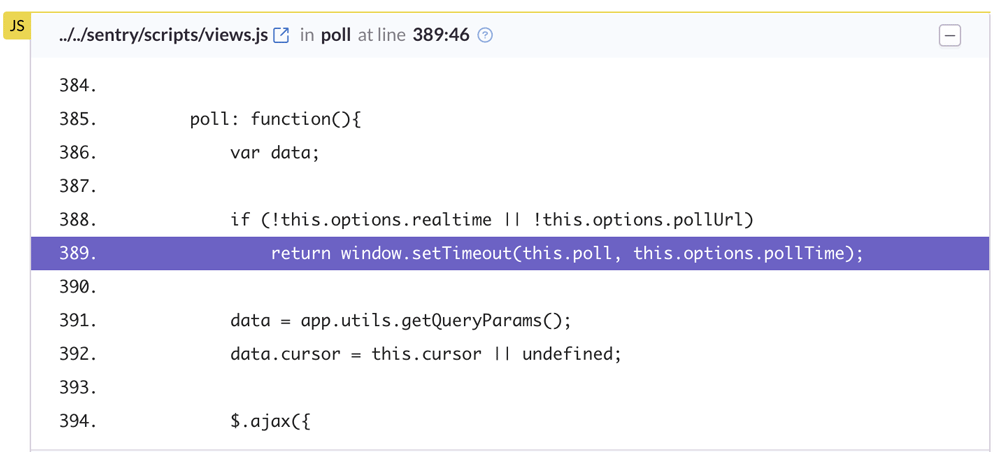
Clicking on an issue takes you to a page that helps you get to the root cause. The most important thing here is the stack trace that shows the sequence of function calls leading to the error. For languages that support it, you can also see the values of local and global variables for individual stack frames.
Next there’s a section with Breadcrumbs, a trail of events that happened prior to the error. These events are often similar to traditional logs, but also have the ability to record more rich structured data. When Sentry is integrated with web frameworks, breadcrumbs are automatically logged for events like database calls or network requests, but you can also manually instrument events of interest in your code, and they will appear in the breadcrumb trail of a subsequent issue.
Anything recorded as a tag at the time of the exception can be used as a filter. This is useful to determine which errors are coming from a specific machine, browser, release etc. You can also see the distribution of tags for an issue to get a sense of what it’s correlated with.
Step 2 — Releases
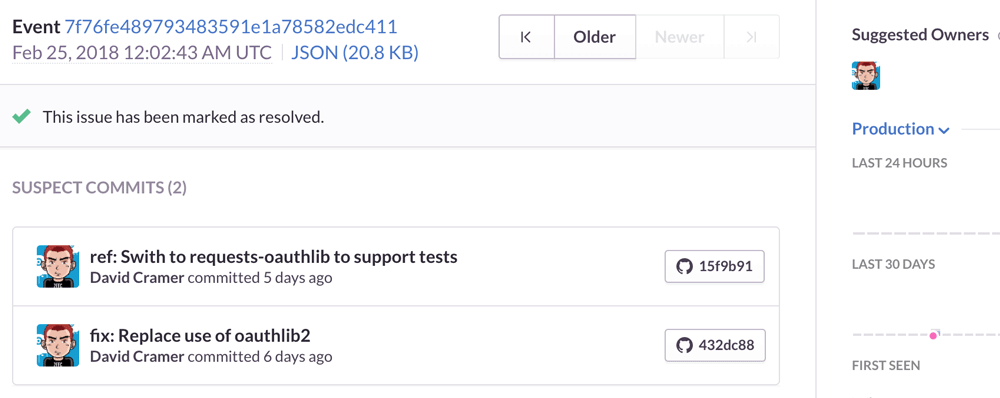
A release is a version of your code that is deployed to an environment. When you give Sentry information about your releases, Sentry can predict the commits that caused an error, as well as the developer who is likely best suited to fix it. And yes, that’s a nice way of saying “the developer who committed the error” but all developers ship bugs and there should be absolutely zero shame in it.
How?
Because Sentry can tie everything together — the commits in the release, files touched by those commits, files observed in the stack trace, and authors of those files. And the more frequently you ship releases, the more accurate the predictions become because there are fewer commits with each release.
Setting up releases is a 3-step process.
First, configure the SDK with a release tag (unique identifier for your release, like a git sha or custom package version). Now errors sent to Sentry will include the release:
Next, give Sentry access to your repository’s commit metadata by linking it from the UI (think of metadata as the output of git log, Sentry doesn’t need access to your source code).
Finally, when you deploy code, make an API call to tell Sentry which commits are associated with the release.
Another benefit of setting up releases is that you can mark an issue as “resolved in the next release” and Sentry will automatically resolve it when you deploy code next. If you’d rather avoid timing issues (for example if your fix doesn’t go into the next release), you can explicitly put FIXES <issue-id> in your commit message, and Sentry will resolve the issue only when that commit gets deployed, and also silence notifications until then. And if the error continues happening after deployment, the issue is marked as a regression and re-assigned to you.
Step 3 — User Feedback
It can be pretty easy to get lost in the data. We see an error has happened 100 times, but we may not make a strong enough connection to the user to truly realize the frustration they’re feeling.
With Sentry you can collect additional feedback from the user when they hit an error. This is primarily useful in situations where you might generally render a plain error page. When your backend detects an error, instead of returning a generic 500.html you return a page with Sentry’s embeddable JavaScript widget which is shown to the user. When feedback is collected, Sentry pairs it up with the original event, providing additional insight into the problem.
Step 4 — Misc
Teams and Projects in Sentry are what you’d expect — a way to group people, and a way to logically separate work. Several teams may be working on a project, and a team may be working on several projects. Teams can function as a way to notify, assign and mention a group of people.
Sentry also integrates with many popular tools so there’s less context switching and data silos. For example:
More code is shipping faster than ever, and most of it is no longer written by people. The speed is the story everyone tells. What matters more is what happens after the code ships, where software is starting to notice it is broken, understand why, and write the fix itself.
We trained and deployed a new issue grouping model that prevents 20% more duplicate issues, halves incorrect merges, and makes future model upgrades trivial.