The New APM: Actionable, Affordable, and Actually Built For Developers
The New APM: Actionable, Affordable, and Actually Built For Developers
The observability landscape - specifically your traditional Application Performance Monitoring (APM) offerings are failing modern-day developers.
These legacy tools are made for ops and infra teams to keep their infrastructure and services up and running. But when it comes to helping the people that actually write the code to find and fix latency issues, these tools - which often come with massive price tags - leave developers hunting for issues causing slowdowns. Once they find an issue, they have to sift between logs, metrics, and traces to figure out where it is in their code.
You shouldn’t need a Ph.D. in your APM tool to understand the performance of your application.
Sentry’s new approach to application performance monitoring is focused on being actionable, affordable, and is actually built for developers.
Whether it’s a slow-running query or a latent payment endpoint that’s at risk of timing out and causing sales to tank, Sentry removes the complexity and does the analysis for you, surfacing the most critical performance issues you can address immediately.
Delivering affordability at any scale
Most legacy APM tools focus on an "ingest everything" approach, resulting in high storage costs, noisy environments, and an enormous amount of telemetry data most developers will never need to analyze. If you’re going to spend six figures (or more) on a tool, it should do the heavy lifting for you, and not require you to go data spelunking to find potential issues and their root cause.
We’ve taken a different approach, building the most affordable APM solution in the market. We’re removing the noise and extracting the maximum value out of your performance data while passing the savings directly to you - resulting in more than a 20% decrease for our current high volume Sentry users' monthly transaction costs.
The TL;DR, with high volumes of data, it doesn't make sense to store everything. It’s duplicative, creates noise, and can be costly. But we also know all that data can provide the most accurate view of your application performance. With our new approach to platform affordability, the more data you send, the less we need to store to ensure a representative sample of your application performance, and the less you'll pay per event.
Behind the scenes, we’re optimizing which events need to exist in our long-term storage and search, and as you scale up, these savings become evident. More importantly, we’ll continue to capture outliers, identifying the issues you care about most based on priorities you set, like your newest release, key transactions, and dev environments - so you always have the data you need for further analysis and troubleshooting.
Join the discussion here, as we’ve only touched the surface of how this technology will impact Sentry’s current and future products.
To take advantage of these new pricing tiers, head to your subscription settings page to update your plan or reach out to sales@sentry.io and we’ll help you get started.
Making Performance Monitoring Actionable
To help you act on your performance data, no matter your tech stack, Sentry - the only solution to auto-detect and notify you of common performance issues - now detects more frontend, backend, and mobile performance problems. Just like the errors workflow you know and love, you'll get mobile crash reporting on performance issues that you can actually fix directly in your issues feed - without deciphering dashboards or researching span trees.
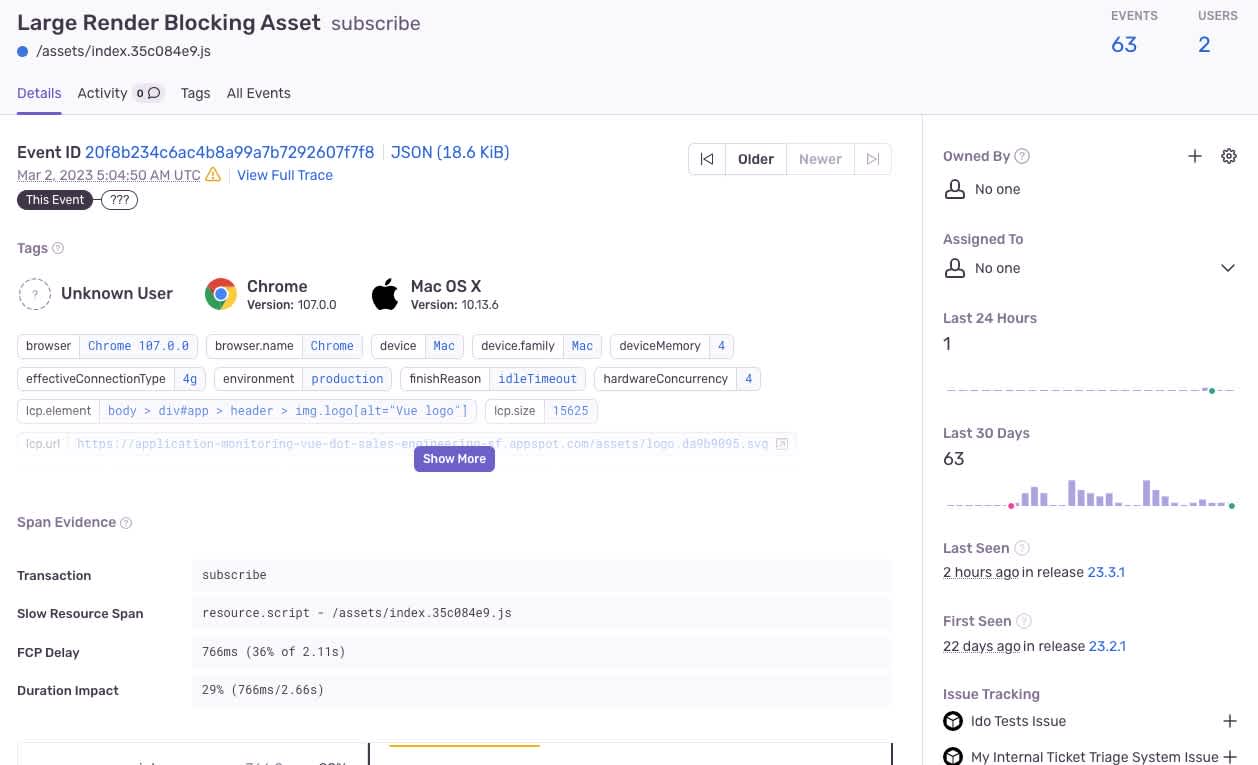
Maybe you’ve forgotten to compress an asset that's killing page load speeds, or you’ve written a SQL query with duration >1000ms that is causing your users to see the spinning pinwheel of death– these new performance issues - like the Large Render Blocking Asset, the Slow Database Query, and File I/O on Main Thread - will now be automatically surfaced in your issues feed for you to triage, assign, and resolve— before they impact your customer or bring down your application.
We couldn't live without Sentry right now. Being able to dive into the event within a performance transaction, seeing what actually happened in the database with an HTTP request, that alone saves our developers hours - about a 50% increase in developer productivity - versus just getting an alert on a performance issue and trying to piece together different logs to resolve it.
-Butch Mayhew- SRE Lead, Tilled
To learn more about our new Performance Issues, check out our blog post— or if you already use Sentry Performance, log in to filter by issue.category:performance to see all of your performance issues.
While Performance Issues gives you a collapsed span tree to help zero in on where the issue is in the code, there are times when you need more context to fix the issue. With Sentry’s Session Replay, you get a video-like reproduction of a user session to see exactly what the user experienced leading up to a performance issue, helping you triage and resolve difficult-to-reproduce latency issues from days to minutes.
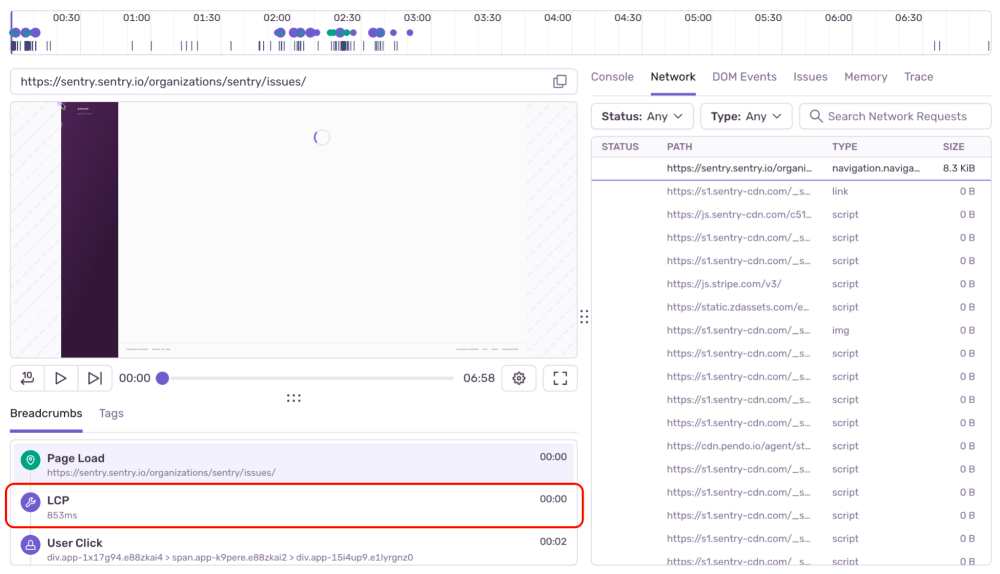
For example, you can navigate within the breadcrumbs of the replay to the specific page navigations, page loads, as well as the Largest Contentful Paint (LCP) the user experienced so you can immediately see, for example, a slow-loading image in your checkout flow and just how painful it was for your user to wait for it to load.
With Session Replay, we can visually see the jankiness of the page and pinpoint which components were impacted, saving us hours of manual debugging.
-Laszlo Gaal from lablab.ai
APM that’s actually built for developers
What makes Sentry different is how we approach performance monitoring for the developer. Our philosophy around performance is the same as errors - find the problem, prioritize, and fix it - get in and out as fast as possible.
Not to mention, it’s shockingly easy for you to get up and running quickly across all of your services. You don’t have to install and maintain complex agents or hire professional services to support months-long projects to get set up. It’s just five lines of code, you can add yourself, and you’ll start seeing errors and performance issues in minutes.
Coupled with our best-in-class error monitoring in a single platform, you can easily trace issues from the frontend to backend while leveraging deep integrations with the tools you use everyday, like GitHub, Slack, and Jira - getting the right issues to the right person at the right time.
Last, as an open source company, we're committed to the community of developers maintaining and building in the open.
We continue to invest in projects and build integrations with companies that do the same. The latest example of this is our support for OpenTelemetry (OTel), where developers with OTel instrumented applications can now use our modern APM to make their observability data actionable.
With support now generally available for Golang, Node.js, Python, Ruby, and Java, Sentry will capture errors and combine it with your OTel tracing data to alert you and track back to exactly where the problem is in your code. No more sifting through data or going between tools - just see the answers you need to get to the fix faster.
Redefining the Future of APM
Over the next few months and beyond we’ll continue to focus on making it as painless as possible for developers to see critical performance issues and solve what’s urgent faster.
As you try out Sentry’s performance we want to hear from you. Reach out in Discord, GitHub, or email us directly at performance@sentry.io to share your experience and feedback.
If you want to learn more about what we’re up to next or how other customers use Sentry’s APM, register for our upcoming workshop with customer Tilled and our Director of Engineering who helped build Sentry’s application monitoring, Adam Mckerlie.
And if you’re new to Sentry, you can try it for free today or request a demo to get started.


