Stack Trace Line Numbers for Unity Events
Stack Trace Line Numbers for Unity EventsIn 2018 we launched the Sentry Unity SDK, but at the time, we couldn’t crack how to display stack trace line numbers for C# exceptions with IL2CPP scripting backend. And until a recent release of Unity, we thought it wasn’t possible. But here at Sentry we often do the impossible… or at least the improbable. Like adding features to our JavaScript SDK while making it smaller at the same time.
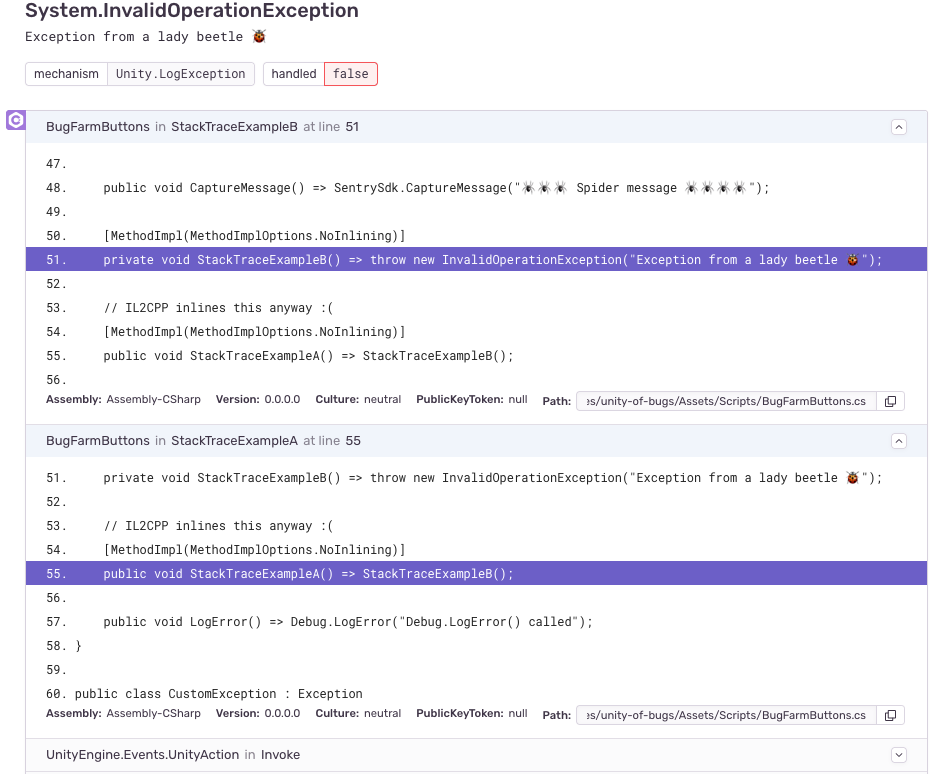
After a couple of months of (reverse-)engineering, we found a way. Sentry is now the only platform to provide stack trace line numbers for Unity SDK version 2020.3 onwards. We finally have full-fidelity traces for Unity errors. You no longer have to spend time searching for the line the exception came from, it's all in the stack trace. It comes complete with the C# file, line and code snippets, and all the other bells and whistles Sentry offers.
But Wait…
Configuring up the Sentry Unity SDK got a smidge easier. Watch the video below to learn how to install the Sentry package in your Unity editor (spoiler: you copy-paste one URL). Sentry mobile engineer, Stefan Jandl, shows you how to test sample errors and how the exceptions are captured in Sentry. He also walks through how to enable more advanced features in the Unity editor like attaching screenshots and programmatic configurations.
With Sentry’s line number integration and (one-line setup) Unity package, you’ll spend less time combing through your source code and recreating potential errors. Maybe you can use that extra time unlocking new quests on Genshin Impact or becoming the last one standing in the new season of Fall Guys.


