Sentry’s Android Gradle Plugin Updated with Room Support and More
Sentry’s Android Gradle Plugin Updated with Room Support and More
Monitoring performance is a critical part of software development. We just released version 3.0.0 of our Sentry Android Gradle plugin, which brings a handful of auto-instrumentation capabilities to Android developers, featuring Room and SQLite queries performance, File I/O operations performance, and more.
Sentry’s Performance Monitoring
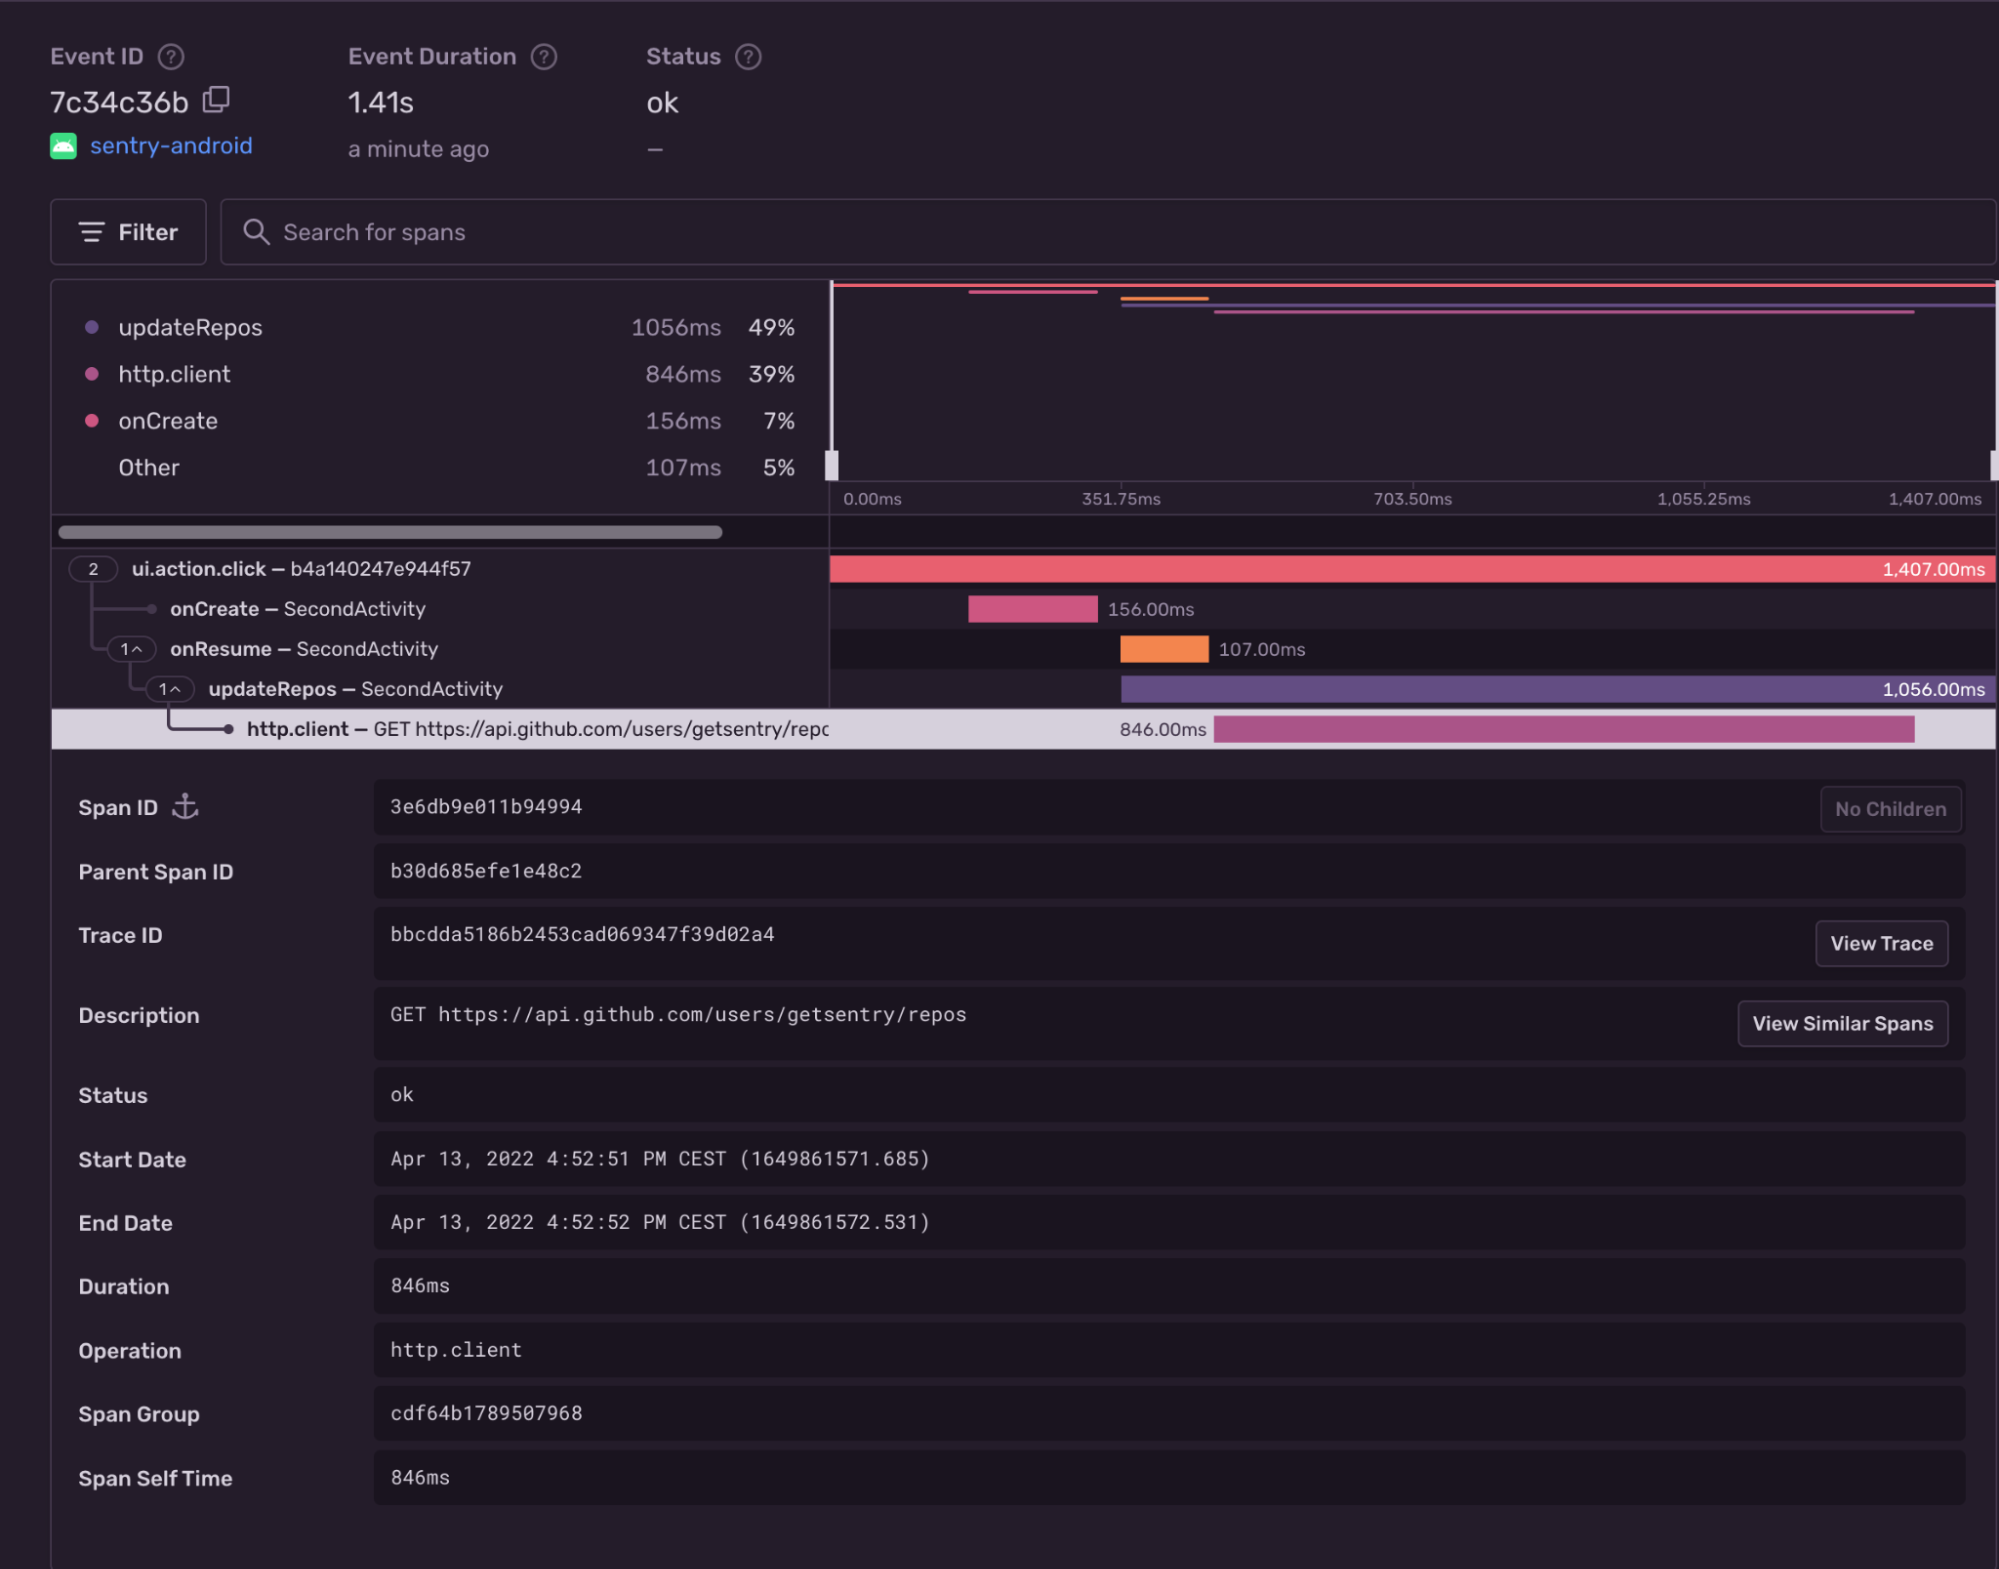
So far, the Android SDK has been providing automated instrumentation for Activities, Fragments rendering, and outgoing HTTP requests. These integrations automatically create transactions and spans, which give a bird’s eye view of your application’s performance, helping you spot potential latency issues:
While this already is a lot of useful information, we were still missing some key insights, such as persistence (database) and caching (File I/O) performance, which appear in modern mobile applications.
With the latest upgrade to our Gradle plugin, Android developers can use Sentry's Android performance monitoring tool to measure how long database queries and filesystem operations can take and determine if they need to be optimized to improve their user’s experience.
Room and SQLite auto-instrumentation
To get started with automated database queries performance measuring, make sure to use the Sentry Android Gradle plugin version 3.0.0 or above along the Sentry Android SDK:
// your app/build.gradle file
repositories {
mavenCentral()
}
plugins {
id "io.sentry.android.gradle" version "3.0.1"
}
dependencies {
implementation 'io.sentry:sentry-android:5.6.0'
}Once you install the SDK and configure the trace sample rate, it will start to automatically capture spans for database queries performed by Room by default.
Verify
Assuming you have the following (reduced) code snippet performing a database query on a Room DAO:
@Dao
abstract class TracksDao {
  @Insert(onConflict = OnConflictStrategy.REPLACE)
  abstract suspend fun insert(track: Track): Long
}

@Database(
  entities = [Track::class],
  version = 1,
  exportSchema = false
)
abstract class TracksDatabase : RoomDatabase() {
    abstract fun tracksDao(): TracksDao
}

class EditActivity : ComponentActivity() {
  private lateinit var database: TracksDatabase

  override fun onCreate(savedInstanceState: Bundle?) {
    super.onCreate(savedInstanceState)
    database = TODO("initialize database...")

    findViewById<Button>(R.id.editTrack).setOnClickListener {
      val transaction = Sentry.startTransaction(
        name = "Track Interaction",
        operation = "ui.action.edit",
        bindToScope = true
      )

      val newTrack = Track(/* fill in track values */)

      withContext(Dispatchers.IO) {
        database.tracksDao().insert(newTrack)
        transaction.finish(SpanStatus.OK)
      }
    }
  }
}
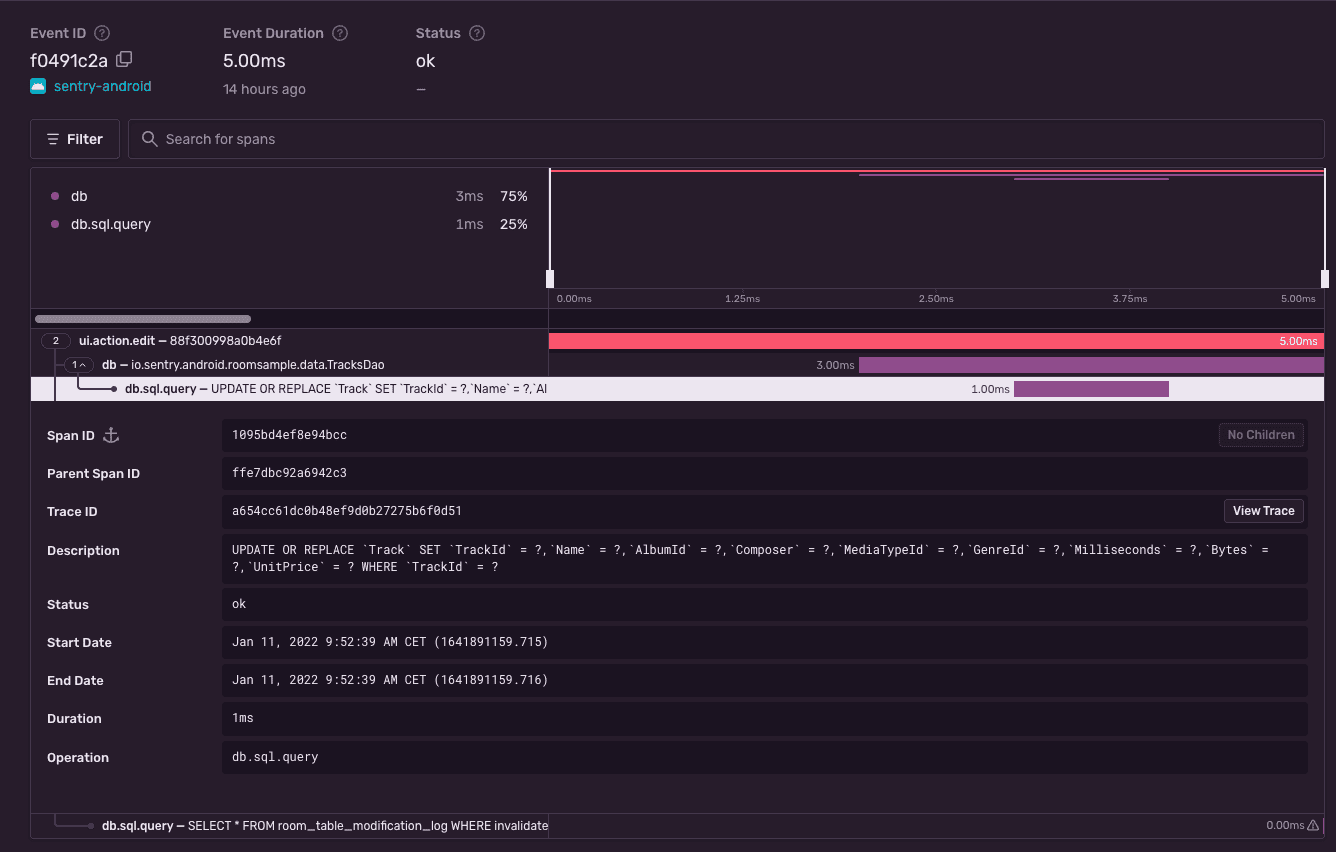
Sentry will report:
When we record DB spans, we capture the duration of the database query execution and the actual SQL query as description. This can help tremendously in identifying which database queries slow down the application.
Disable DB instrumentation
If you want to disable the database auto-instrumentation, the plugin exposes a configuration option through Gradle DSL:
sentry {
  tracingInstrumentation {
    enabled = true
    features = EnumSet.allOf(InstrumentationFeature) - InstrumentationFeature.DATABASE
  }
}
File I/O auto-instrumentation
Similarly to database auto-instrumentation, once the plugin is applied and the SDK is configured, it will start capturing spans for File I/O operations, because this integration is enabled by default as well.
Verify
Assuming you have the following (reduced) code snippet performing a file I/O operation:
class LyricsActivity : ComponentActivity() {

  override fun onCreate(savedInstanceState: Bundle?) {
    super.onCreate(savedInstanceState)
    findViewById<Button>(R.id.load_lyrics).setOnClickListener {
      val transaction = Sentry.startTransaction(
        name = "Track Interaction",
        operation = "ui.action.lyrics",
        bindToScope = true
      )

      val file = File(context.filesDir, "lyrics.txt")

      val lyricsTextView = findViewById<TextView>(R.id.lyrics)
      lyricsTextView.setText(file.readText())

      transaction.finish(SpanStatus.OK)
    }
  }
}
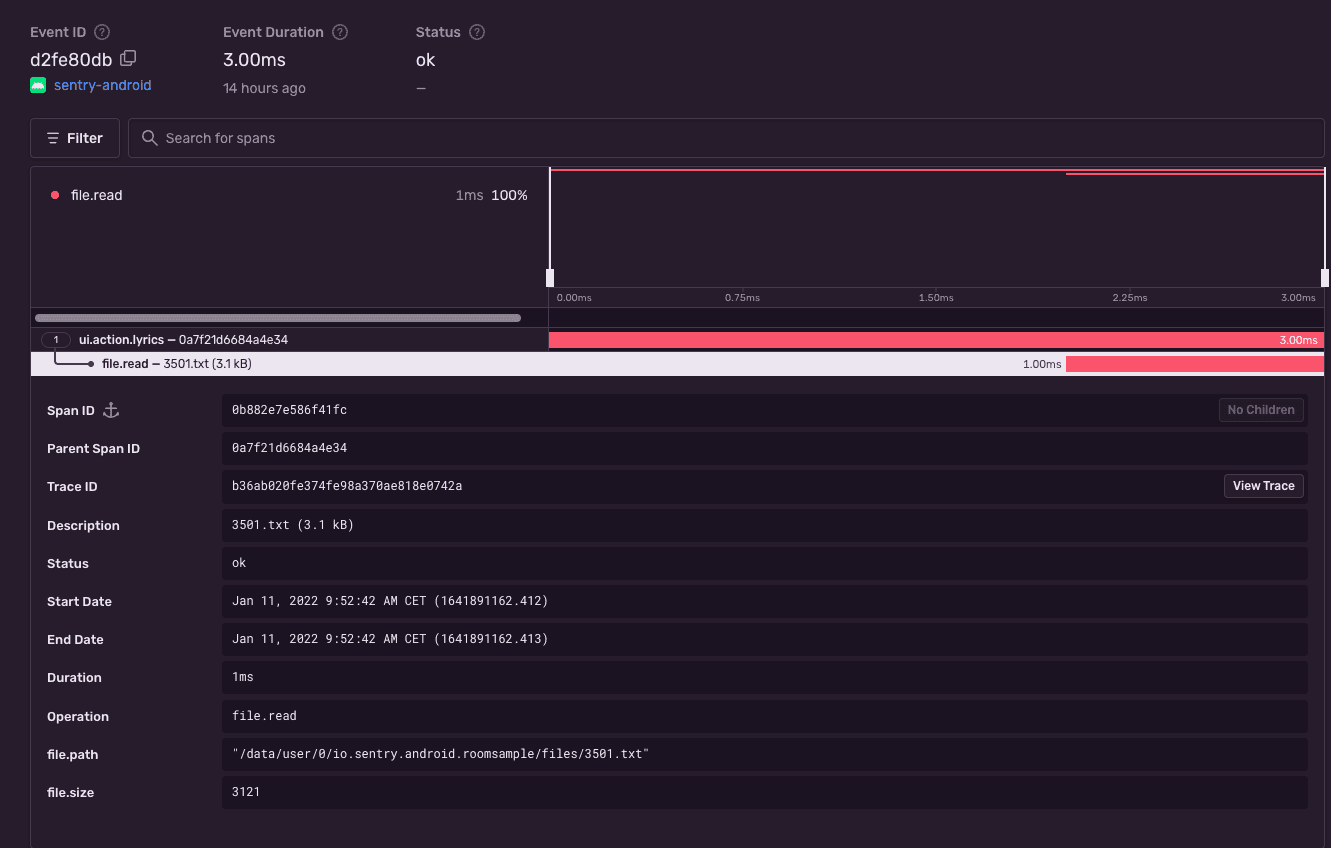
Sentry will show:
When we record File I/O spans, we capture some useful metadata; information like file absolute path, raw file size and the filename. This can help tremendously in identifying which File I/O operations slow down the application.
Disable File I/O instrumentation
If you wish to disable the File I/O auto-instrumentation, the plugin exposes a configuration option through Gradle DSL:
sentry {
  tracingInstrumentation {
    enabled = true
    features = EnumSet.allOf(InstrumentationFeature) - InstrumentationFeature.FILE_IO
  }
}
Other platforms
Most of our client SDKs already support automated performance instrumentation for database queries and file I/O operations. Check out our docs for iOS, Flutter, Java, and Xamarin for more details.
If you want to learn more about how the auto-instrumentation works under the hood, check out this article.


