Sentry .NET SDK 4.0 improvements for .NET 8
Sentry .NET SDK 4.0 improvements for .NET 8
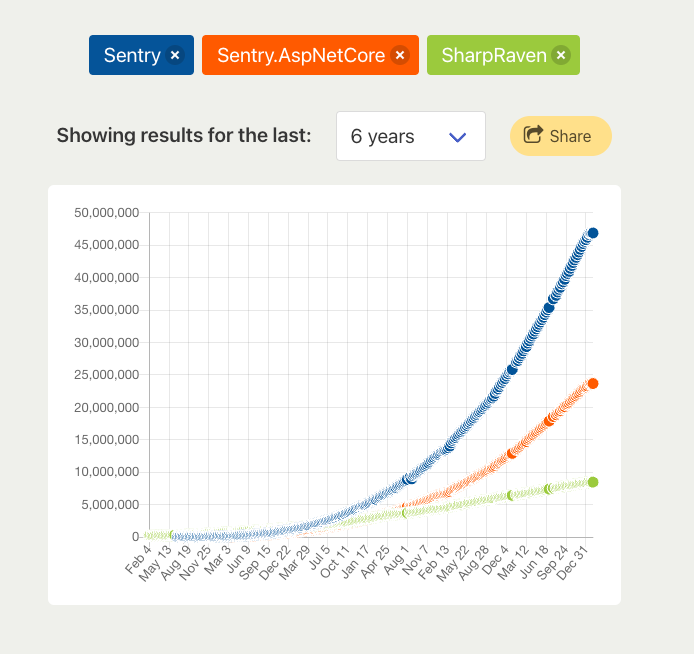
As we celebrate the 10th anniversary of Sentry’s support for the .NET ecosystem with over 150 million downloads, we’re excited to announce Sentry .NET 4.0! Building on top of .NET 8.0, this major release includes many exciting new features, including support for Profiling, Metrics, AOT and trimming, native crash reporting, Spotlight, and better .NET MAUI support.
Version 4 of the SDK is now available!
.NET 8 came with exciting new features, and we were eager to build on top of those, but our commitment to supporting older framework versions didn’t go away. The SDK still supports the .NET Framework 4.6.2 as well as .NET Standard 2.0 for those app models that are not ready to upgrade, such as folks on older Unity versions.
So let's dive into the main changes! The complete list can be found in the Sentry SDK’s changelog.
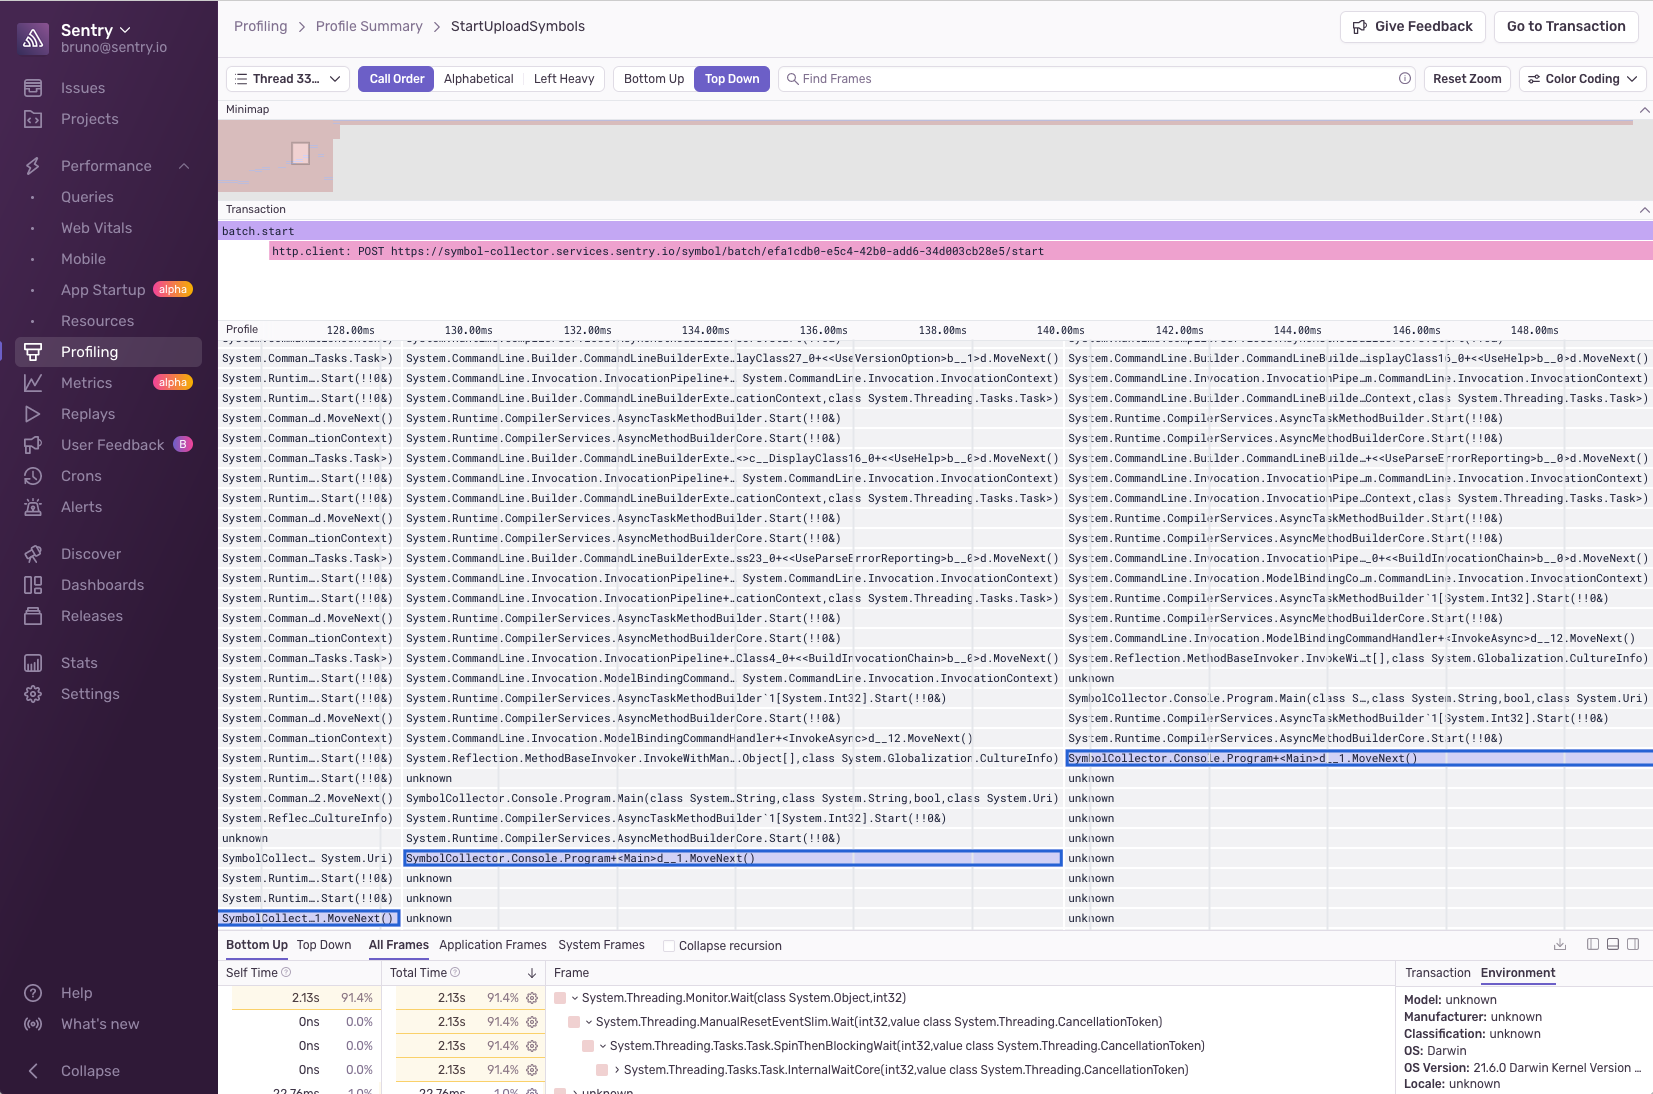
Introducing Profiling Support: Uncovering Performance Insights
What Is Profiling?
Errors are not the only thing that impact user experience. Bad performance plays a role there too. Profiling is a technique used to analyze the runtime behavior of an application, offering deep insights into performance bottlenecks and overall efficiency. Typically, this is done during development in a local environment. Sentry’s support for profiling gives you insights into your app’s performance on real user devices, where ‘how’ the code runs actually matters.
Package Available as Sentry.Profiling
Excitingly, profiling is now at your fingertips with our dedicated package, Sentry.Profiling. While profiling for .NET itself is still in preview, this feature provides a sneak peek into its capabilities, allowing you to start harnessing the power of profiling in your projects. It builds upon our existing performance product which means that applications that have already been instrumented are ready to go!
Broad Platform Support
Because your applications ship to many different platforms, the SDK aims to support all of them. That's why our profiling feature supports the latest versions of .NET 6, .NET 7, and .NET 8 and runs seamlessly on Windows, Linux, and macOS. It also supports iOS and Mac Catalyst. Whether you're working on desktop applications or Apple platforms, our profiling support has got you covered.
Desktop Profiling Support
The profiling support for Desktop is achieved through a fork of Microsoft’s PerfView. A lot of profiling capabilities exist in that repo, and after some adaptation, we were able to fit that into a Sentry.Profiling package.
Synchronous App Startup Profiling on iOS and Mac Catalyst
For iOS and Mac Catalyst developers, the profiling feature takes a step further by leveraging our native profiler. This allows for synchronous profiling of the app startup, offering unparalleled insights into the initial stages of your application's lifecycle. This is the same profiler that runs on native iOS apps and Flutter.
Native Ahead-Of-Time (AOT): Supporting Performance & Reliability
What is Ahead-Of-Time (AOT)?
With .NET 8, native AOT support has been expanded beyond console applications on Windows and Linux. It became part of the wider world of ASP.NET Core and Minimal API and also runs on macOS. AOT allows for compiling C# code into machine code ahead of time, leading to faster startup times, and reduced app size. This can be particularly useful in scenarios where startup time and resource efficiency are critical.
Bringing AOT Support to the .NET SDK
AOT compilation comes with a handful of restrictions and limitations but we’re happy to announce full support with the Sentry .NET SDK 4 and going forward. You can read more about how we dealt with Trimming, Serialization, and Reflection in this engineering post.
Expanding the Supported Platforms
Native Crash Support has now been extended to Windows, macOS, and Linux. This has previously been limited to Android, iOS, and Mac Catalyst. The SDK comes with sentry-native under the hood allowing for scope synchronization. This means that the context of your C# application persists to the native layer so your tags and breadcrumbs set in C# are included in a crash that happened in C/C++ or any other native code. Even the .NET runtime itself.
Better Stack Traces
Arguably one of the most important tools to have while debugging is the stack trace in combination with actual line numbers. Sentry offers server-side symbolication, so once you upload the PDBs, Sentry can provide C# line numbers for exceptions in Windows, Linux, and macOS on both JIT and AOT. On mobile, line numbers are available on Mono AOT for iOS and Mac Catalyst, and when compiling with Native AOT, on all platforms, including Android.
Other improvements to stack traces were recently released. Including:
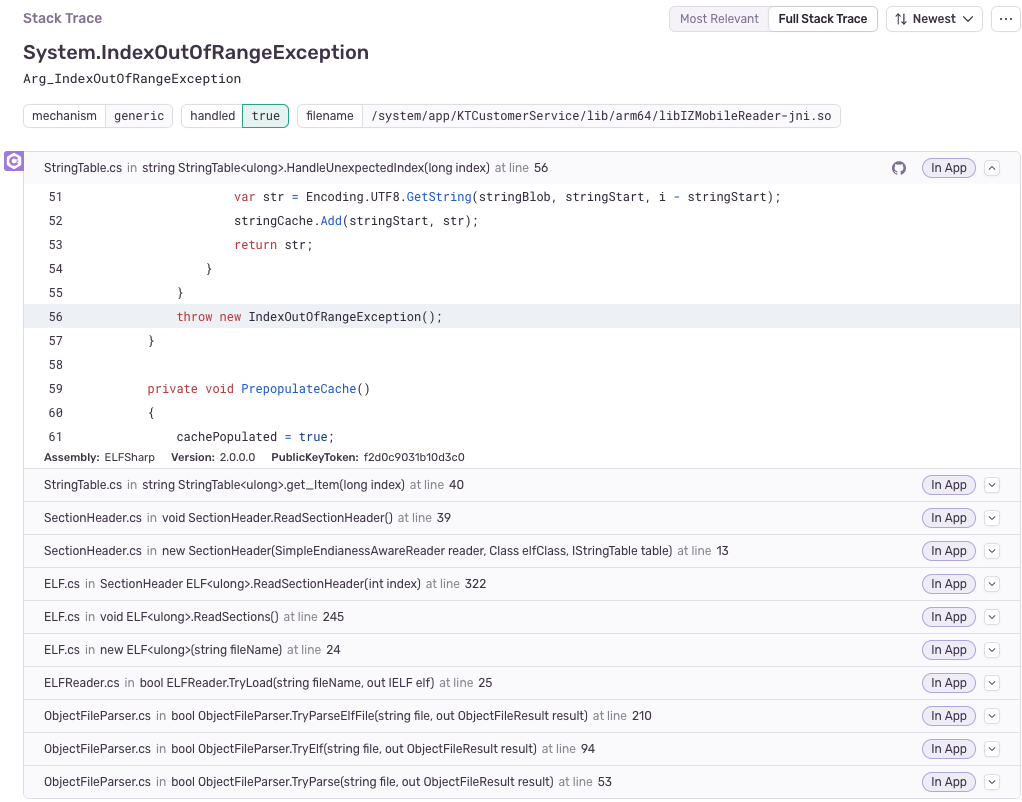
Fixes for Stack Trace Linking for C# exceptions. Note the GitHub link on the screenshot above.
Leveraging Source Link to pull .NET’s runtime code into the stack trace. You can click on the frame to expand and see the actual code.
Stack Trace linking has been updated for frames that lack context
Besides showing the .NET runtime’s code fetched through source link, Sentry is also able to show your code around the stack trace as shown in the image above.
For that, you need to upload symbols and sources. The SDK includes MSBuild tasks that automate that process for you. All you need to do is opt-in and add the required properties to your csproj.
Connecting your version control such as GitHub, GitLab or Azure Repos allows you to leverage Suspect Commits too. So besides linking to the exact line of code in your code repository, Sentry can tell you what commit possibly caused that bug! This unlocks auto-assigning beyond ownership rules defined in CODEOWNERS.
The Power of Metrics With Sentry
What Are Metrics?
Metrics allow you to monitor and visualize the data points you care about over time, like checkout conversion rate, processing time, or user sign-ups, and pinpoint and solve issues impacting user experience and app performance with correlated traces.
Diverse Metric Types
The SDK now supports various metric types, including Counters/Increment, Gauge, Distribution, Set, and Timings. These help you support different use cases and allow you to capture and analyze specific data points that are crucial for identifying performance bottlenecks.
Seamless Aggregation With Sentry
You no longer need to manage metrics independently. With our SDK, those metrics are sent to Sentry and will be aggregated there, without any additional work on your part. This not only takes away the need to handle them separately but also provides a unified platform for analyzing and understanding your systems.
Supporting Systems.Diagnostics.Metrics API
If you’re already collecting metrics via Systems.Diagnostics.Metrics, then the integration with Sentry is going to be seamless, as the SDK supports the API out of the box. The integration supports a range of instruments, including Counter, UpDownConder, ObservableCounter, ObservableUpDownCounter, Histogram, and ObservableGauge.
Accessible Through the Static API: Sentry.Metrics
Thanks to the static API collecting metrics is readily available anywhere in your project. Since this feature is currently in preview and experimental, you have to opt-in when initializing the SDK.
SentrySdk.Init(options =>
{
options.Dsn = "Your DSN";
options.ExperimentalMetrics = new ExperimentalMetricsOptions
{
EnableCodeLocations = true
};
});Top Sentry Namespace: Global Usings
Intending to make getting started with the SDK as easy and frictionless as possible, we added the Sentry namespace to Global Usings. This was a contribution from Simon Cropp back in 2022 which we had to revert because quite a few types on the root namespace could cause conflicts. Our first stab at this on the 4.0.0 major missed a few types prone to conflict, but after a couple of patches, we hope this is now worthwhile. We’ve addressed this by renaming the offending types and tried to strike a balance between ease of use and friction for folks upgrading from 3.x. The renamed types include User, Runtime, Session, Span, and Transaction. An example of a type that did not get renamed is ISpan as it is often used in conjunction with measuring performance. For the complete list of renamed types, please refer to the changelog. To opt out of Sentry’s namespace in global usings, you can set the following MSBuild prop:
<PropertyGroup>
  <SentryImplicitUsings>false</SentryImplicitUsings>
</PropertyGroup>
Alias for Clarity
For any lingering conflicts, users have the option to alias those types in their csproj file. Additionally, the IDE will likely suggest any advanced types that have not been added to the root namespace, ensuring a smooth and hassle-free development process, while still allowing you to inspect the public API.
Spotlight - Sentry for Development
You might have heard about Spotlight by now. It’s a tool to help you see all of Sentry’s telemetry data directly in your development environment, without the need to send anything to Sentry itself. If you’re an old-guard .NET developer, you might recall ELMAH or Glimpse and there are some similarities there. This new release of the SDK includes support for it. It’s as easy as setting one option:
options.EnableSpotlight = true;It’s supported by several different Sentry SDKs already and can connect all traces coming from not only .NET but any of those SDKs. More about Spotlight on: https://spotlightjs.com/.
Improvements to MAUI Support
We've made enhancements to our MAUI support, including two standout features that will streamline your debugging process and optimize performance.
At eM Client, we use Sentry to monitor our users' app quality. It enables us to sort out the thousands of issues reported by our users every month and prioritize the most disruptive ones. It helps us do gradual rollouts of application updates while monitoring for any potential bugs we have missed in our testing and identifying the common properties of those bugs that allow us to reproduce the issues. Last year, we started a beta test program for our mobile applications. Sentry naturally helped us on the journey since it already offers SDKs that integrate with each platform and common UI frameworks (.NET 7, Xamarin.Forms, and MAUI). With Sentry SDK v4, we are excited about the new capabilities regarding profiling and performance metrics that make it easy to diagnose application lags and slowdowns not only on the developer machines but also on the actual devices of our beta testers. Analyzing performance issues can finally be done with only a few lines of additional setup, and there's no longer any excuse for not adding this tool to every developer's arsenal.
Filip Navara, Lead Software Architect @ eM Client
A Picture Says More Than a Thousand Logs
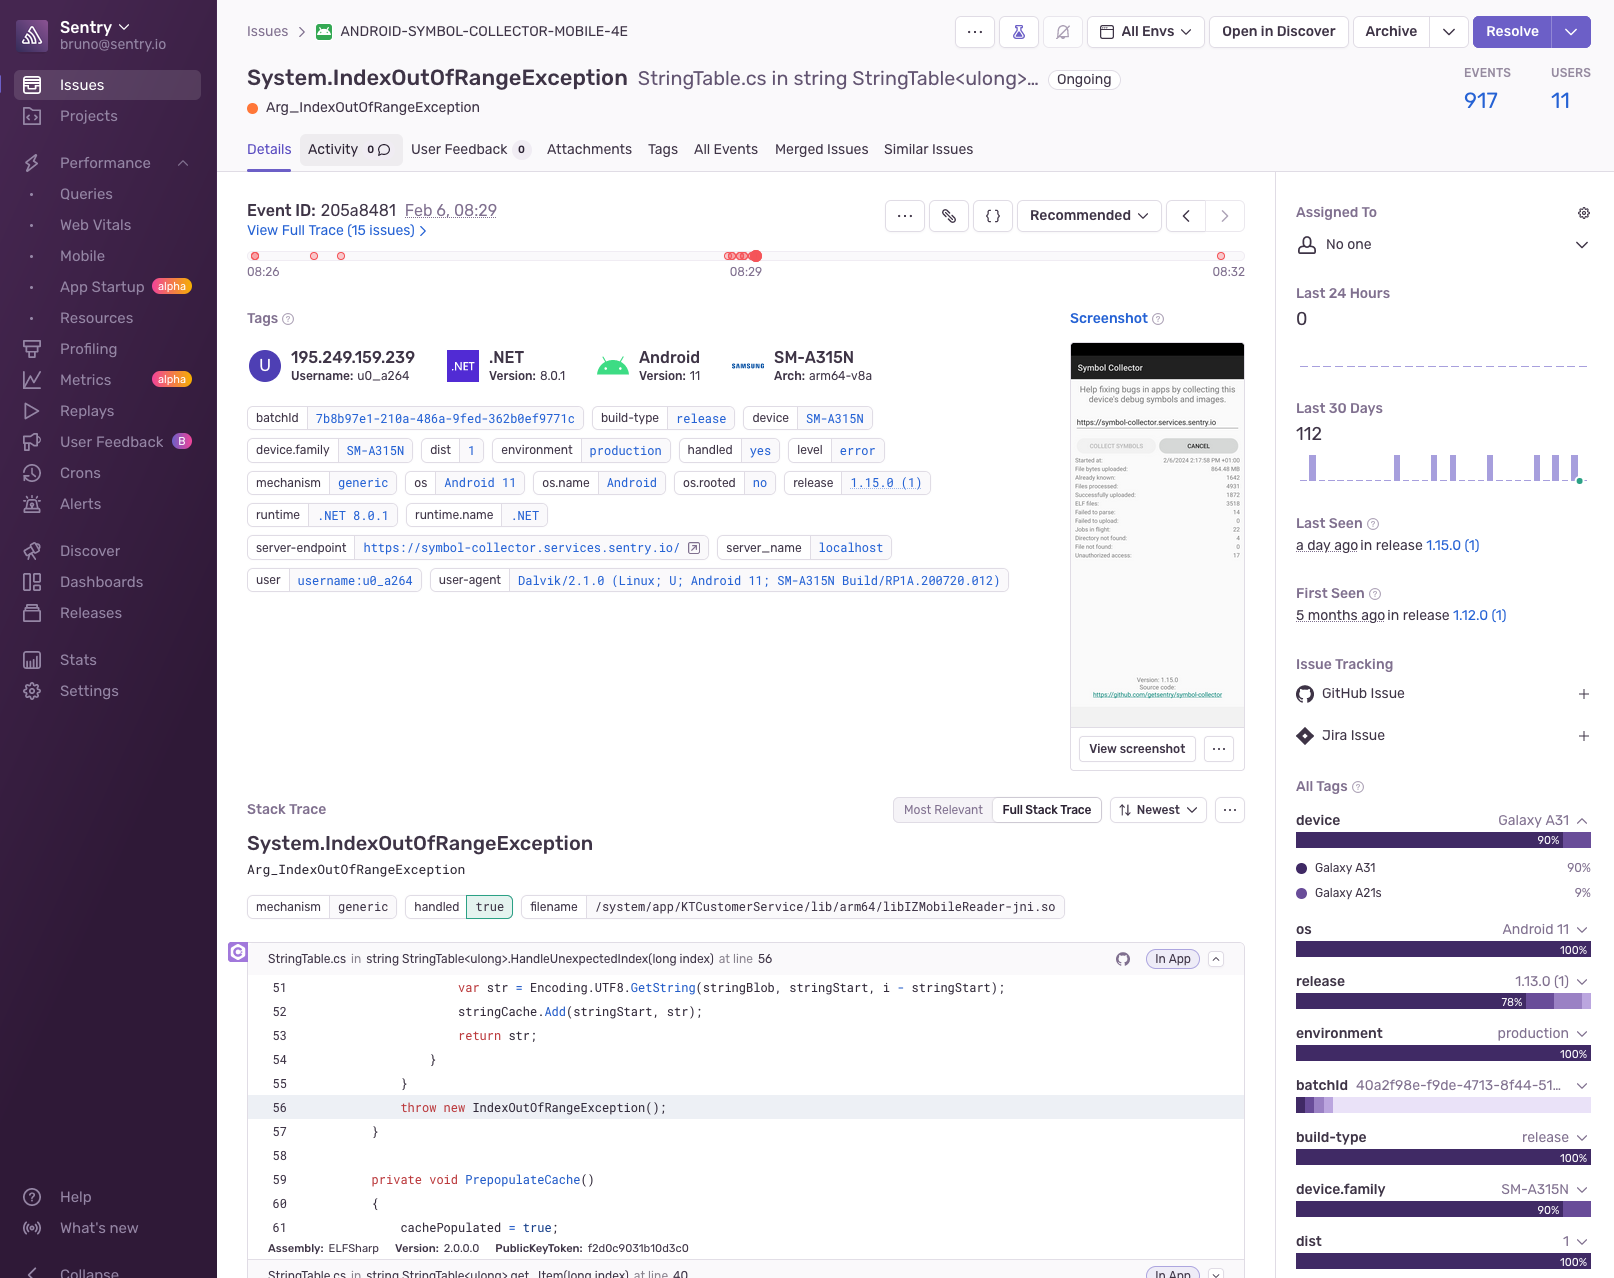
Sentry for .NET MAUI is already ahead of our Xamarin support, by offering line numbers on exceptions when you upload PDBs and much more. But one thing it was missing was Screenshot support, which Sentry Xamarin SDK offered for a long time. Now, if you opt-in, screenshots automatically get captured when errors occur. This visual snapshot provides invaluable context for debugging, allowing you to pinpoint issues more efficiently.
Performance
Additionally, we've implemented performance improvements that reduce memory usage, ensuring your MAUI applications run smoothly and efficiently. These enhancements underscore our commitment to providing the best possible development experience for our MAUI community.
Android and iOS
Specifically on Android and iOS, we received community contributions to attach LogCat logs to Sentry events by kanadaj, as well as capturing failed HTTP requests done in the native iOS layer, by carmichaelalonso.
On the topic of community contributions here are some other PRs worth mentioning:
Ignore UnobservedTaskException QUIC exceptions #2894 by lif0
And thanks for unblocking us through:
A special thanks to vaind and jamescrosswell for their significant contributions to this milestone.
What’s Next for Sentry?
We have a lot more planned out for the next releases, including continuous improvements to our OpenTelemetry integration, reporting Blocking calls on async workflows, connecting DB queries to the exact line of code, for .NET MAUI, View Hierarchy on errors, and if you’re waiting for Crons support, we have planned out Hangfire support too.
Are you looking for support for other frameworks? Let us know by creating a ticket on GitHub, or come chat with us on Discord.


