Sentry’s Seer Agent lets you ask any questions about your data in Sentry, dive deep into that data, and fix issues faster.
One of its particularly cool abilities is letting you ask questions directly about what you’re looking at in Sentry. Questions like “What’s causing that latency spike?” or “What is the customer and region breakdown for this error?”
To answer these kinds of questions, the agent must see and understand what you are seeing inside Sentry at that moment. Getting that context right turns out to matter a lot: not just for answer quality, but for cost, conversation length, and the range of things the agent can eventually do on your behalf.
The straightforward approach: ASCII snapshots
Until recently, Seer understood the current page by taking what’s essentially a screenshot rendered in text by scraping the DOM elements. It captures a character-by-character ASCII grid of everything visible on screen. It’s crude, but it works. The agent can look at that grid and infer what’s on the page, the same way a person could squint at a pixelated image and recognize rough shapes.
But this approach has three compounding problems.
Token cost. The ASCII grid is large. A single dashboard or issue feed page can consume thousands of tokens on average and p95 measurements for some pages reached 50k tokens or more. Every conversation includes at least one page snapshot, and more if the user switches views mid-chat. This cost scales with how much is on screen, not how much is actually useful to the agent.
Context rot. We mainly rely on Claude Sonnet or similar models as they strike a good balance between capability and cost. They have 200k token context length by default and this is shared across the system prompt, page context, conversation history, and tool call results. As it fills up, model performance degrades: earlier turns get pushed out, the agent loses track of what was asked, and responses become less coherent.
No path to richer interactions. An ASCII grid describes what’s visible but can’t express what’s possible. There’s no structure to attach hints like “you can click ‘Edit’ to change this widget,” no way to flag which elements are interactive, and no foundation for future agentic actions where the agent could directly manipulate the page on your behalf.
Here’s what it looked like before (note: data swapped out with dummy placeholders, but you’ll get it, it was a big wall of everything, all at once):
The new approach: pages that describe themselves
Instead of ASCII screenshots, we have shifted to a structured context system that allows each page to effectively describe itself to the agent. The core shift is in who decides what the agent sees. Each UI component knows what it is, what state it’s in, and what’s worth telling the agent, and it contributes that information directly.
A few principles guide the design:
Semantic, not visual. The agent receives meaning, “dashboard in edit mode, 8 widgets filtered to production,” rather than characters at grid coordinates. This is cheaper to send and easier to reason over.
Composable and compact. Each component contributes its own facts bottom-up: titles, modes, filters, key values. Decoration is omitted. New pages plug in without touching anything central.
Enables more interactions. The same channel that describes the page can carry hints about what’s interactive and, eventually, instructions flowing the other way, letting Seer act on the page rather than just read it.
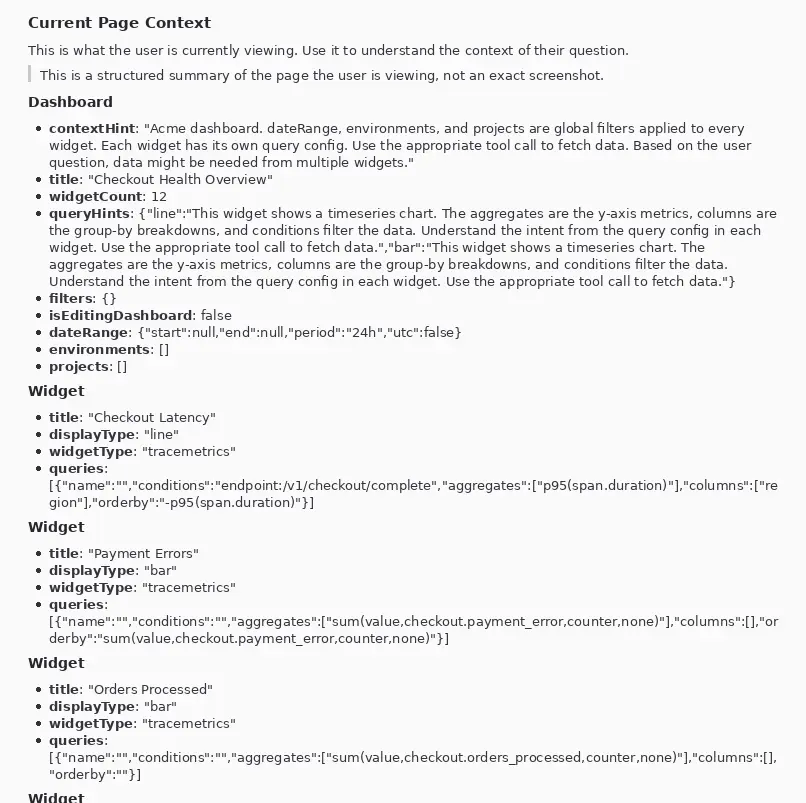
Now it looks more like this:
Under the hood, a React context provider at the root maintains a flat registry of nodes. Components opt in by wrapping themselves with a higher-order component. On mount, the wrapper registers a node and reads the nearest parent node from context to establish the hierarchy. The nesting comes for free from React’s component tree: a widget rendered inside a dashboard automatically becomes a child node, no manual wiring needed. Each component then uses a hook to push its own data like title, mode, active filters, key values into its node. When the agent sends a message, the flat registry is assembled into a nested tree, serialized to JSON, and converted to markdown on the backend before it enters the system prompt. Components that haven’t opted in yet fall back to the ASCII snapshot.
With the old approach, we sent everything visible, whether it’s relevant or not, in a format not suited for LLMs. With the new approach, we only send useful information in a structured way that can be used to trigger targeted tool calls. The page describes itself concisely; when the agent needs more like the full rows of a table, details of a specific widget or raw data behind a chart, it fetches that on demand instead of paying for the full page context upfront.
What this looks like in practice
More context left for the actual conversation
Structured context is now live across many of Sentry’s most visited pages and the token impact, measured on those pages, is significant.
Before the change, page context consumed between 85-93% of the system prompt on average. With semantic context, that share drops to 50-80% across covered pages, and average token counts fall by a large amount depending on the page. On dashboards, tokens dropped from ~5,500 to ~1,300 on average for the page context section. On the issue detail pages, which is the most visited page, the reduction is even sharper: from ~2,100 tokens down to ~300. Keeping page context size as a smaller part of the prompt means the agent can have longer conversations without running into context compaction or context rot issues.
Same performance, less cost
Importantly, the efficiency gains don’t come at the cost of quality. Across over 14,000 runs with semantic context, we measured tool calls used per conversation and satisfaction rates measured after each conversation by using an LLM as a judge. Both satisfaction rates and average tool calls per conversation are on par with runs that rely on the prior approach. The agent makes roughly the same number of tool calls to fetch data and arrives at that point having consumed far fewer tokens to understand the page.
Where we are and what’s coming
The pattern is now live across 24 of Sentry’s most visited pages, including Dashboards, Issues, Explore, Traces, Logs, Replays, Performance, and more. Each page was a self-contained addition with no central changes required, which is exactly how the composable architecture was meant to pay off.
The first agent action built on top of this infrastructure is also ready: Seer can now create and update dashboards on your behalf. You can describe what you want to see (e.g. “a dashboard showing p95 latency by endpoint over the last 7 days alongside error rate”) and the agent produces a fully configured dashboard with the right layout, queries, and widget types. Other teams are working on providing the agent semantic context and exploring options to have the agent interact with their page and take actions in the UI; watch for more built on this within Sentry in the months ahead!
Thanks to Jeremy Stanley and Jonas Badalic for guiding and helping throughout this effort.
The back/forward cache is one of the most impactful performance features on the web and one of the least observable, because success looks like silence. Here's how we made it measurable.
How we built zero-config Agent Tracing for Laravel AI during Agent Hackweek, from AI-generated defensive code to matching LLM calls with HTTP requests.