Sentry Profiling now supports Browser Javascript, React Native, and Ruby
Sentry Profiling now supports Browser Javascript, React Native, and Ruby
Profiling is an essential component of a developer’s toolkit for identifying and addressing the thorniest performance bottlenecks. Whether you’re a backend developer looking to cut down cloud infrastructure costs, a frontend developer trying to speed up page load times, or a mobile app developer working to ensure smooth scrolling for users, Sentry Profiling pinpoints hot code paths in your production environment, so you can identify and optimize the slowest parts of your code. By providing code-level context for what’s causing a performance issue, Profiling makes performance monitoring more actionable.
With the latest Profiling release, we offer a few shortcuts to make it even faster to troubleshoot a performance issue or regression. We’ve also expanded our Profiling SDK support to cover frontend, backend, and mobile applications and enhance your organization’s full stack observability.
New platform support, including Profiling for Browser JavaScript
Ruby, JavaScript, and React Native SDK users can now use Sentry Profiling in Beta. This broadens our total platform coverage to:
Python, PHP, Node.js, and Ruby on the backend
Browser JavaScript on the frontend
Android, iOS, and React Native for mobile applications
With Profiling, developers can find the root causes of their performance bottlenecks across their services, helping prioritize where to make code optimizations or architectural changes.
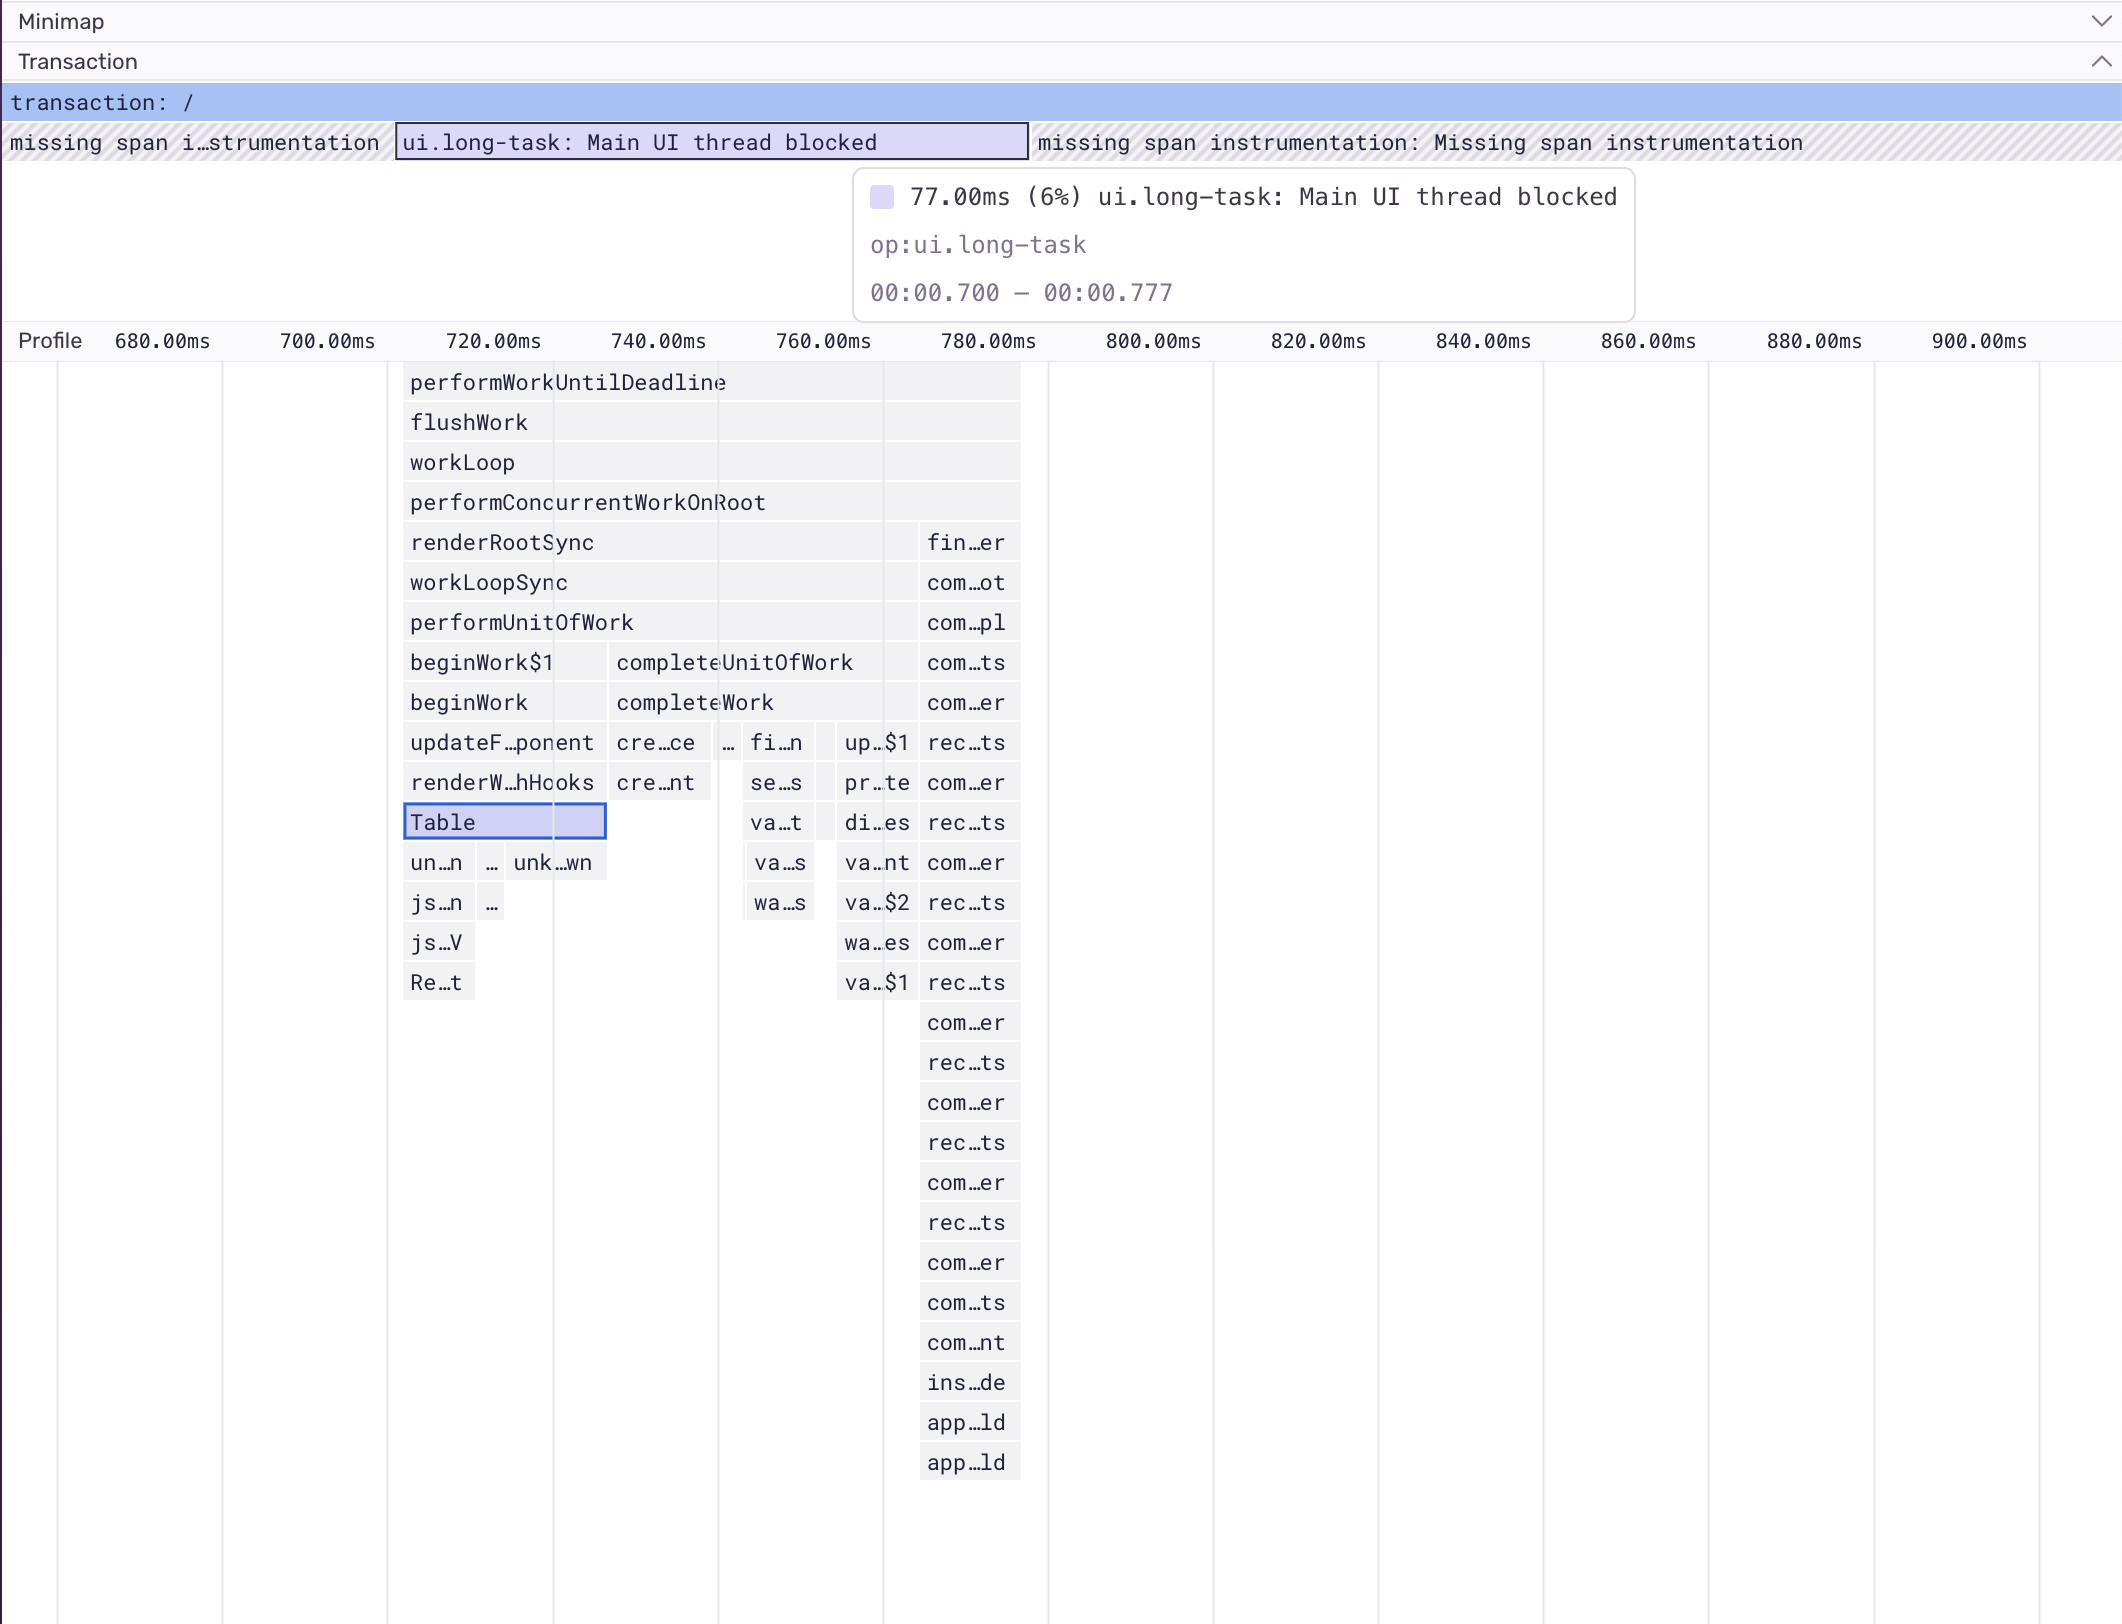
At Sentry, we integrated Browser Profiling to analyze sluggish load times for users and enhance frontend performance. The flame graph below shows a profile of an internal application fetching and rendering server data in a table in the browser window. While trouble-free in development, the request was fetching more data once it was in production, resulting in UI jank.
The flame graph above breaks down the code for the transaction span ui.longtask: Main UI thread blocked, revealing that the Table function takes a significant block of time to execute. Bottlenecks like this are common for Browser JavaScript. They can be difficult to spot but are important to fix—while developers using high-performance computers might not notice issues, end users with older machines may experience a stuttering webpage.
With Sentry Profiling, developers can examine production data to understand exactly what the end user is experiencing. In this case, the simple fix to our jank issue was to either virtualize or paginate our table to reduce the number of elements we are creating, which in turn speeds up the render cycle.
Easily find the slowest or most regressed functions in your code
A flame graph gives you exact details into your code execution, which can guide you in solving a known problem, e.g. seeing why your business-critical API endpoint is experiencing a slowdown. But if you’re not sure where to start, the two new widgets on Sentry’s Profiling page provide insights on what to optimize for immediate performance improvements.
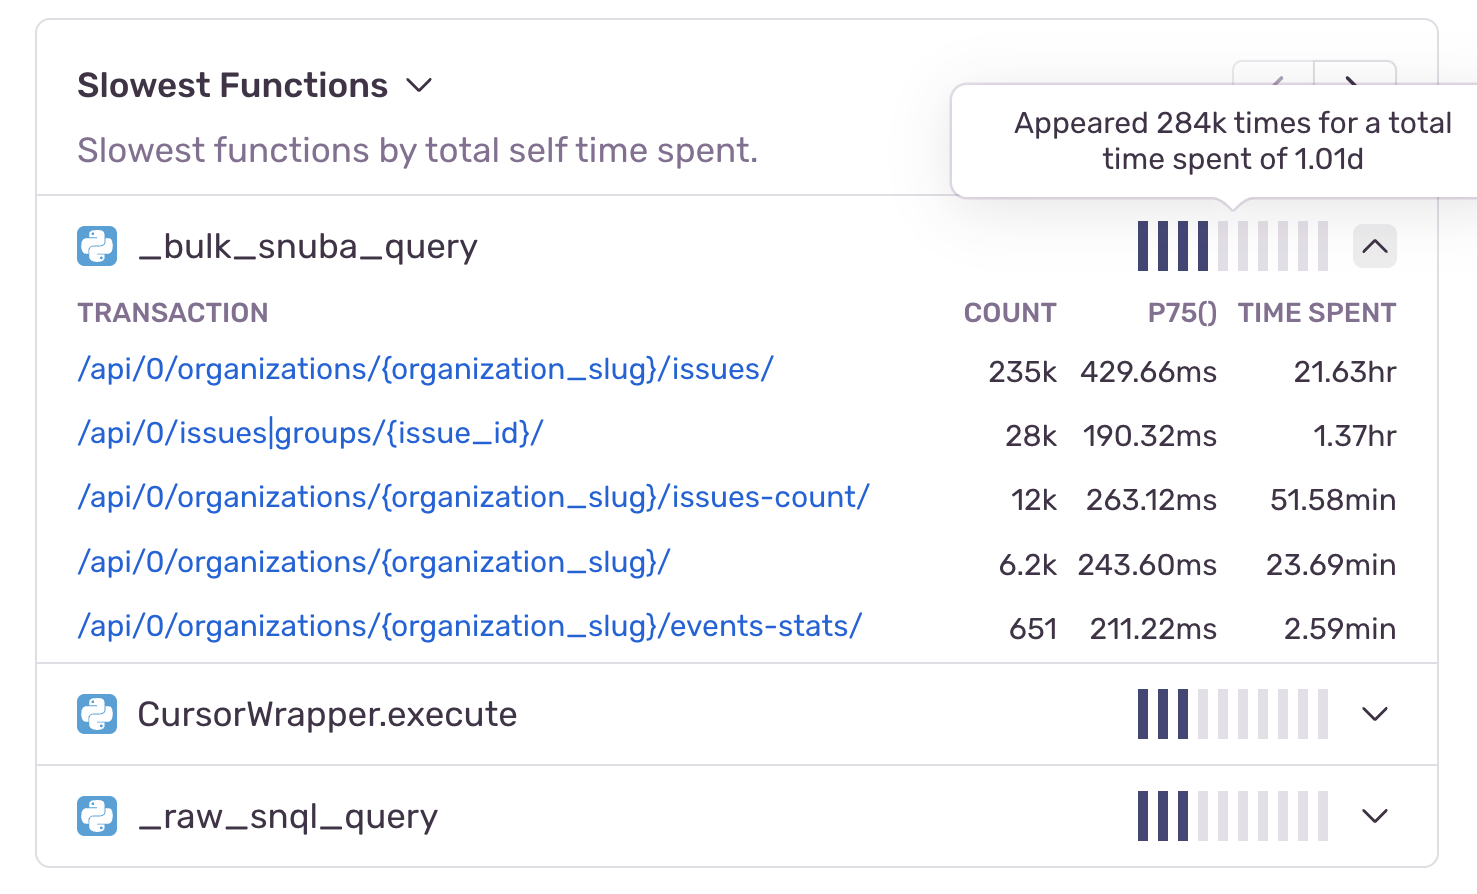
First, the new Slowest Functions widget identifies functions within your code that are consuming the most self-time in your application. Self-time refers to the amount of time it takes a function to execute, excluding other functions it calls.
This allows you to answer the question, “which functions in my codebase are the most likely performance bottlenecks?” and is an easy starting point for code optimization.
The Most Regressed (or Improved) Functions widget takes this one step further by identifying the functions in your code that have regressed or improved the most (as measured by their self-time) over a selected time period.
Our breakpoint detection algorithm automatically pinpoints the exact time at which the regression or improvement began. Furthermore, clicking on the “before” or “after” function duration takes the developer directly to sample flame graphs that can be compared to understand what may have changed. With this insight on where in the code and when a performance regression happened, you can quickly identify and correct the software release that led to the slowdown.
Start speeding up your application today
With these latest updates, Sentry Profiling lets you see where and why a performance bottleneck is occurring — so you can fix the slowest parts of your application, improve user experience, and optimize compute resources. You can gain code-level visibility into the production performance of your app, starting with slow transactions in Sentry Performance to actually finding the root cause of the slowdown with Profiling. With frontend, backend, and mobile support, Profiling complements the tracing data you receive from Performance, pointing you directly to the transactions you need to investigate to achieve faster page loads, optimize critical endpoints, and eliminate UI issues from users’ screens.
And what's next? We are building new Performance Issues to find and proactively surface function regressions to developers. Your most critical performance regressions will soon pop up in your Issues list in Sentry, so you can take action before users feel the impact from a performance degradation. Stay tuned!
To start capturing profiling data immediately, all you need to do is first set up performance monitoring (which takes just 5 lines of code) – and then just update your SDK to get started with Sentry Profiling.
To learn more about Profiling, here are some resources to start with:
FAQ page for product and pricing details
Getting-started guide to set up Profiling (by SDK)
Sentry Profiling website for general overview
What is Profiling & Why Use Profiling blog series
Identifying Performance Issues with Profiling blog for previous Profiling updates
We’d also love to hear from you on Discord or email us at profiling@sentry.io to share your thoughts and feedback.


