Sentry Profiling: Identify & Eliminate Performance Issues with Code-Level Insights
Sentry Profiling: Identify & Eliminate Performance Issues with Code-Level Insights


Users are complaining about slow load times and you’ve thrown logs, traces, and metrics — heck, the entire kitchen sink of performance monitoring — but you still can’t figure out the source of the bottleneck. Maybe you missed adding instrumentation to something in the critical path, or you’re simply testing in an environment vastly different from the ones your users are experiencing in production. Either way, getting to the root cause can be a frustrating and time-consuming experience.
We’ve built Sentry Profiling as a solution for these performance woes. Now generally available for all Python, Node.js, iOS, Android, and PHP users on our latest pricing plan, Profiling enhances Sentry Performance by pinpointing the lines of code causing a performance issue.
Sentry Profiling collects data in production on the execution time of functions as they run, then aggregates the results for a comprehensive view of your application performance in every environment. Instead of guessing at spans or writing performance tests, you can see hot code paths in your application right away to quickly catch performance bottlenecks. Plus, Sentry Profiling saves you hours of manual instrumentation — so you can build in performance as a feature from day one.
Read on to find out how Sentry Profiling can boost your Performance workflow and help you fix sluggish UI frames – and to get the scoop on the latest SDK support.
In this clickable demo, start with a slow function, then drill down to the application frames and full call tree to identify the lines of code causing the problem.
Ready to get started with Profiling? Check out our pricing page for details.
Start with a transaction, dive deep with a profile
Sentry Performance allows you to collect traces, which use transactions and spans to represent the performance of individual services and operations within those services. While Performance monitors transactions to help you identify spans that are causing slow downs, the root cause of long-running spans with many tasks can be difficult to pinpoint. Rather than breaking that large span into sub-spans and adding instrumentation, you can now use Sentry Profiling to give you the context you need.
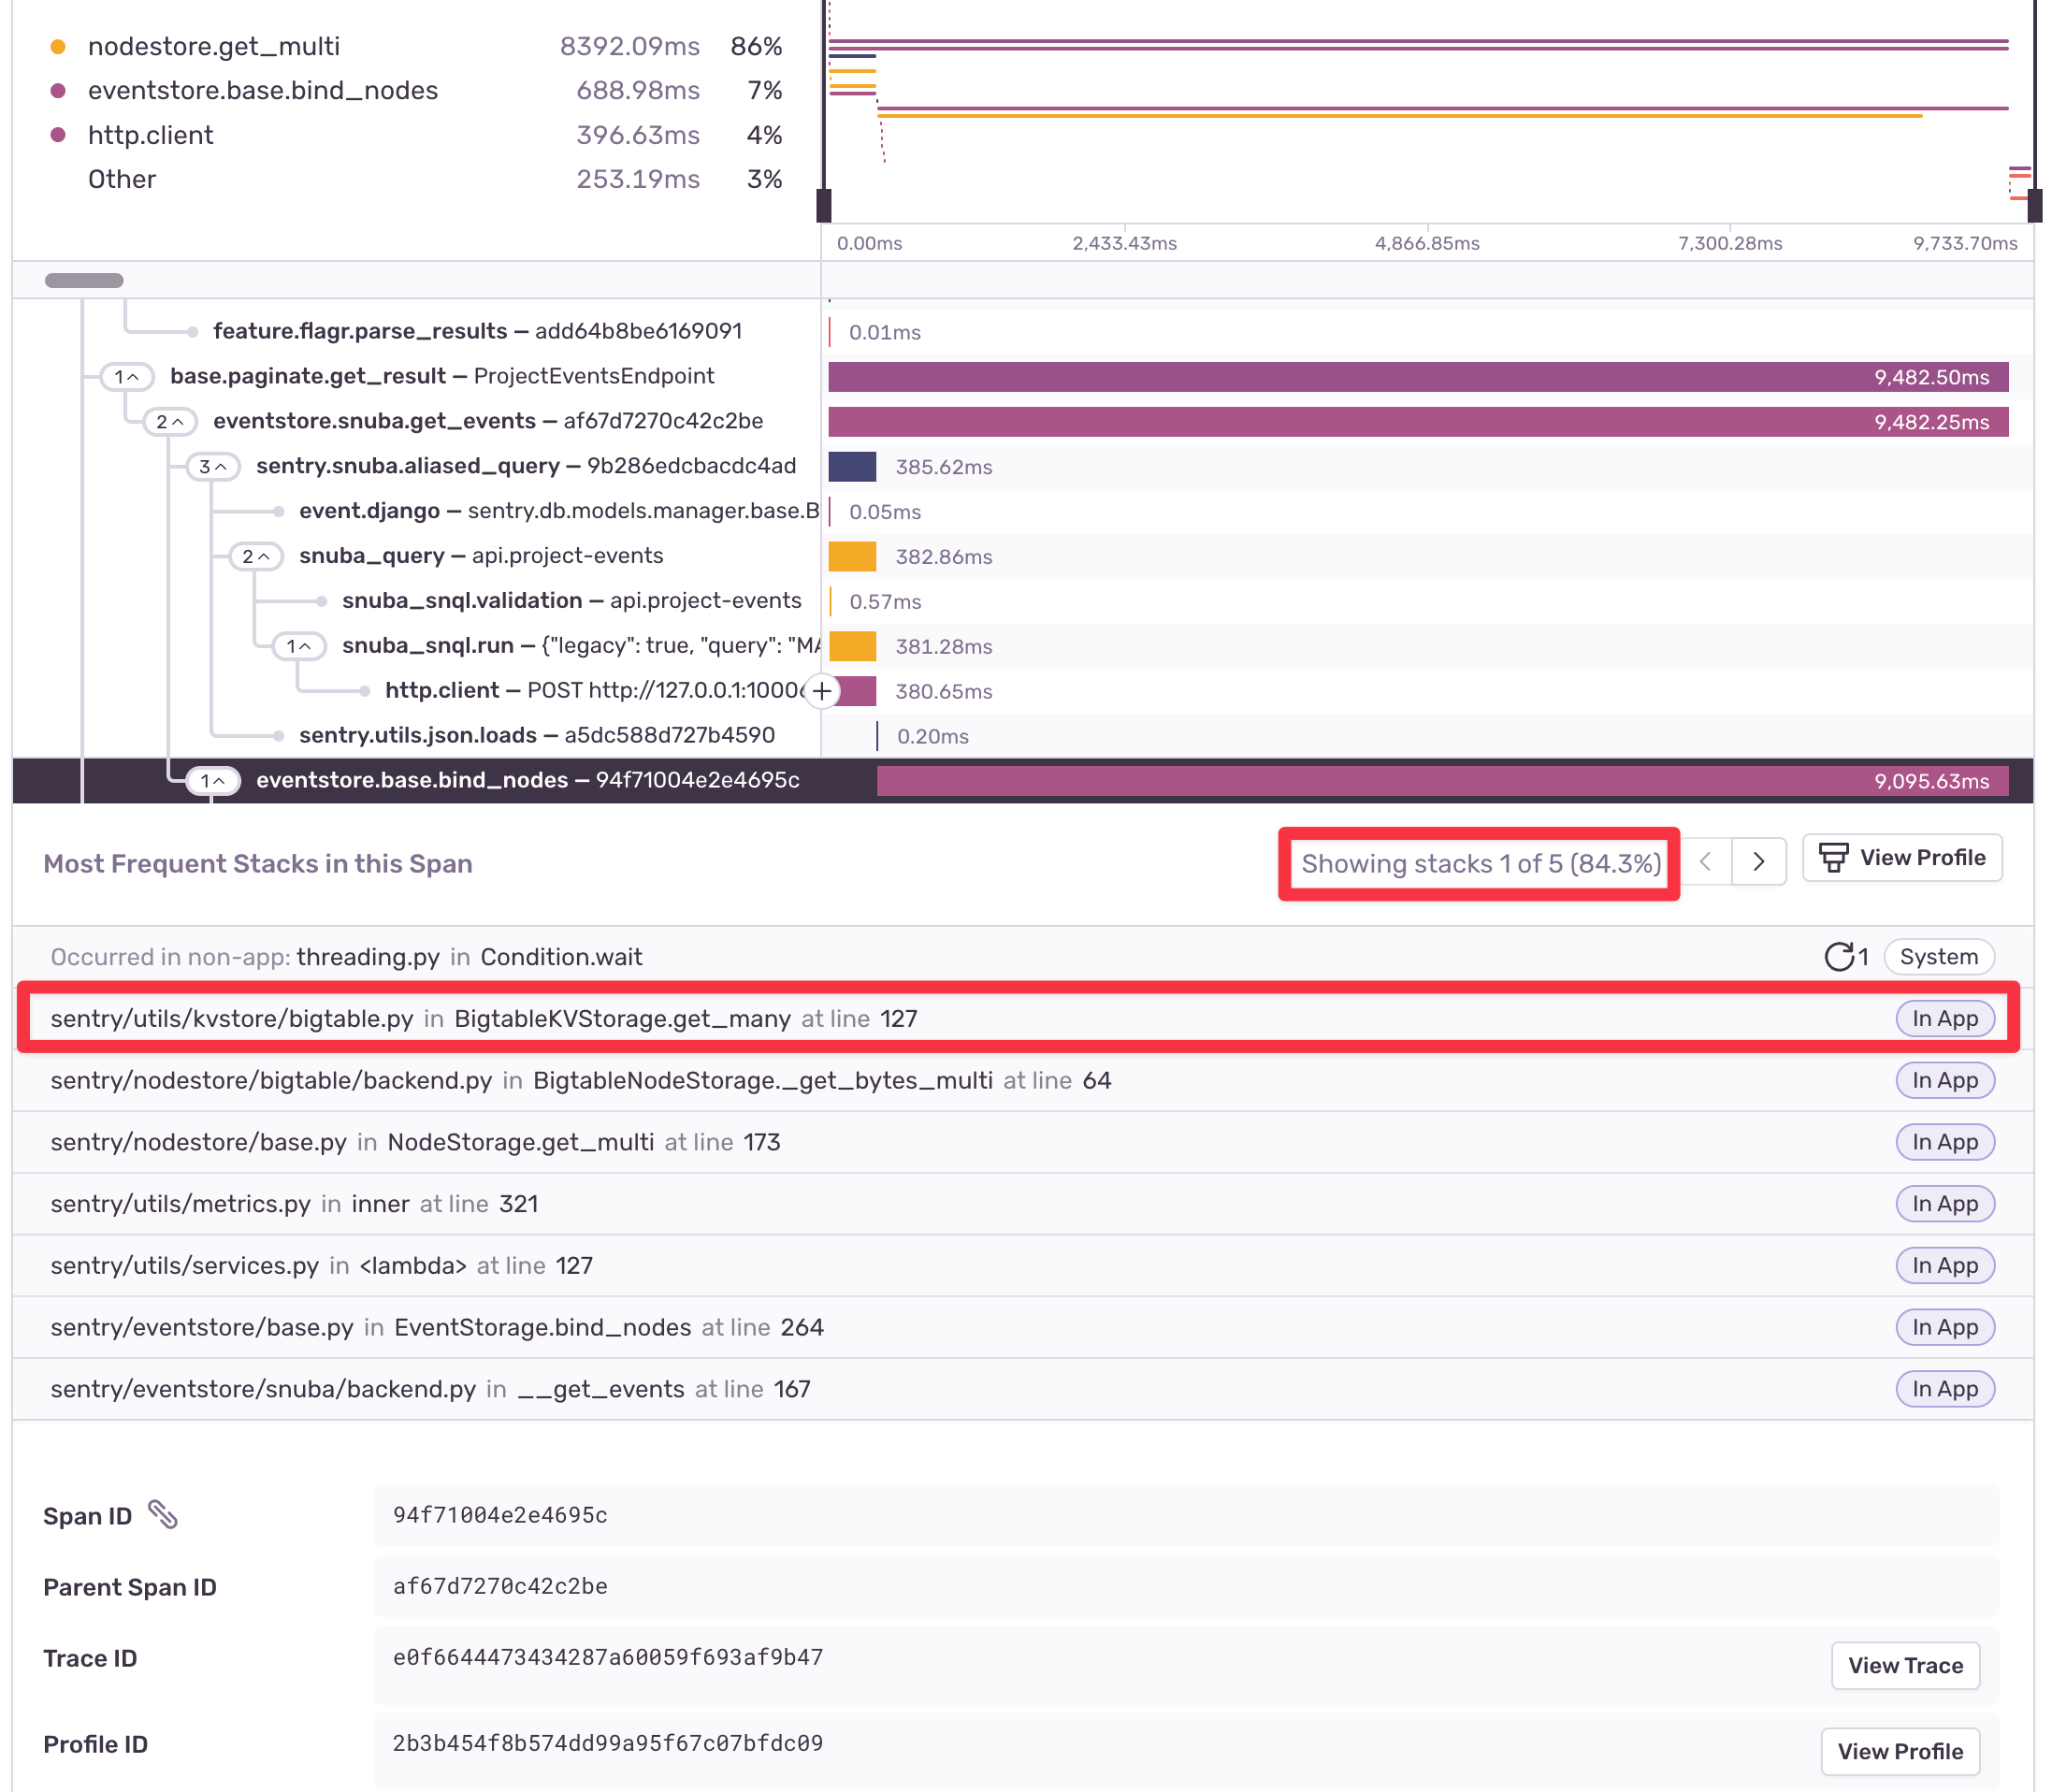
When code profiling data is available, the span details will show you exactly which call stacks occur most frequently during that span, pointing you directly to the code to optimize. In the example below, we can see that this particular call stack appears in 84.3% of samples collected, and that the topmost in-app function in the call stack is BigTableKVStorage.get_many, which executes a GCP BigTable query. Using the details provided in the call stack, we can find the exact file and line number where that function is defined.
An even more difficult-to-debug scenario is one where you are missing some spans entirely, which are represented using Missing span instrumentation markers:
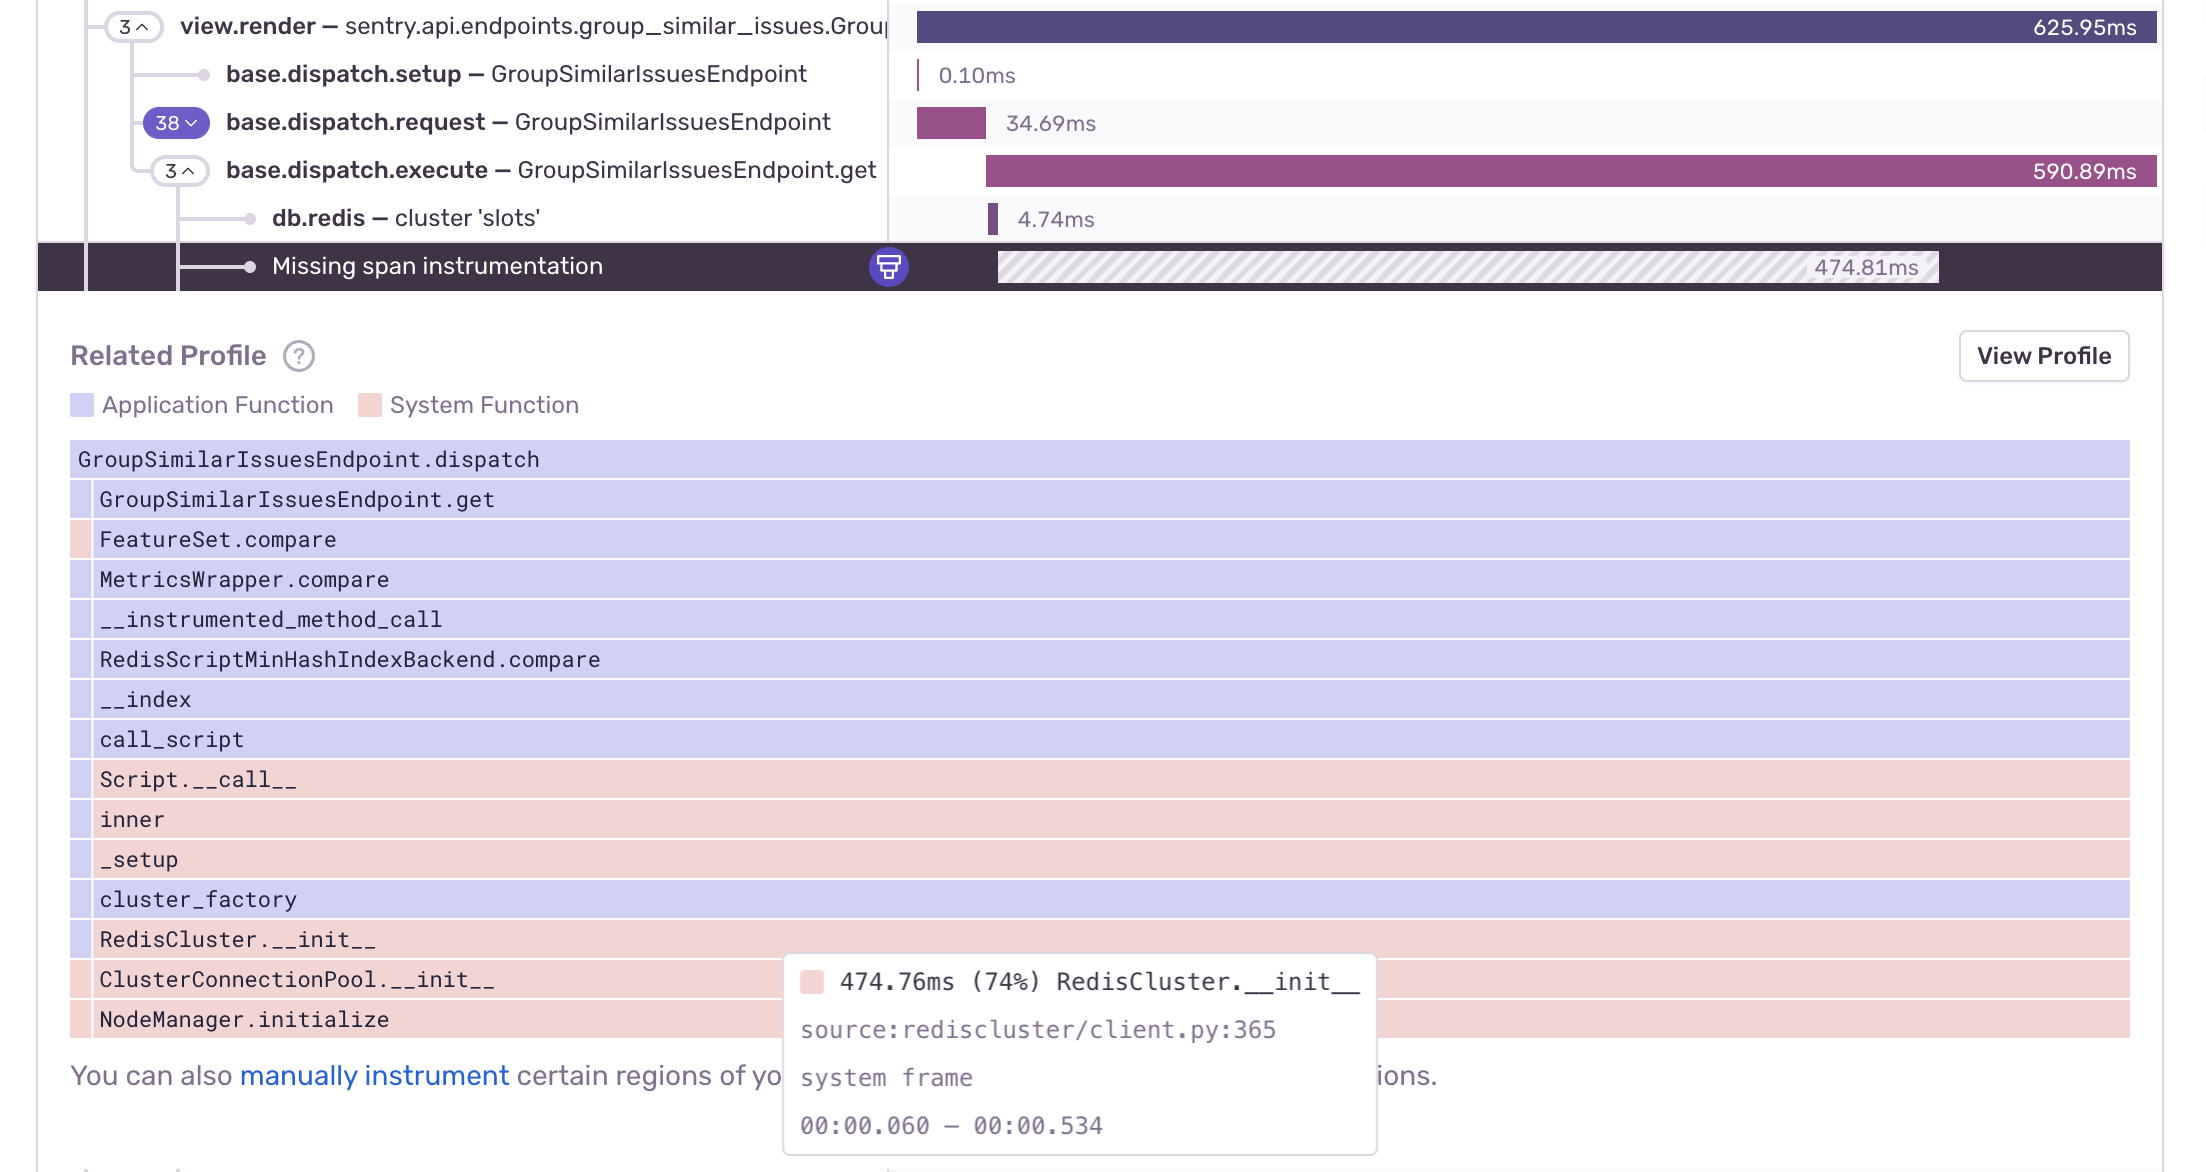
Instead of guessing where instrumentation is missing, Sentry Profiling can point you at the code executing during this time period. Not only does this show you where in your code you need to add the missing spans, oftentimes this preview is enough to find the root cause without adding any instrumentation at all. In this example, we can see that the ~474ms of missing instrumentation corresponds directly to establishing a connection to a Redis cluster.
Need even more context? One click takes you to our flame graph viewer, which renders the entire profile including data for every thread:
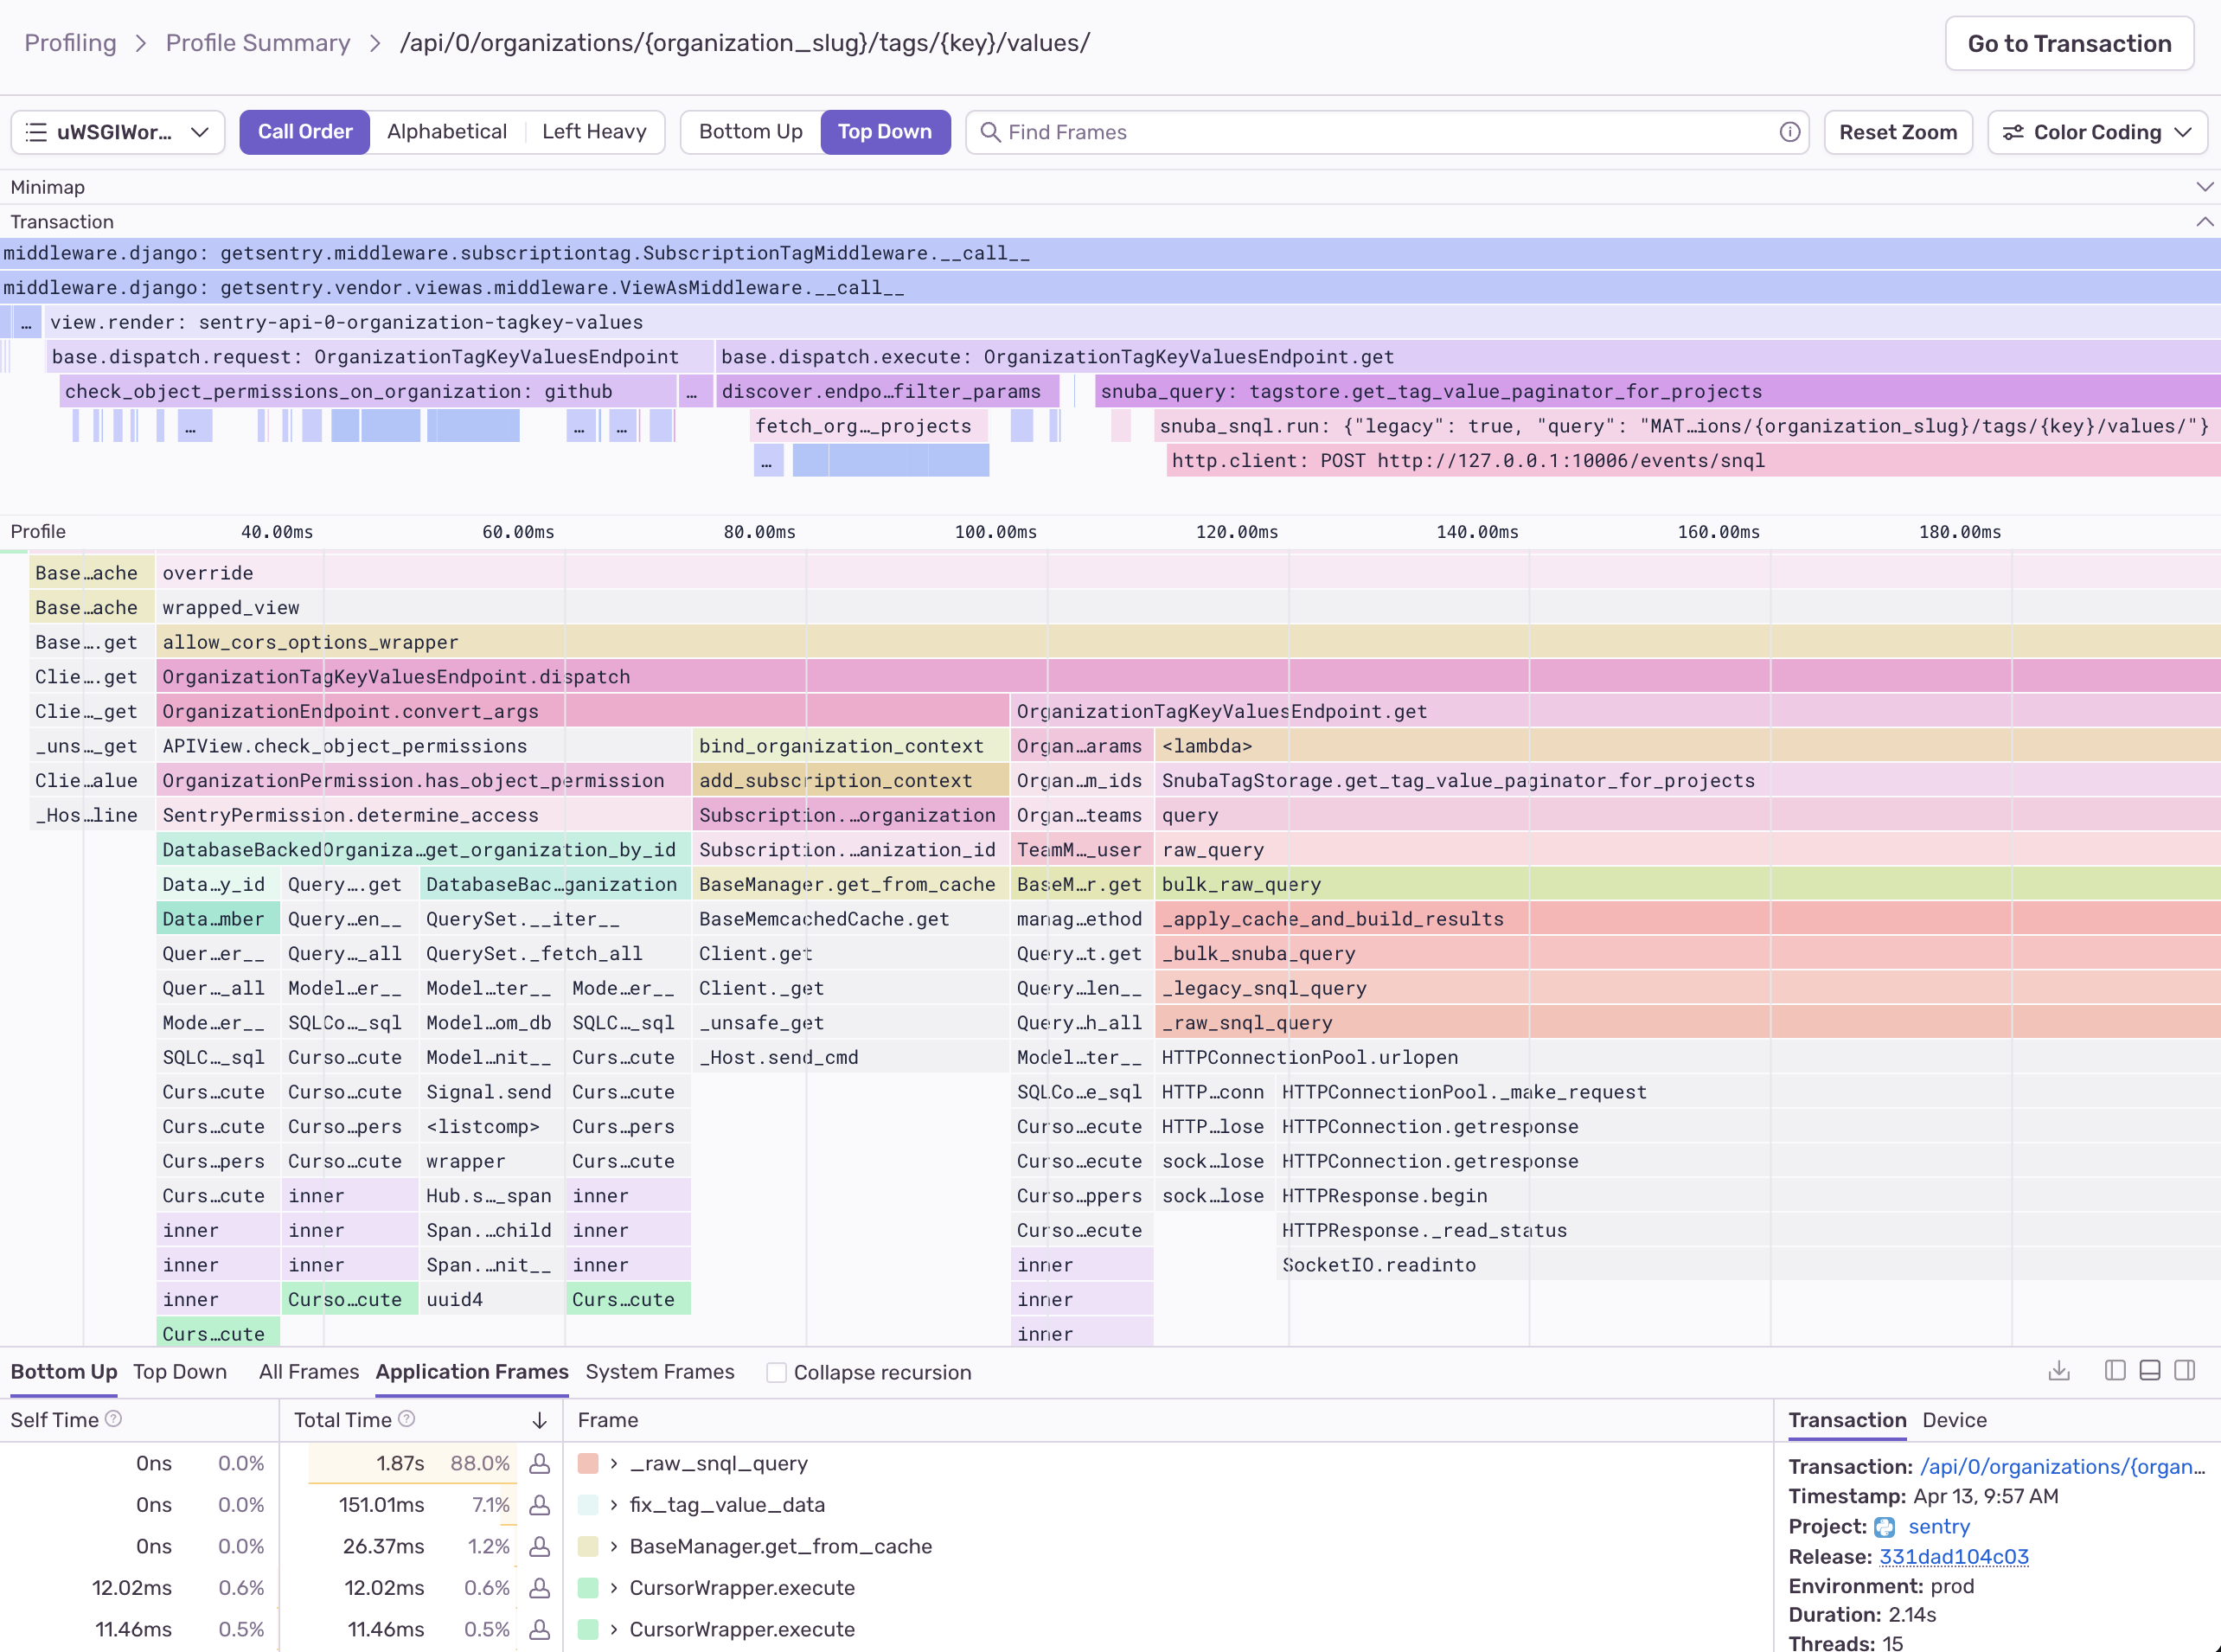
The transaction data is rendered inline with the profiling data so that you can seamlessly correlate spans with the relevant functions without having to navigate away from the profile. That said, we know there’s a lot going on here, so we wrote an entire guide on how to navigate and interpret flame graphs.
At Azos Seguros, Developer Vytor Calixto has been using Sentry Profiling to tangibly improve the performance of their customer insurance payment installment services. Diving into the profiles associated with their performance issues, Vytor used the flame graph to visually identify problematic function calls causing a slow request – and then implement a quick fix. This significantly cut down the time-to-execution of the requests.
With the flame graphs, we were able to find our slowest database requests for our customer payment services. Using Profiling, we've been able to reduce the time to execution of our requests from 1000ms down to 300ms.
— Vytor Calixto, Azos Seguros
Performance issues, supercharged with Sentry Profiling
Sentry Profiling complements other Performance features, including Performance Issues which detects common performance problems by grouping transaction data. Now with the code-level visibility provided by profiling data, we are expanding the range of issues that can be detected. Our first two new issue types to utilize profiling data are JSON Decoding on Main Thread and Image Decoding on Main Thread, supported on iOS and Android.
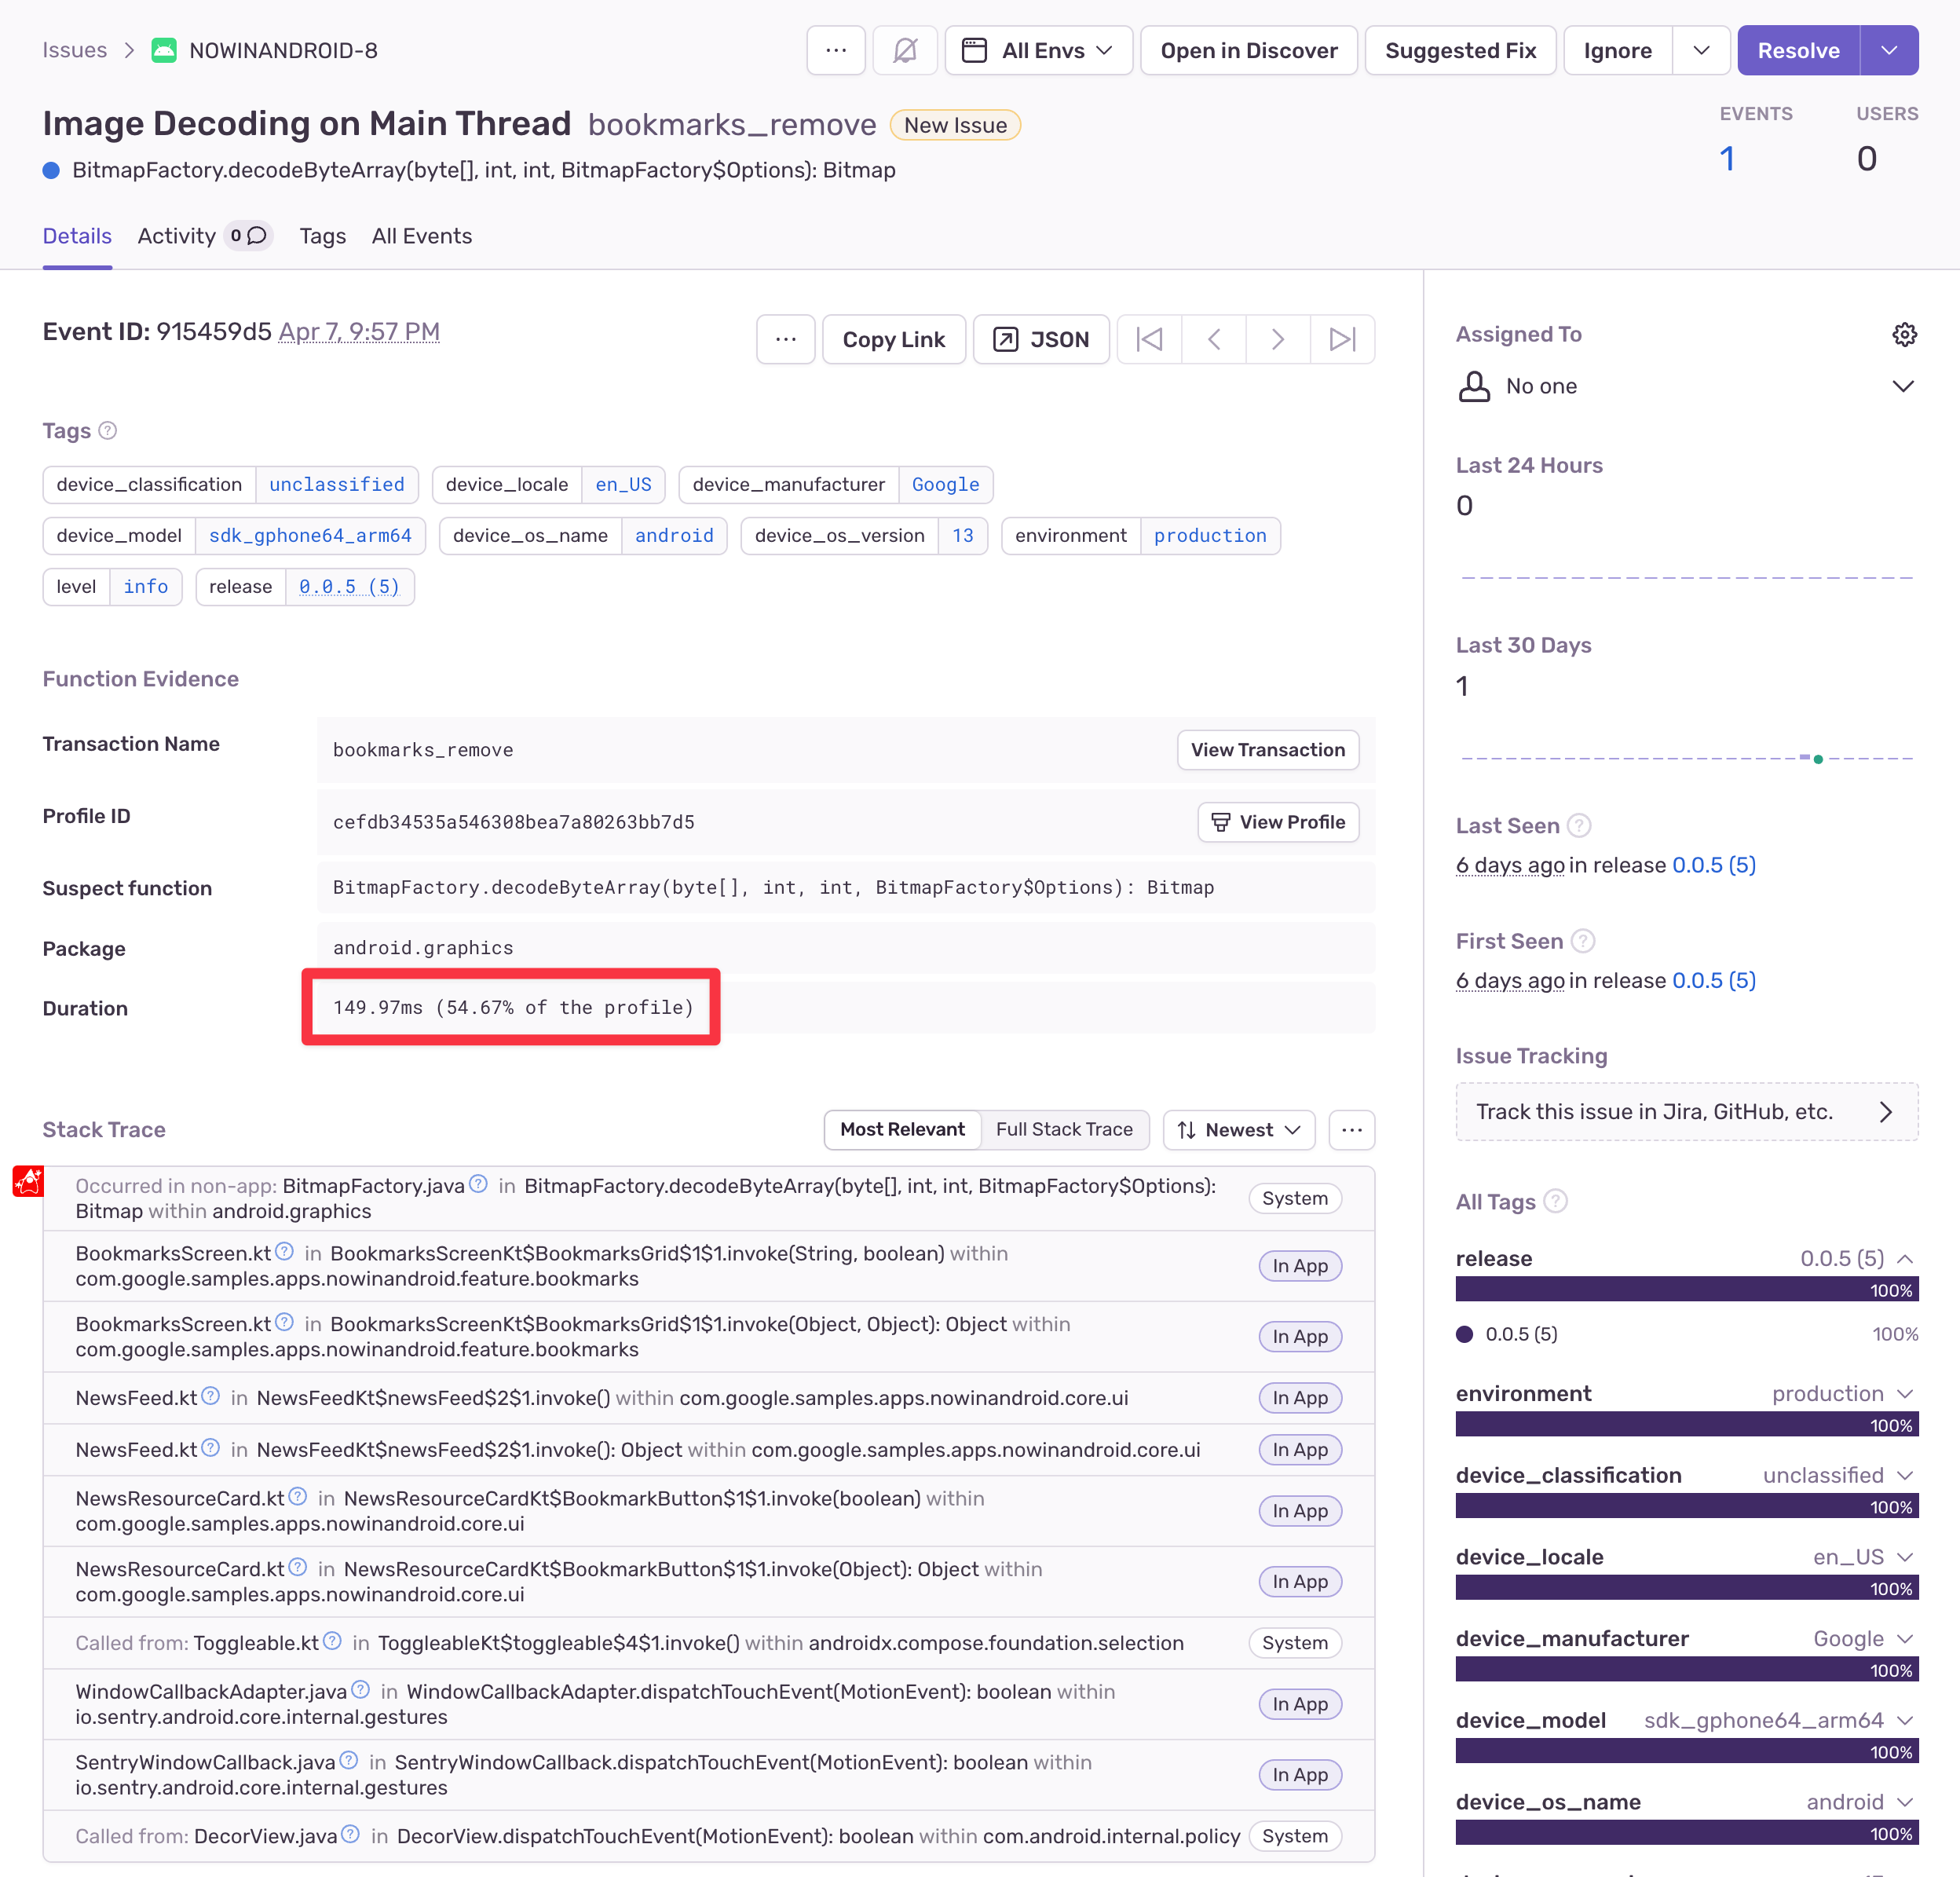
In this example, moving this image decoding operation off the main thread could save ~150ms of main thread time, preventing UI jank and poor scroll performance.
We’ll be rolling out more issue types, including issues that target backend platforms, in the near future.
Find out what's causing slow and frozen frames
On iOS and Android, profiles now support the UI Frames visualization, which renders slow and frozen frames (frame drops) inline with profiling data:
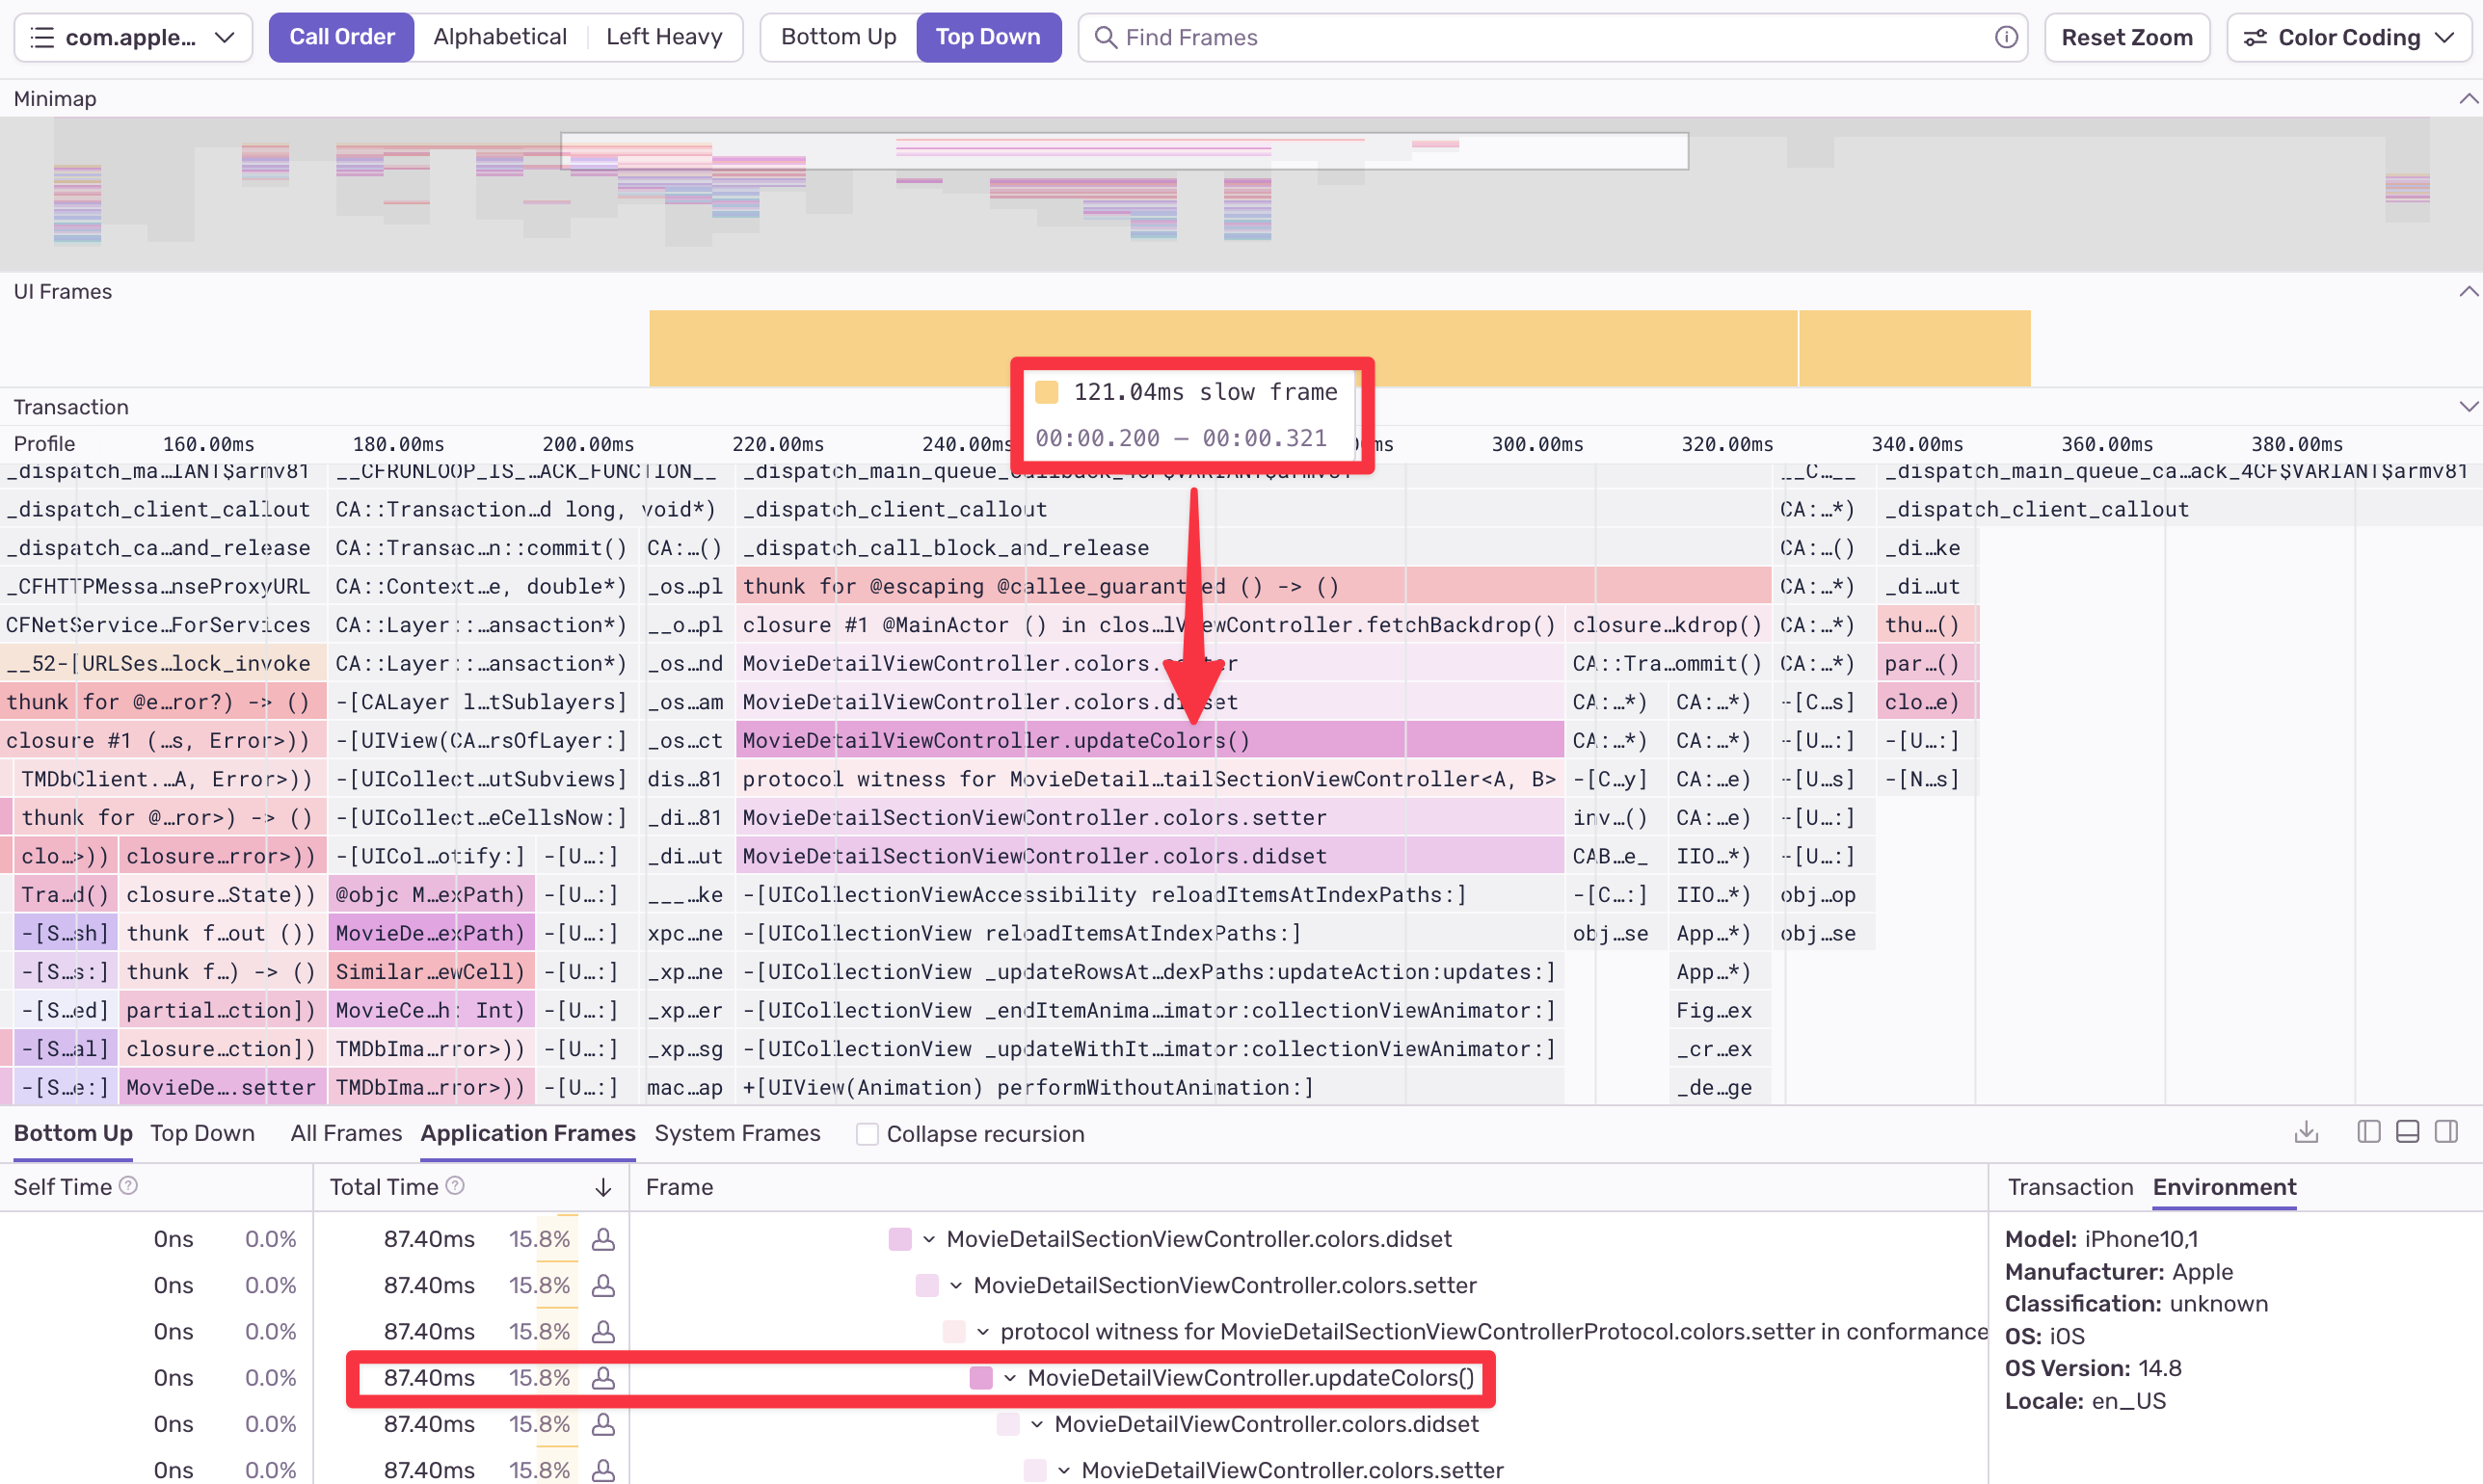
In this example, we can observe a slow frame render on the GPU highlighted in yellow that takes ~121ms to render — typically, we would expect a frame to render in ~16ms (when drawing at 60fps) to maintain smooth UI interactions. This indicates that a user may have observed poor scroll performance or other UI jank during this profile.
By looking directly below the slow frame at the flame graph, we can immediately see ~87ms (72%) of the 121ms slow frame is spent on calling the MovieDetailViewController.updateColors() function in our app. By optimizing this function, we could significantly improve UI performance and deliver a better user experience overall.
Now adding PHP support for Sentry Profiling
In addition to our supported platforms now out of beta — iOS, Android, Python, and Node.js — we also now support PHP in the sentry-php, sentry-laravel, and sentry-symfony SDKs.
And what’s next? We are working on support for Ruby and .NET — stay tuned!
Accelerated application performance troubleshooting from Day One
Sentry Profiling adds code-level context to application performance monitoring, helping you see where and why a performance issue is occurring – so you can fix it and optimize resource consumption. For customers like SpiffWorkflow, seeing the exact lines of code has accelerated their performance troubleshooting process.
Before Sentry, SpiffWorkflow developer Kevin Burnett had to manually comb through logs and maintain spreadsheets to diagnose their app’s performance issues. But with Sentry Profiling, identifying and tackling performance bottlenecks is much simpler.
We recently used Profiling to catch a slow MySQL transaction that resulted from us refactoring huge JSON documents into a relational database. Using Sentry’s flame graphs, we pinpointed specific parts of the transaction that were causing the slowdown and promptly resolved the issue.
— Kevin Burnett, SpiffWorkflow
And it doesn’t take days, weeks, or months to get started with Sentry Profiling and start seeing results. Customers such as Colin, technical founder of newsletter startup Paragraph, have fixed their performance problems and improved app speed within hours of implementing Sentry Profiling.
Just enabled function-level profiling on @getsentry, which made me immediately discover an ultra-slow regexp that was commonly taking >5s to execute. Fixed it and there's noticeable & substantial speed improvement.
— Colin Armstrong, Paragraph
To start capturing profiling data immediately, all you need to do is first set up performance monitoring (which takes just 5 lines of code) – and then you can just update your SDK to get started with Sentry Profiling.
Want to learn more? Here’s some jumping off points to help you get started with Sentry Profiling:
FAQ page for product and pricing details.
Getting-started guide to set up Profiling (by SDK)
Sentry Profiling website for general overview
What is Profiling & Why Use Profiling blog series
See a demo from our Profiling engineering team
You can also find us on GitHub, Twitter, or Discord. And if you’re new to Sentry, you can try it for free today or request a demo to get started.


