Monitoring and debugging AWS Lambda using Sentry and Epsagon
Monitoring and debugging AWS Lambda using Sentry and Epsagon
Epsagon helps troubleshoot serverless applications. Sentry helps monitor errors and fix crashes in real-time. In this post, Raz Lotan, Software Engineer at Epsagon, uncovers how both tools blend to make the perfect workflow for debugging serverless applications.
Facing unexpected behavior in your application is a difficult and exhausting task. With distributed architectures like microservices and serverless becoming more and more popular, things are not getting easier. Traditional debugging tools and application performance monitoring (APM) products don’t work well in these environments. To succeed, you need to leverage services that cater to these architectures.
In this post, I am going to focus on identifying and solving issues in AWS Lambda applications by combining two powerful tools: Sentry and Epsagon.
The problem with alerts in production
We’ve all experienced problems and inefficiencies with alerts in production. The complexity and scale of production environments tend to cause a lot of unwanted noise, and picking out the important stuff is usually a difficult job. Here’s one approach:
Divide alerts by the service to help put the error in context.
Show the frequency of each error to determine which ones are occurring the most.
Aggregate similar errors to reduce noise.
We use Sentry to solve these problems.
Error aggregation and reliable alerts
Sentry lets you create different projects and send traces to them. Each project represents a service in your application. Traces are sent by an instrumentation library that is added to your code. After instrumenting your code, the main dashboard gives a nice view of the separate services.
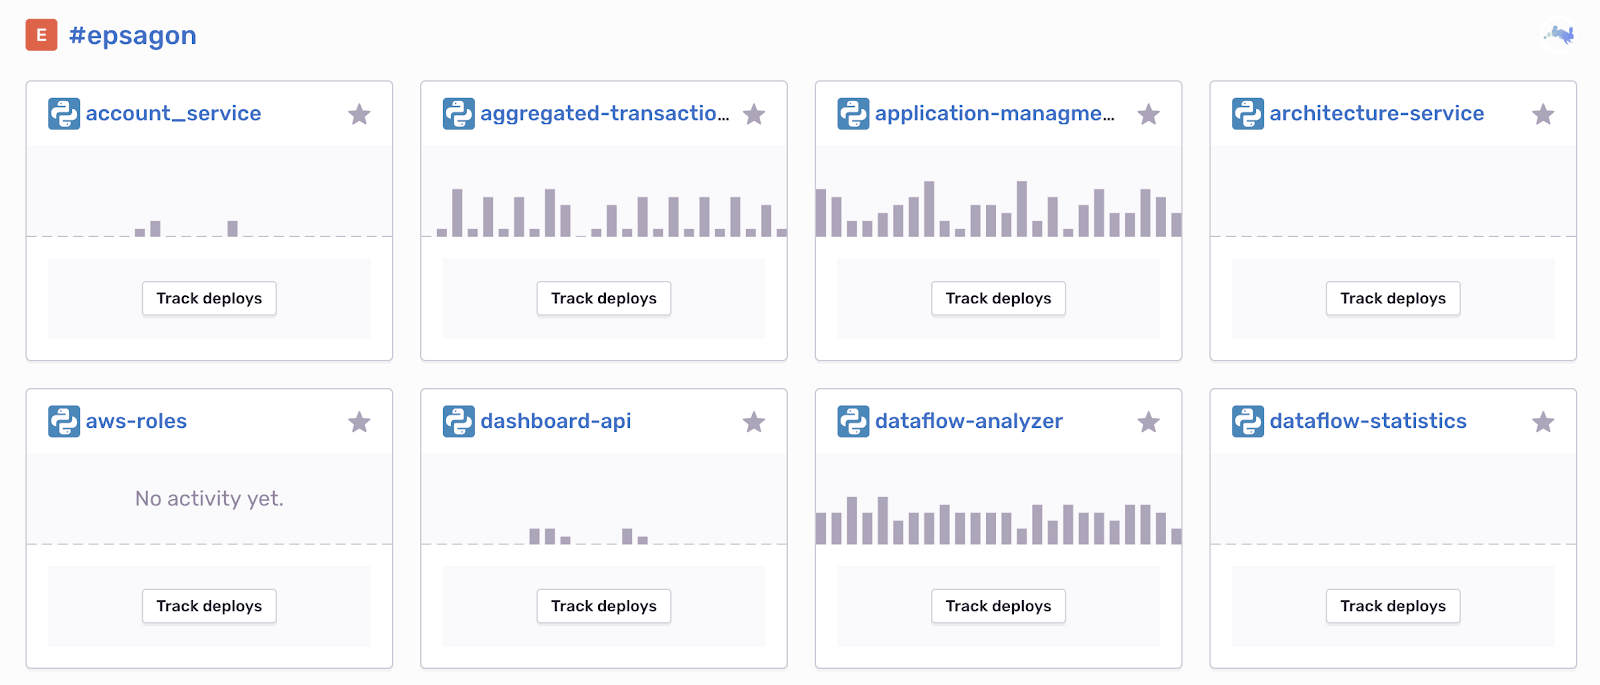
A glimpse at part of Epsagon’s monitored backend at an early and unhealthy stage
The instrumentation also offers many features, like adding tags and separate environment configuration to every trace sent. These features provide a unified and well-organized view of your entire application in one place.
When an error first appears, the live graph of the corresponding service is updated. Future errors of the same type are aggregated. Diving into a specific service gives a detailed view of the different errors. Every error can be seen with a traceback, the environment which this error occurred in, and much more.
Another great feature of Sentry is the ability to send and customize alerts. I particularly like when Sentry notifies me of any sudden spike of errors. The spike alerts feature lets you know something terrible is happening that needs your attention immediately.
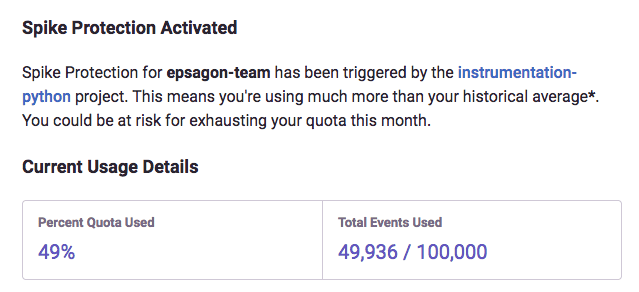
A very helpful, customized alert from Sentry
Understanding your application
Critical errors cost us money and frustration, but what can we do about them? In the world of distributed systems, looking at a single point of failure is usually not enough, for a few specific reasons. Applications contain many services. Each service includes resources that are both native to the platform (AWS Lambda, S3, etc.) and external 3rd party resources (Auth0, etc.). Also, connections between the different services are usually loose.
You have to see the error in the context of the service or services in order to effectively solve it.
Serverless monitoring
Epsagon provides live traces so that you can see real-time data across your application — something that proves especially helpful when debugging serverless applications.
Once a Lambda function is instrumented using the Epsagon library (or serverless plugin), data related to each execution of the Lambda is sent. Each recorded execution is a trace. Like Sentry aggregates errors, Epsagon automatically joins multiple traces into transactions, which can be viewed in the dashboard.
Looking into a single transaction shows all involved resources and the actual data that was sent:
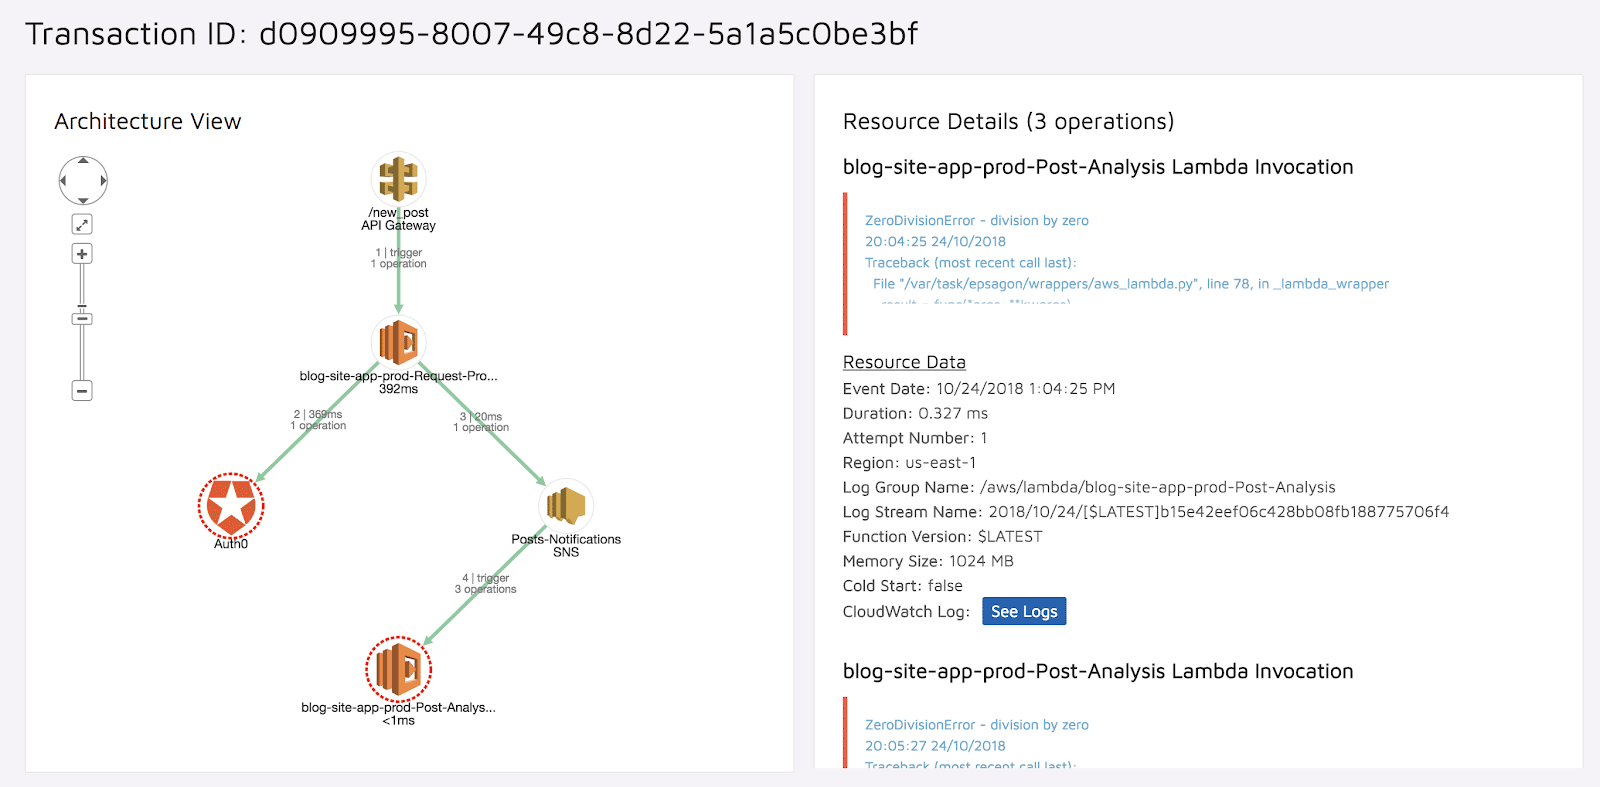
Resources used and data sent, at your fingertips
We can see the relevant logs for each Lambda, the item that was sent in the SNS, and the actual request that was sent to the API gateway.
Once traces are collected, a visual representation of your application is automatically generated (can be seen in the demo environment):
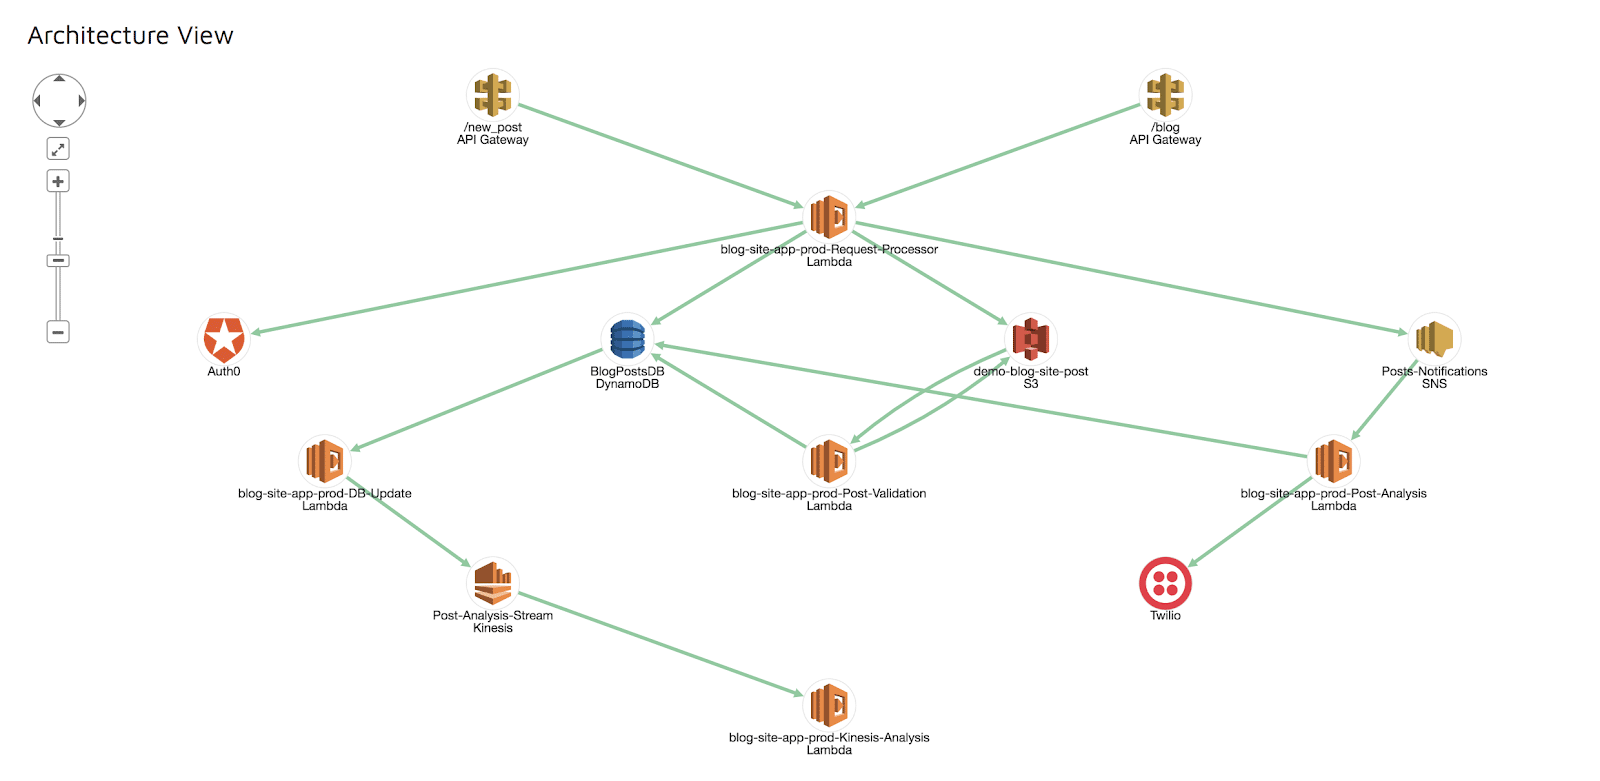
Auto-generated application architecture
Test case
To put this into action, we are going to build an application with a simple REST API that allows the storage of some data in two databases. We have a single endpoint:
/store_item/{item_id}In a chain of events, two Lambda functions are invoked. The first Lambda function stores the given item in an S3 bucket. The second Lambda function stores the created file content in a DynamoDB.

From API Gateway to DynamoDB
Our serverless application is monitored both by Sentry and Epsagon.
When things go wrong
Our application has been up and running for a while. Data has been collected in both systems.
Looking at Sentry, we found an error that occurs frequently:
ClientError: An error occurred (ValidationException) when calling the PutItem operation: One or more parameter values were invalid: Missing the key item_id in the item
Looking deeper into the traceback we get a lot more information:
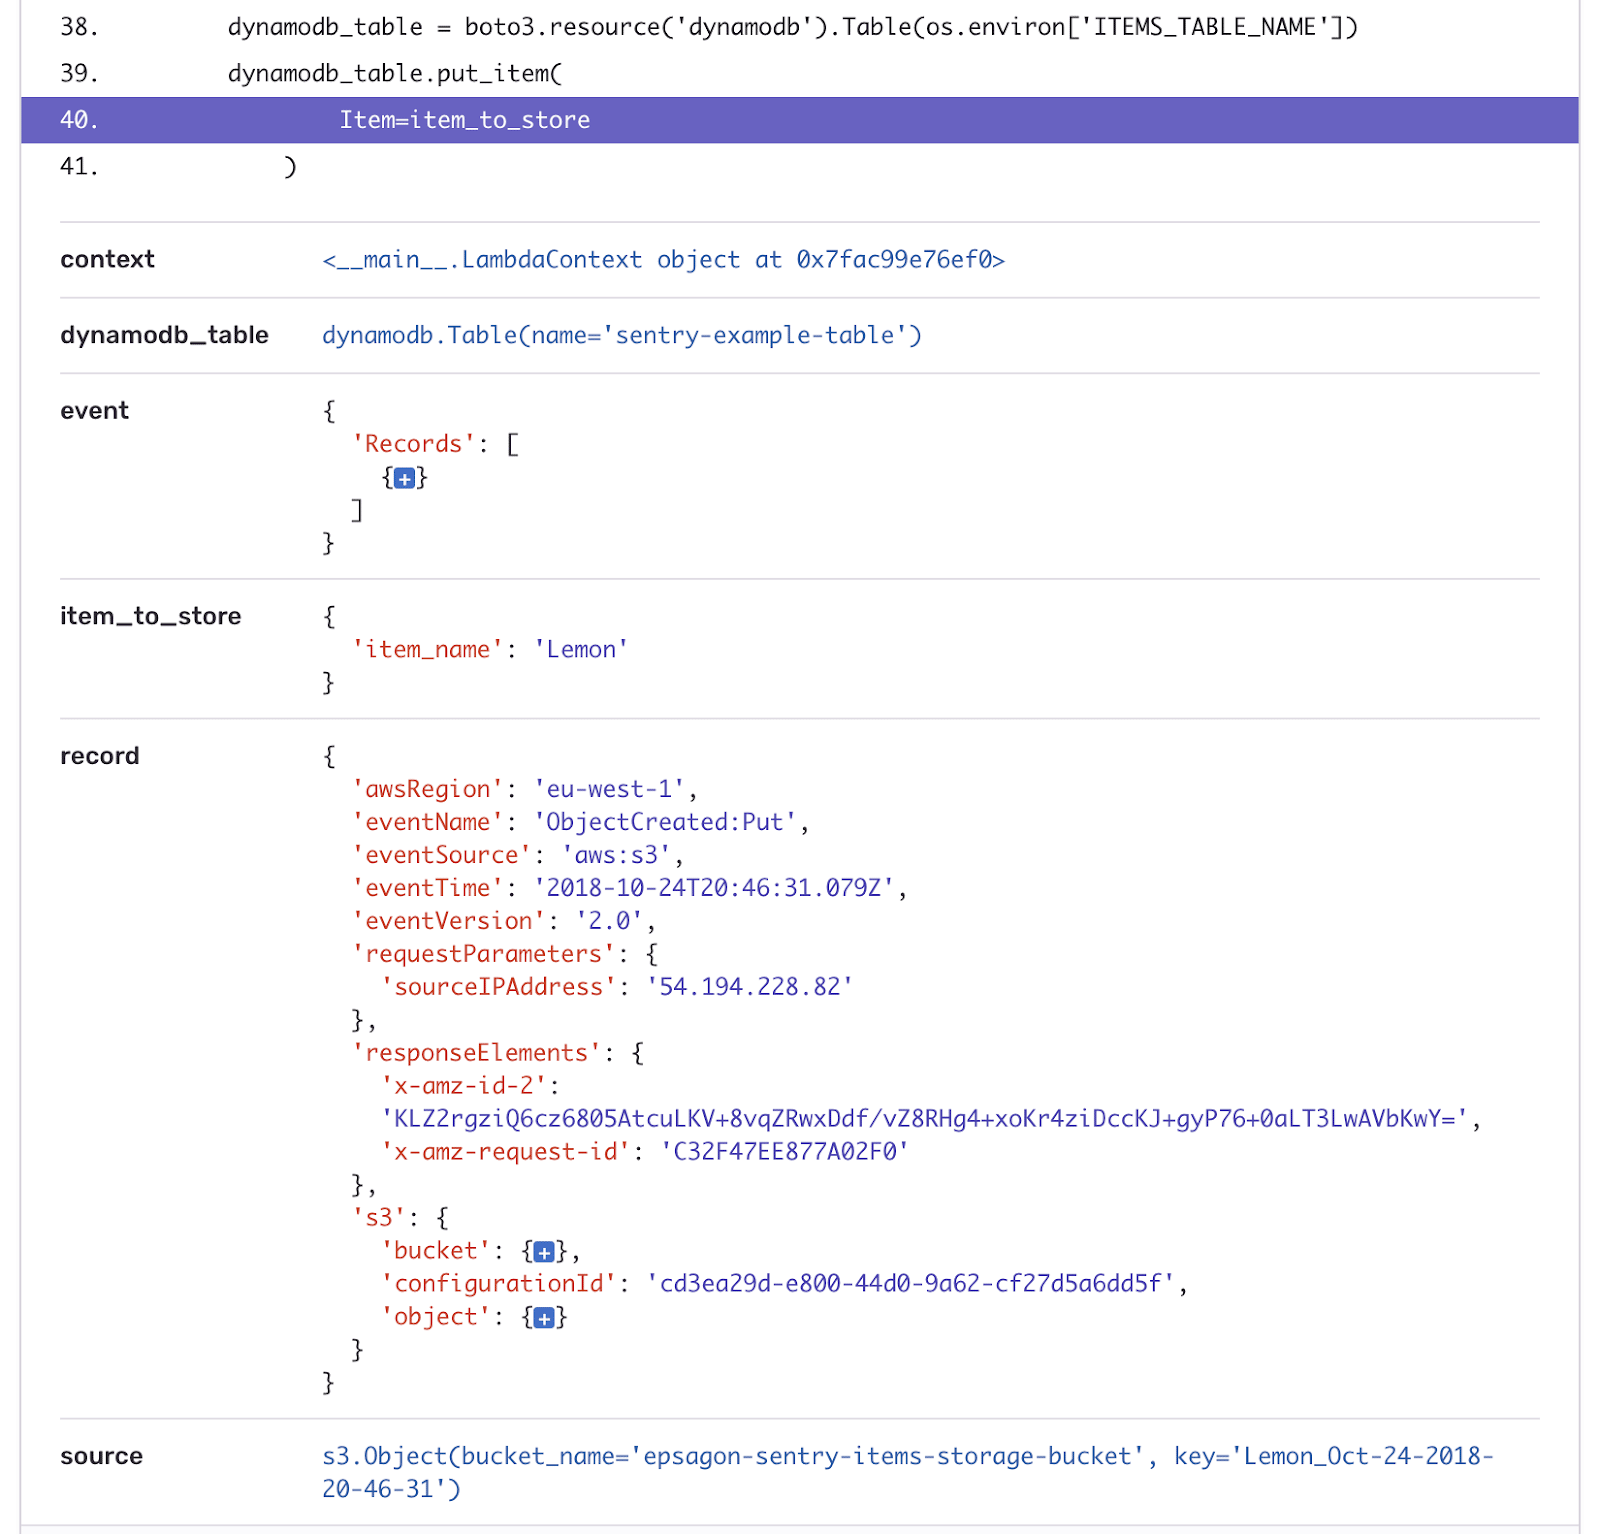
Wow. Look at all that context.
From this context, we can see that:
A Lambda function is invoked by an S3 file creation.
The Lambda function attempts to insert the file content into a DynamoDB.
The operation fails because
item_idkey is missing.
At this point, it’s almost impossible to track further backward what happened — especially on a high scale. However, using Epsagon to filter all the failed transactions related to the specific Lambda function, S3, and a DynamoDB PutItem operation narrows down the options to the relevant transactions.
Looking at one of the failed transactions gives us an exact visual representation of our application:
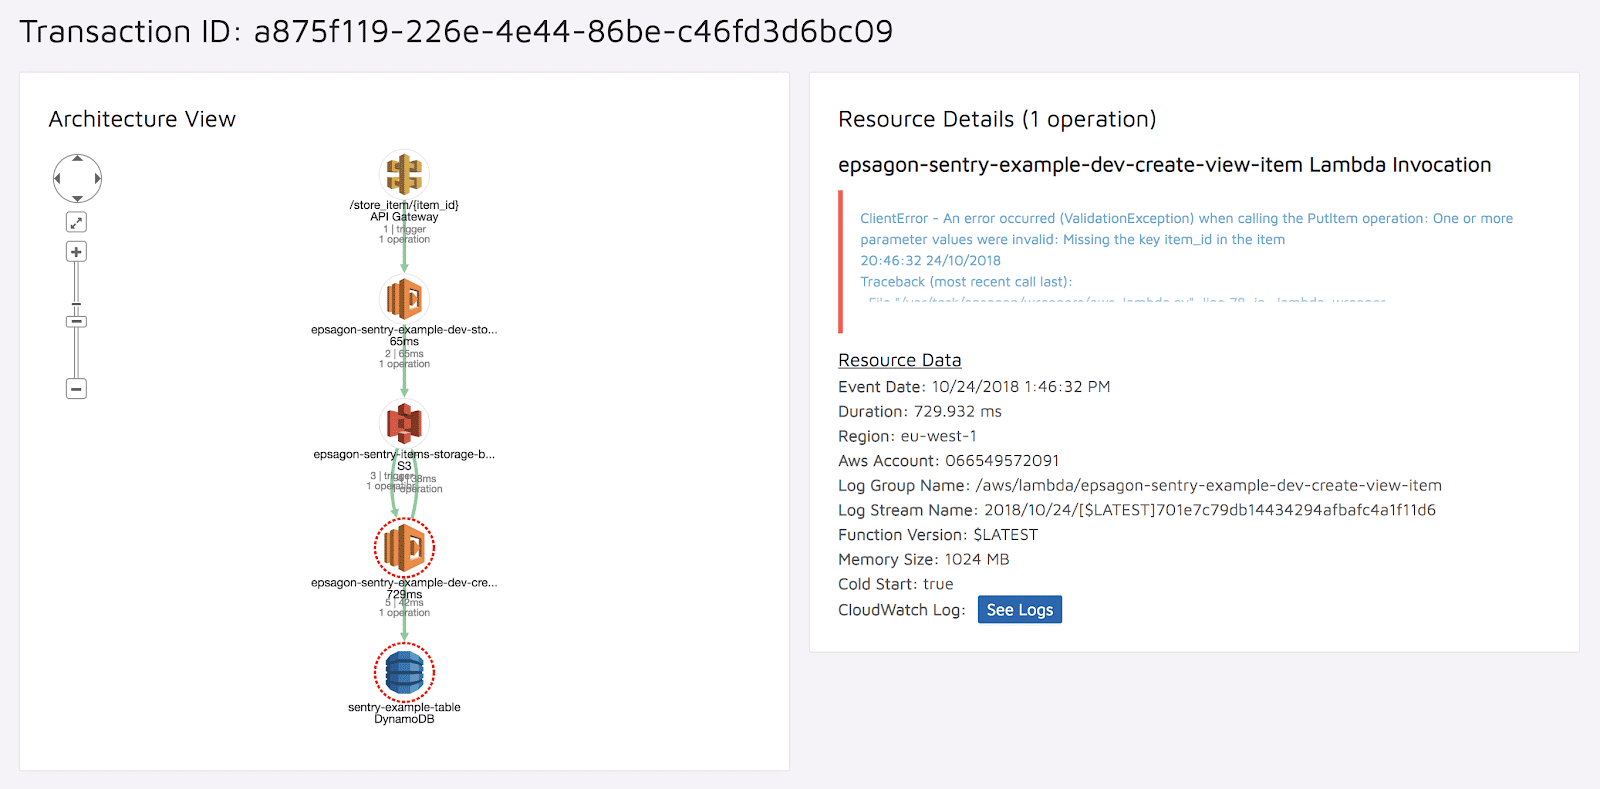
An exact visual representation of our application
Let’s take a deeper look at each of the resources involved in the process in the context of the full transaction. We already know what item the second Lambda tried to store in the DynamoDB. But what data did the API Gateway receive? To answer this question, we simply have to click on the little API Gateway icon, and look at the given info:
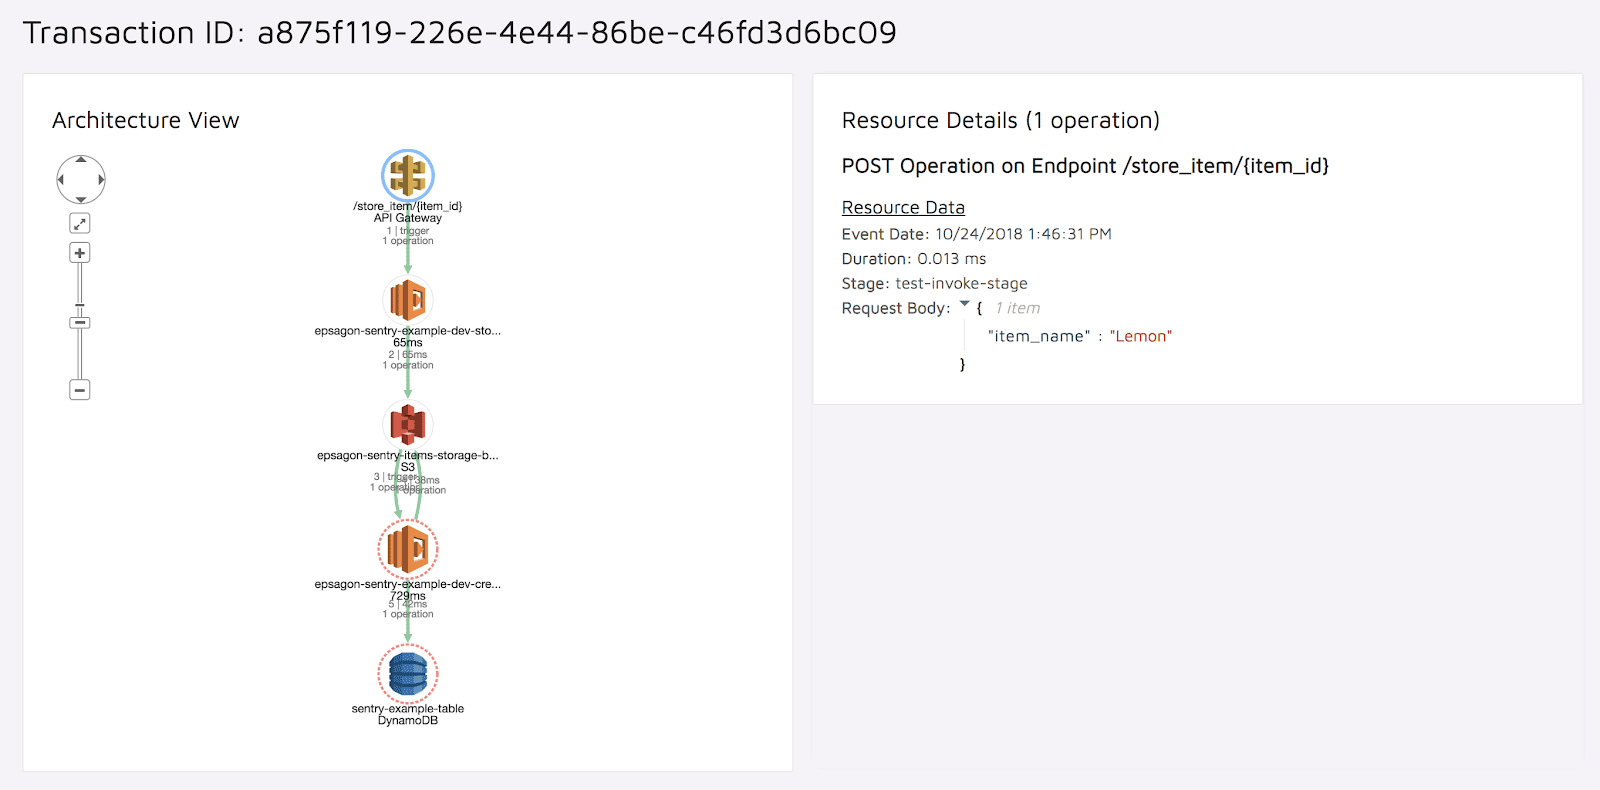
Data received by the API Gateway
As we can see, the request body only contains:
{
  “item_name”: “Lemon”
}
That’s exactly the item the second Lambda function tried to store in the DynamoDB when we were alerted in Sentry of the initial error.
Combining Sentry and Epsagon allowed us to see that the item was passed all the way through without any validation. A quick fix of input validation will fix this error.
Conclusion
Keeping track of errors in your application is extremely important, especially in a production environment. It allows you to get a better understanding of your application health status. Distributed applications make the job even more difficult, as tracing back to the root cause of a problem is much more complex.
With the help of Sentry and Epsagon, we quickly went from having zero knowledge to understanding the error. Using the right tools at the right time can help tremendously with these kinds of issues.


