There’s a very specific kind of frustration that comes from waiting several minutes for a video to encode, dragging it into a message, and getting hit with a “file too large” error.
Then you’re blindly trying to shave off a few more megabytes by re-encoding, maybe at a lower resolution or a smaller bitrate, hoping you won’t have to do it more than one or two more times.
Here’s how I used Sentry’s Application Metrics to make a more accurate video size estimator.
Recently I was working on one of my vibe-coded projects (as one does): Cliparr, a self-hosted tool for creating clips from videos.
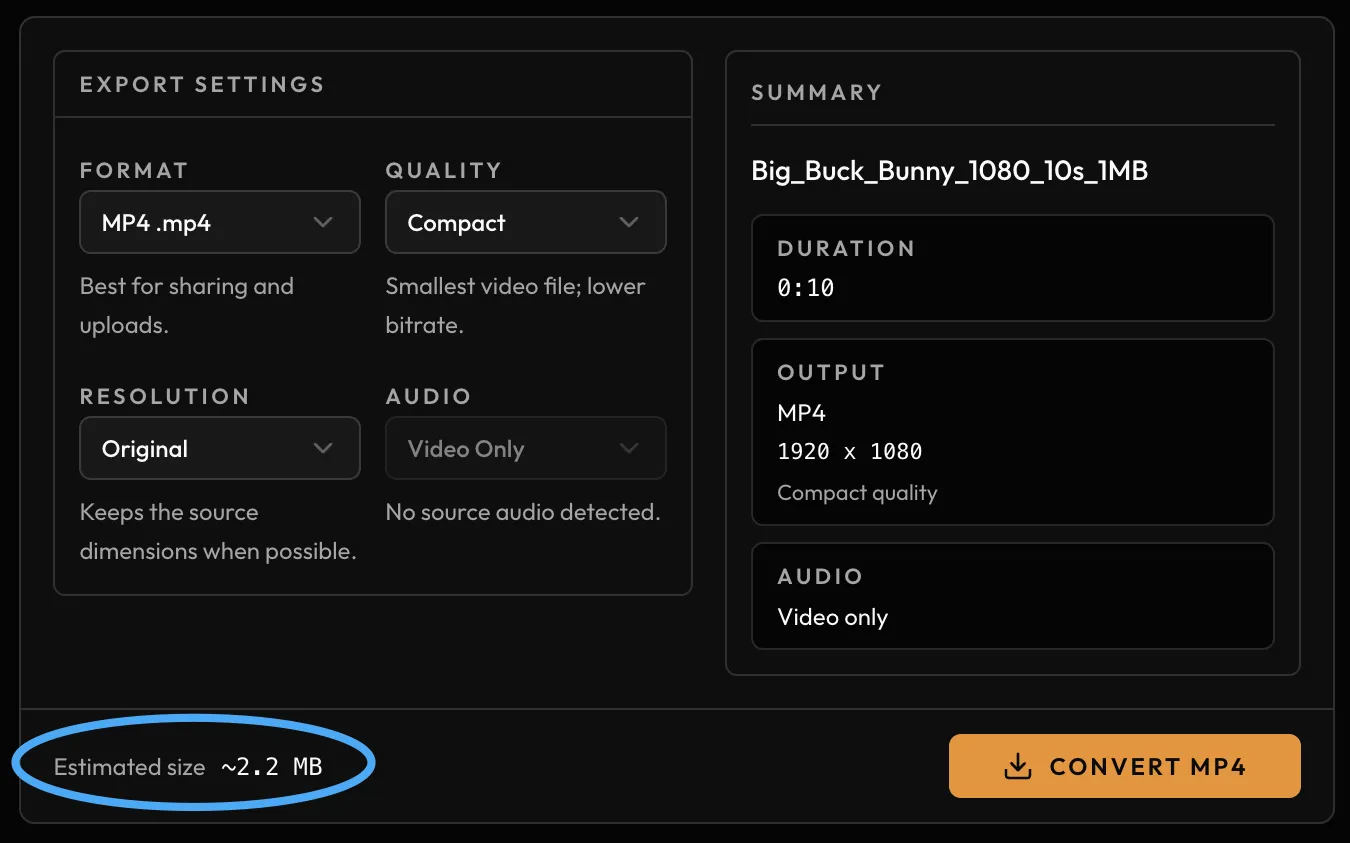
Naturally, it would be ideal to know the size of the output file before exporting it.
Theoretically, calculating the size of a video should be pretty simple. If you know the target bitrate and the duration of the clip, you can simply multiply them together to get the final output size.
That should be true for any video format, regardless of codec or container.
[bitrate] x [duration] = [size]
But I found it difficult to trust whether that would hold true in practice, across a range of devices, browsers, and formats.
I have some experience editing videos, done a little bit of research, and can always ask the magic AI box. But how would I know for sure if what I expect to be true matches reality?
What kind of unknown factors might make this simple estimate wrong in practice? I had a few ideas, one I’ll mention in a moment, but I was more concerned with what I might not know.
At first I started by simply converting a bunch of videos from my computer manually and checking to see how accurate it was. It was looking pretty accurate…
But I realized I wanted to get a little more scientific about it. I could set up a matrix of different formats, codecs, quality settings, etc.
And then I realized I’m both slightly too lazy for that, and there may be a better way. I could simply record real-world usage of the tool and see how accurate it is in the situations that people actually use it.
Using Sentry’s Application Metrics to monitor and visualize the conversion results, I found one example where my estimate was off by 83%.
A Win-Win-Win for my open-source project
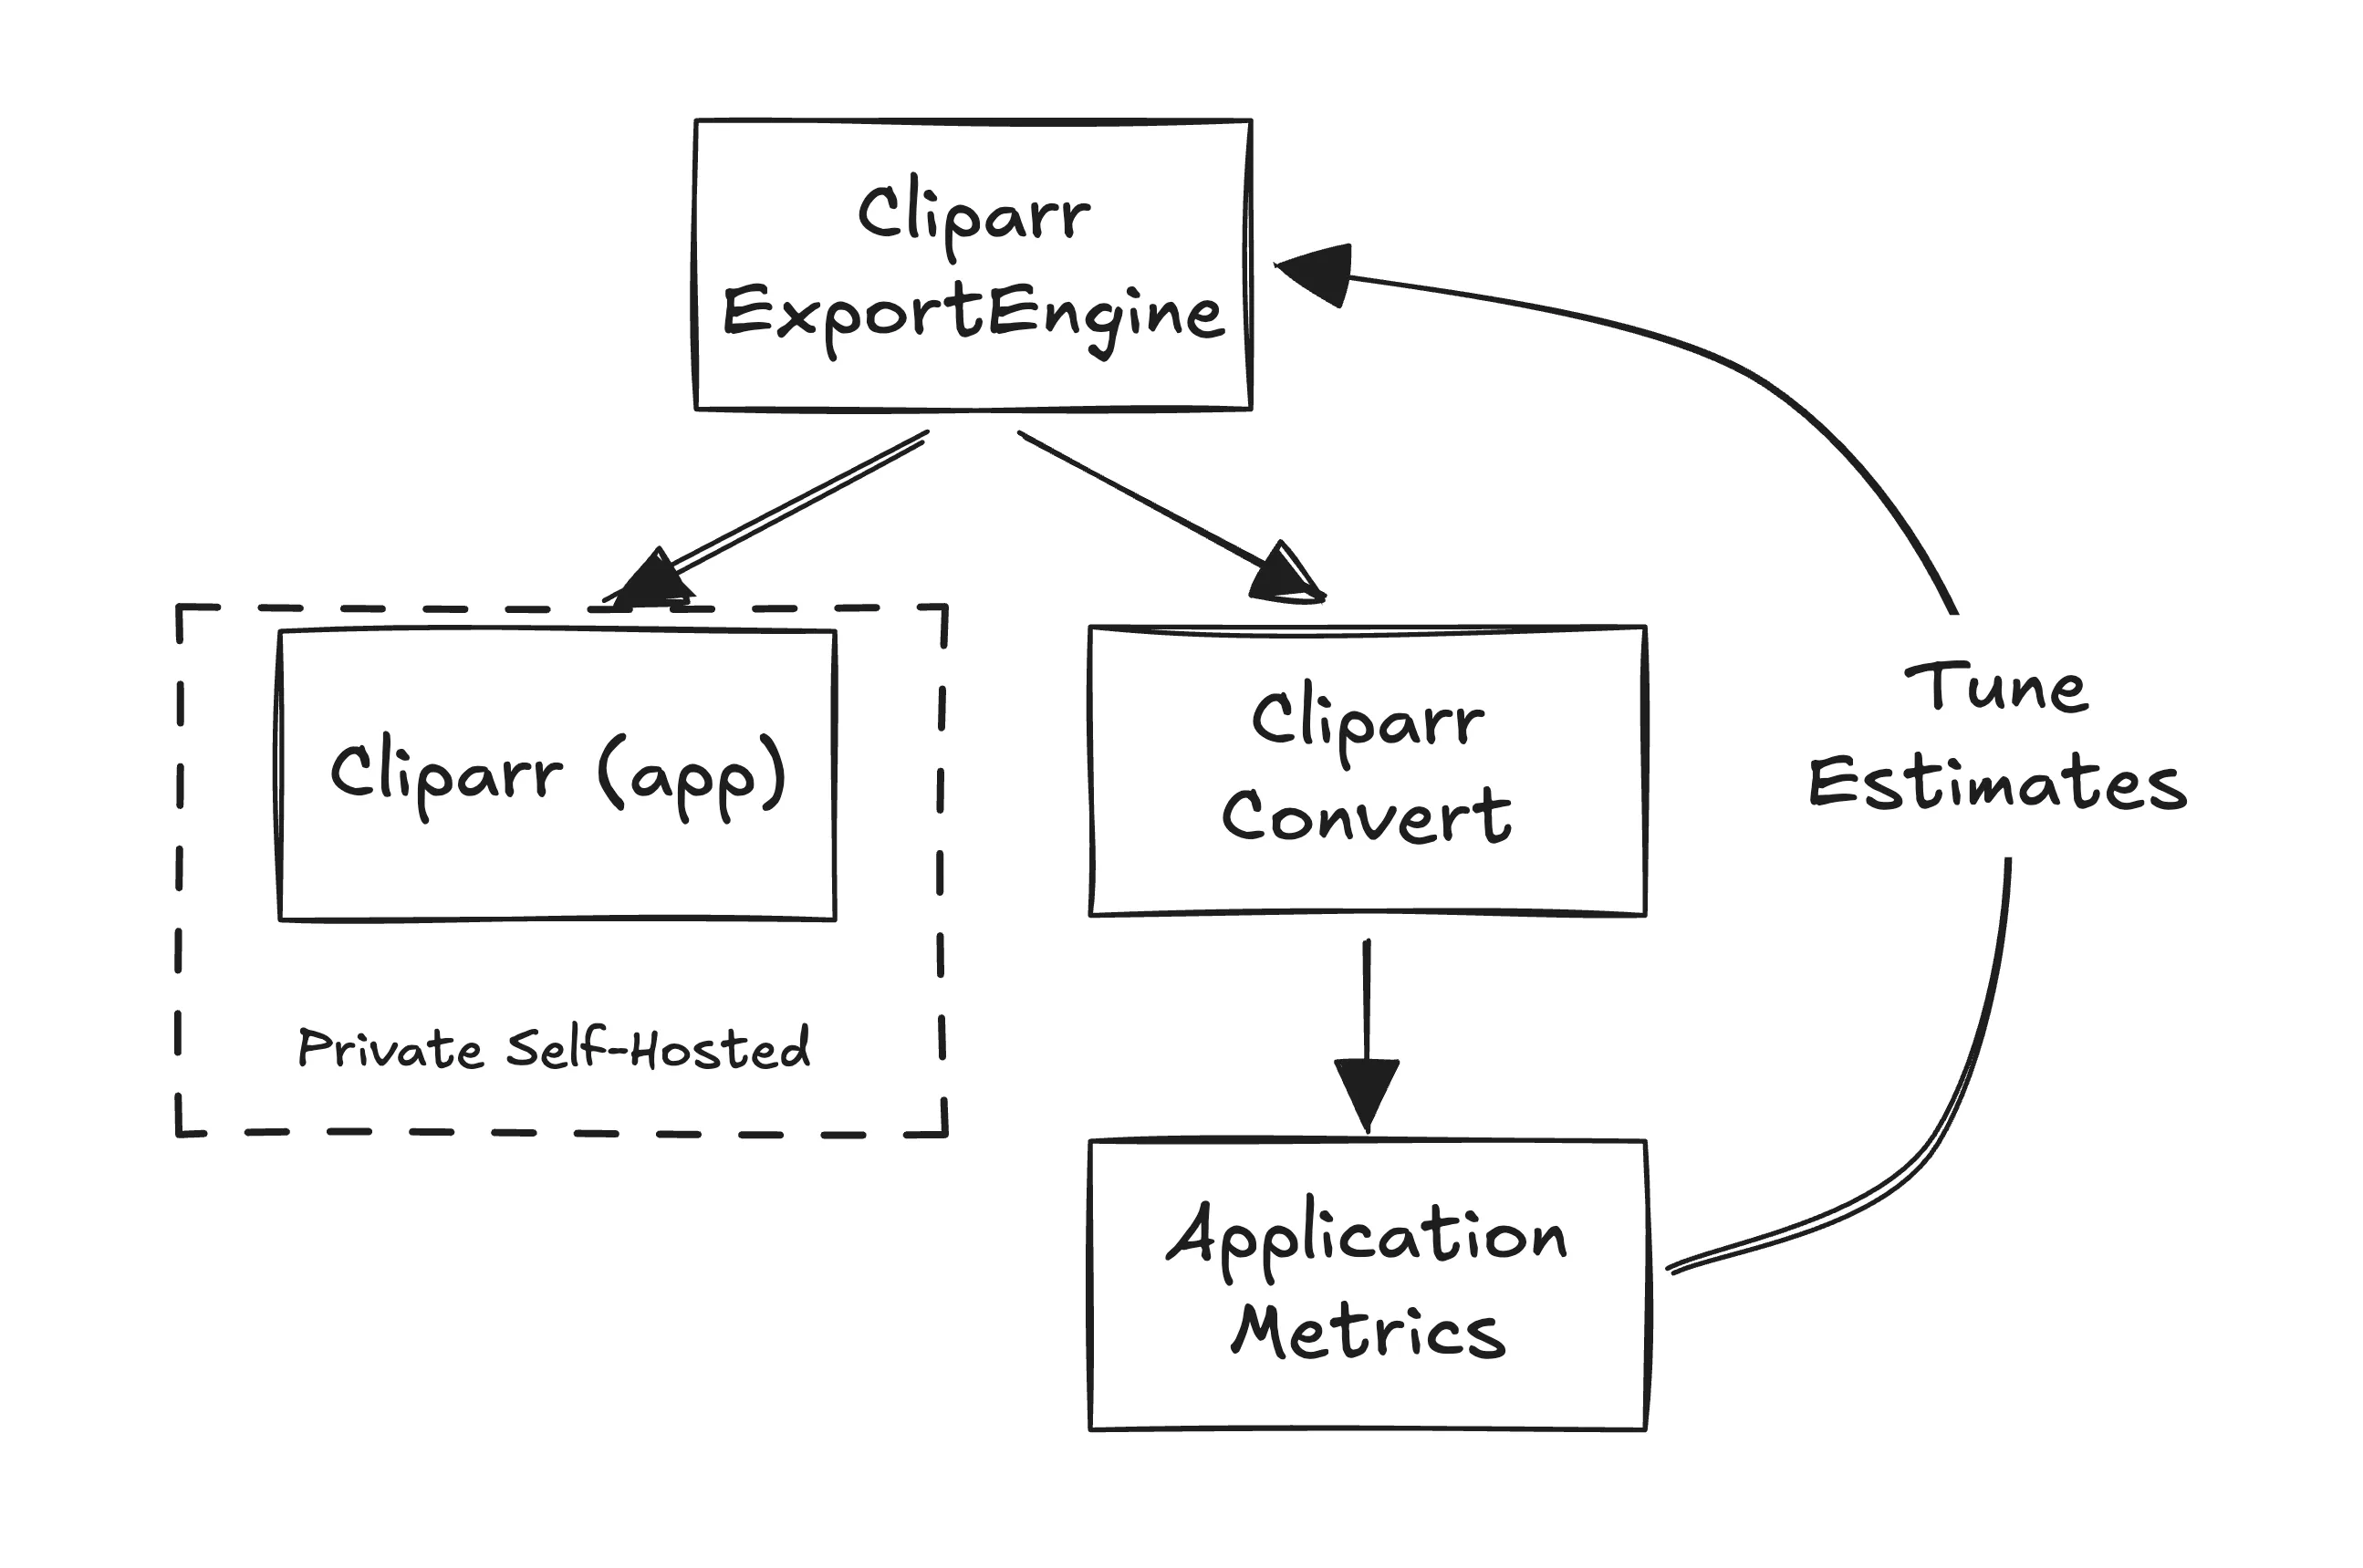
Cliparr integrates with Plex and Jellyfin, but all the transcoding happens on-device, in the browser, via MediaBunny, so nothing ever gets uploaded to or processed on the server.
It could nearly be a static site, but it has a small proxy server for authentication and accessing media files.
Opt-in telemetry would’ve been a fair way to go, but the self-hosted community isn’t typically keen on sending data, and I didn’t want to change the setup flow for now.
That left me with no way to measure estimate accuracy from the app itself, but the constraint gave me an idea that would pay off threefold:
Real data to improve the estimates, without touching anyone’s self-hosted install.
A new tool people could use right on the site, no account or hosting required.
An SEO win from another genuinely useful reason to visit the website and come back.
I separated the export engine from the editor and shipped it as a standalone package that I could use on the public website to create Cliparr Convert.
It’s a minimal in-browser video converter with simple presets, useful for converting between file types and compressing videos when size limits might be an issue.
This is “hosted” (this one actually is fully static) on the public Cliparr site, so anyone can use it without installing anything, though it’s available as a progressive web app (PWA) if you want it.
This page has been minimally instrumented with Sentry’s Application Metrics to anonymously track the key performance indicators (KPIs) I care about for improving the size estimation feature.
The only data that leaves the browser is numbers, never the media itself, filenames, or URLs. In this case, we aren’t even using tracing, just metrics.
Tracking KPIs with counters and distributions
These are the three main questions I wanted to be able to answer with the metrics:
Is the size estimate accurate? (How far off is the estimate from reality?)
What media types are people actually converting? (What should I focus on improving first?)
Is it even working? (Are conversions completing?)
Those are three KPIs I can track and improve over time, without ever touching anyone’s self-hosted install.
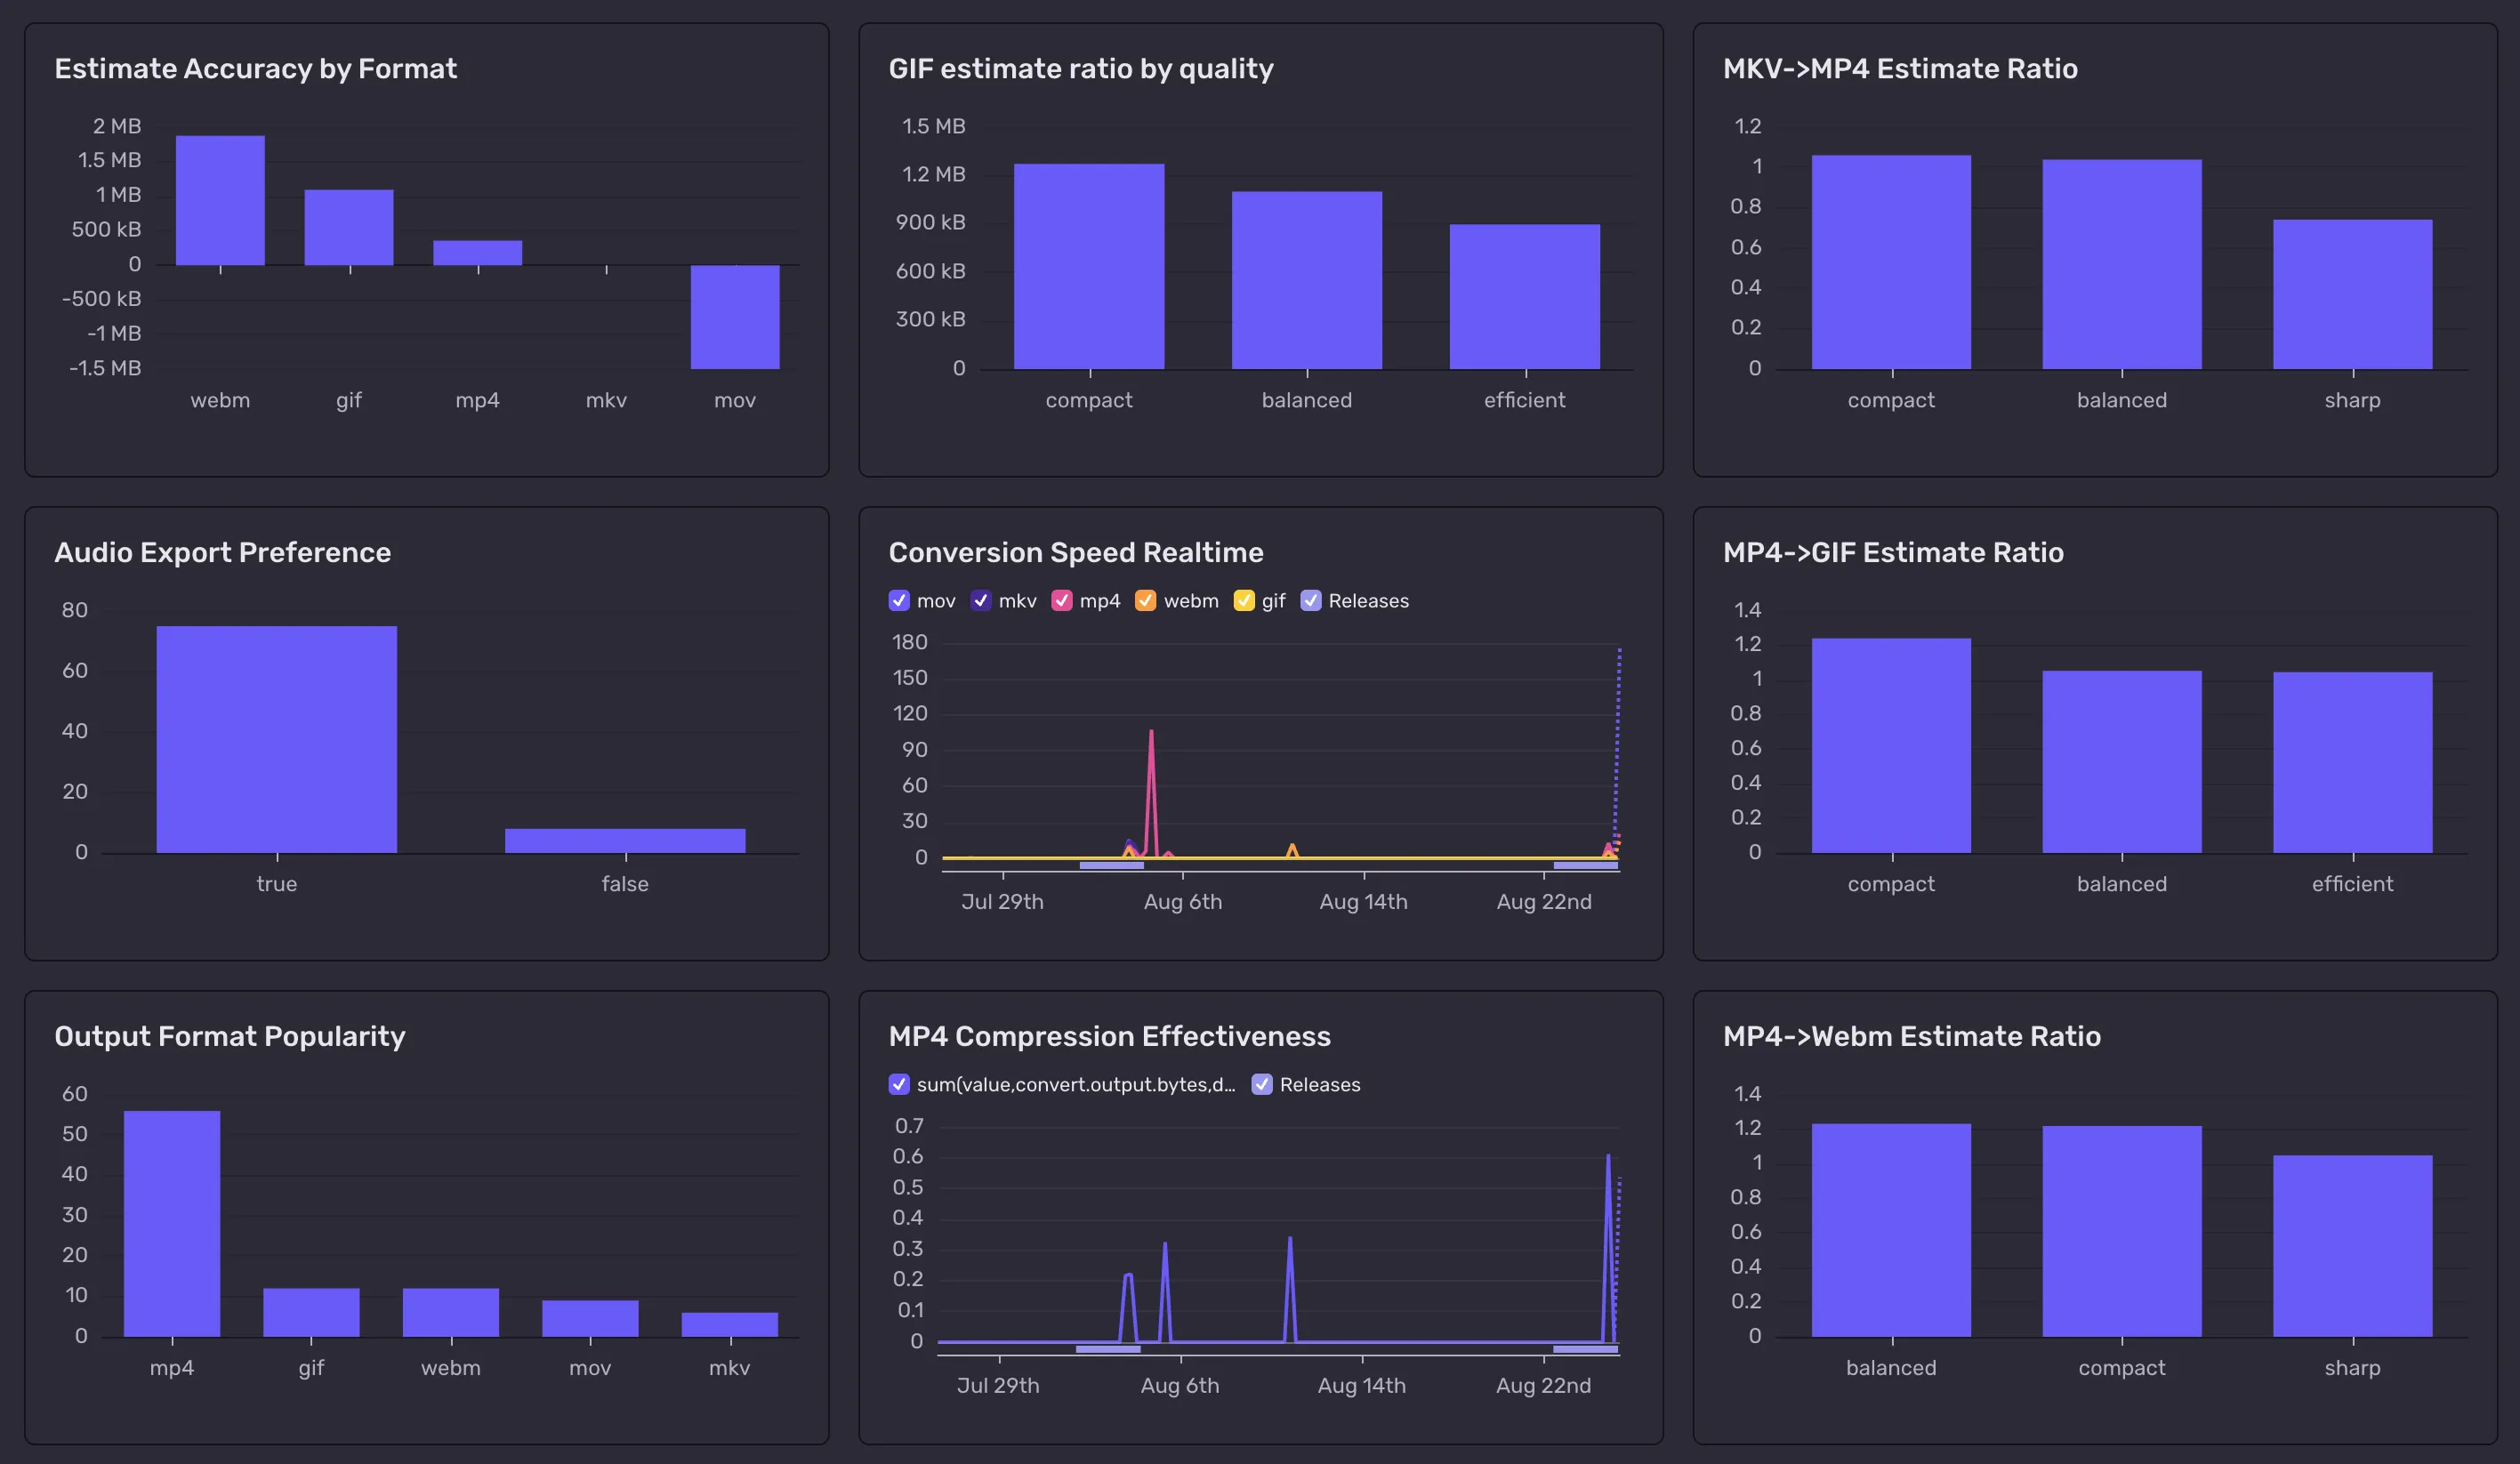
With the simple anonymous metrics I collected, I was able to create a fairly detailed dashboard for monitoring each KPI as well as a few other interesting metrics that fell out of the data.
KPI #1: Is the estimate honest?
The key metric: how accurate is our size estimation formula in the real world?
Well, I already expect our estimate won’t be perfect, because in the real world, we rarely have a perfect, constant bitrate.
Right now, Cliparr has a target bitrate, but it is using a variable bitrate (VBR) encoder, which means that the encoder will vary the bitrate based on the content of the video.
For quality, this is a good thing, and it means the final size will be smaller than it otherwise would have been.
But it also means that our formula is already only a very rough estimate and could be off by a significant amount for some videos, theoretically.
Still, for now, how far off is it on average? And what do outliers look like?
For every completed conversion, I record the ratio of the actual size to the estimated size as a distribution metric, alongside the raw numbers:
// One completed conversion, recorded as a family of measurements.const attributes = { "estimate.basis": outputSizeEstimate.basis, // transcode-plan | gif-profile | … "output.format": format, // mp4 | webm | gif | … "export.quality": selectedQuality, // sharp | balanced | compact};Sentry.metrics.distribution("convert.output.bytes", actualBytes, { unit: "byte", attributes });const estimateBytes = outputSizeEstimate.bytes;if (typeof estimateBytes !== "number" || estimateBytes <= 0) return; // no estimate? skip the ratioconst ratio = Number((actualBytes / estimateBytes).toFixed(3));Sentry.metrics.distribution("convert.estimate.delta_bytes", actualBytes - estimateBytes, { unit: "byte", attributes });Sentry.metrics.distribution("convert.estimate.ratio", ratio, { attributes }); // no unit, it's a ratio
Technically I could calculate the ratio in the dashboard, and that might even be more correct, but this is a little easier for me.
We’ll be able to aggregate the distribution and group it by output format, quality, and which estimator produced it, among other attributes.
I added an estimate.basis attribute because we use a different formula for GIFs, and we may want to change or version the formula we use for videos later. Hint.
If you’ve used Sentry before, you might be wondering why I didn’t use logs instead, or even traces.
Logs, Traces, and Metrics each record events with additional attributes, but each behaves slightly differently, and should be used in different contexts.
Traces could technically carry some of this, but traces are usually heavily sampled, and I want to know about every single conversion, not a slice of them. A trace is also built to follow one unit of work through a system and time it, and a size ratio isn’t a unit of work, just a number each conversion produces at the end.
If you were thinking of using logs, that would be more understandable, but still not the correct choice for this data.
Logs emit application state for debugging, and while they could be visualized, it might not be immediately obvious in the future that one of your logs is critical to monitoring KPIs.
Metrics record numeric values and aren’t sampled. A metric is a deliberate statement of this is something we measure, not a debug log that gets deleted once it’s served its purpose.
Here’s what it looked like after recording a handful of conversions, both before and after I fixed the estimator.
Read the ratio like this: 1.000 is perfect. 1.15 means the real file came out 15% bigger than predicted.
0.85 means it came out smaller.
Then, I grouped it by estimator, so we can see how each formula performed.
Estimator
Samples
Avg ratio
Range
What it means
AI Suggested Formula (old)
16
1.57
1.30 – 1.83
Output up to 83% bigger than promised
Bitrate Formula (new)
24
0.97
0.84 – 1.05
Transcodes land within ~5%
GIF Estimator (alternative)
8
0.91
flat
~9% over-estimate
In my first attempt at this, I’d simply asked the AI to write a size estimator for me, and for whatever reason, it did not use a simple bitrate x duration formula. It was trying to be clever, and it was wrong.
Look at that top row. After recording a few examples, that first estimator was producing output files up to 83% larger than the estimate.
I expected the estimate to be a little off, but 83% seemed like there might be an issue with the estimation formula.
I went back to actually take a look at what the agent had written, and it didn’t make any sense.
The first attempt looked like a bad attempt to guess what might happen if you re-encoded a video at a different resolution.
But resolution doesn’t enter the file size calculation at all. When encoding at a “bitrate”, you are explicitly telling the encoder how many bits to use per second of video.
The encoder is going to use that many bits, regardless of the resolution. It will affect the quality, but not the file size.
// The first version. Don't do this.const estimatedBytes = sourceBytes * (targetHeight / sourceHeight);
Here’s what I think happened: when I first asked my assistant to add size estimation, it over-indexed on my prompt.
I might have asked it something like “What about if the resolution changes?”, and I wouldn’t be surprised if I accidentally steered it away from the simpler, correct answer with a question like that.
After seeing that obvious error thanks to the metrics dashboard, I replaced the broken estimator code with the correct bitrate-based formula,
and added an “estimator basis” attribute, which allows me to split the results easily by which formula was used.
The new bitrate-based estimator has taken us from up to 83% off to within about 5%.
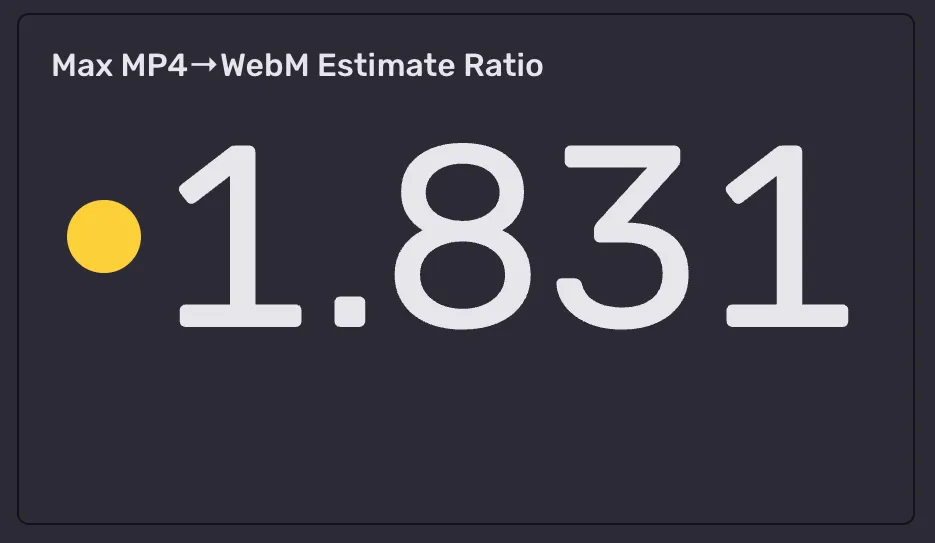
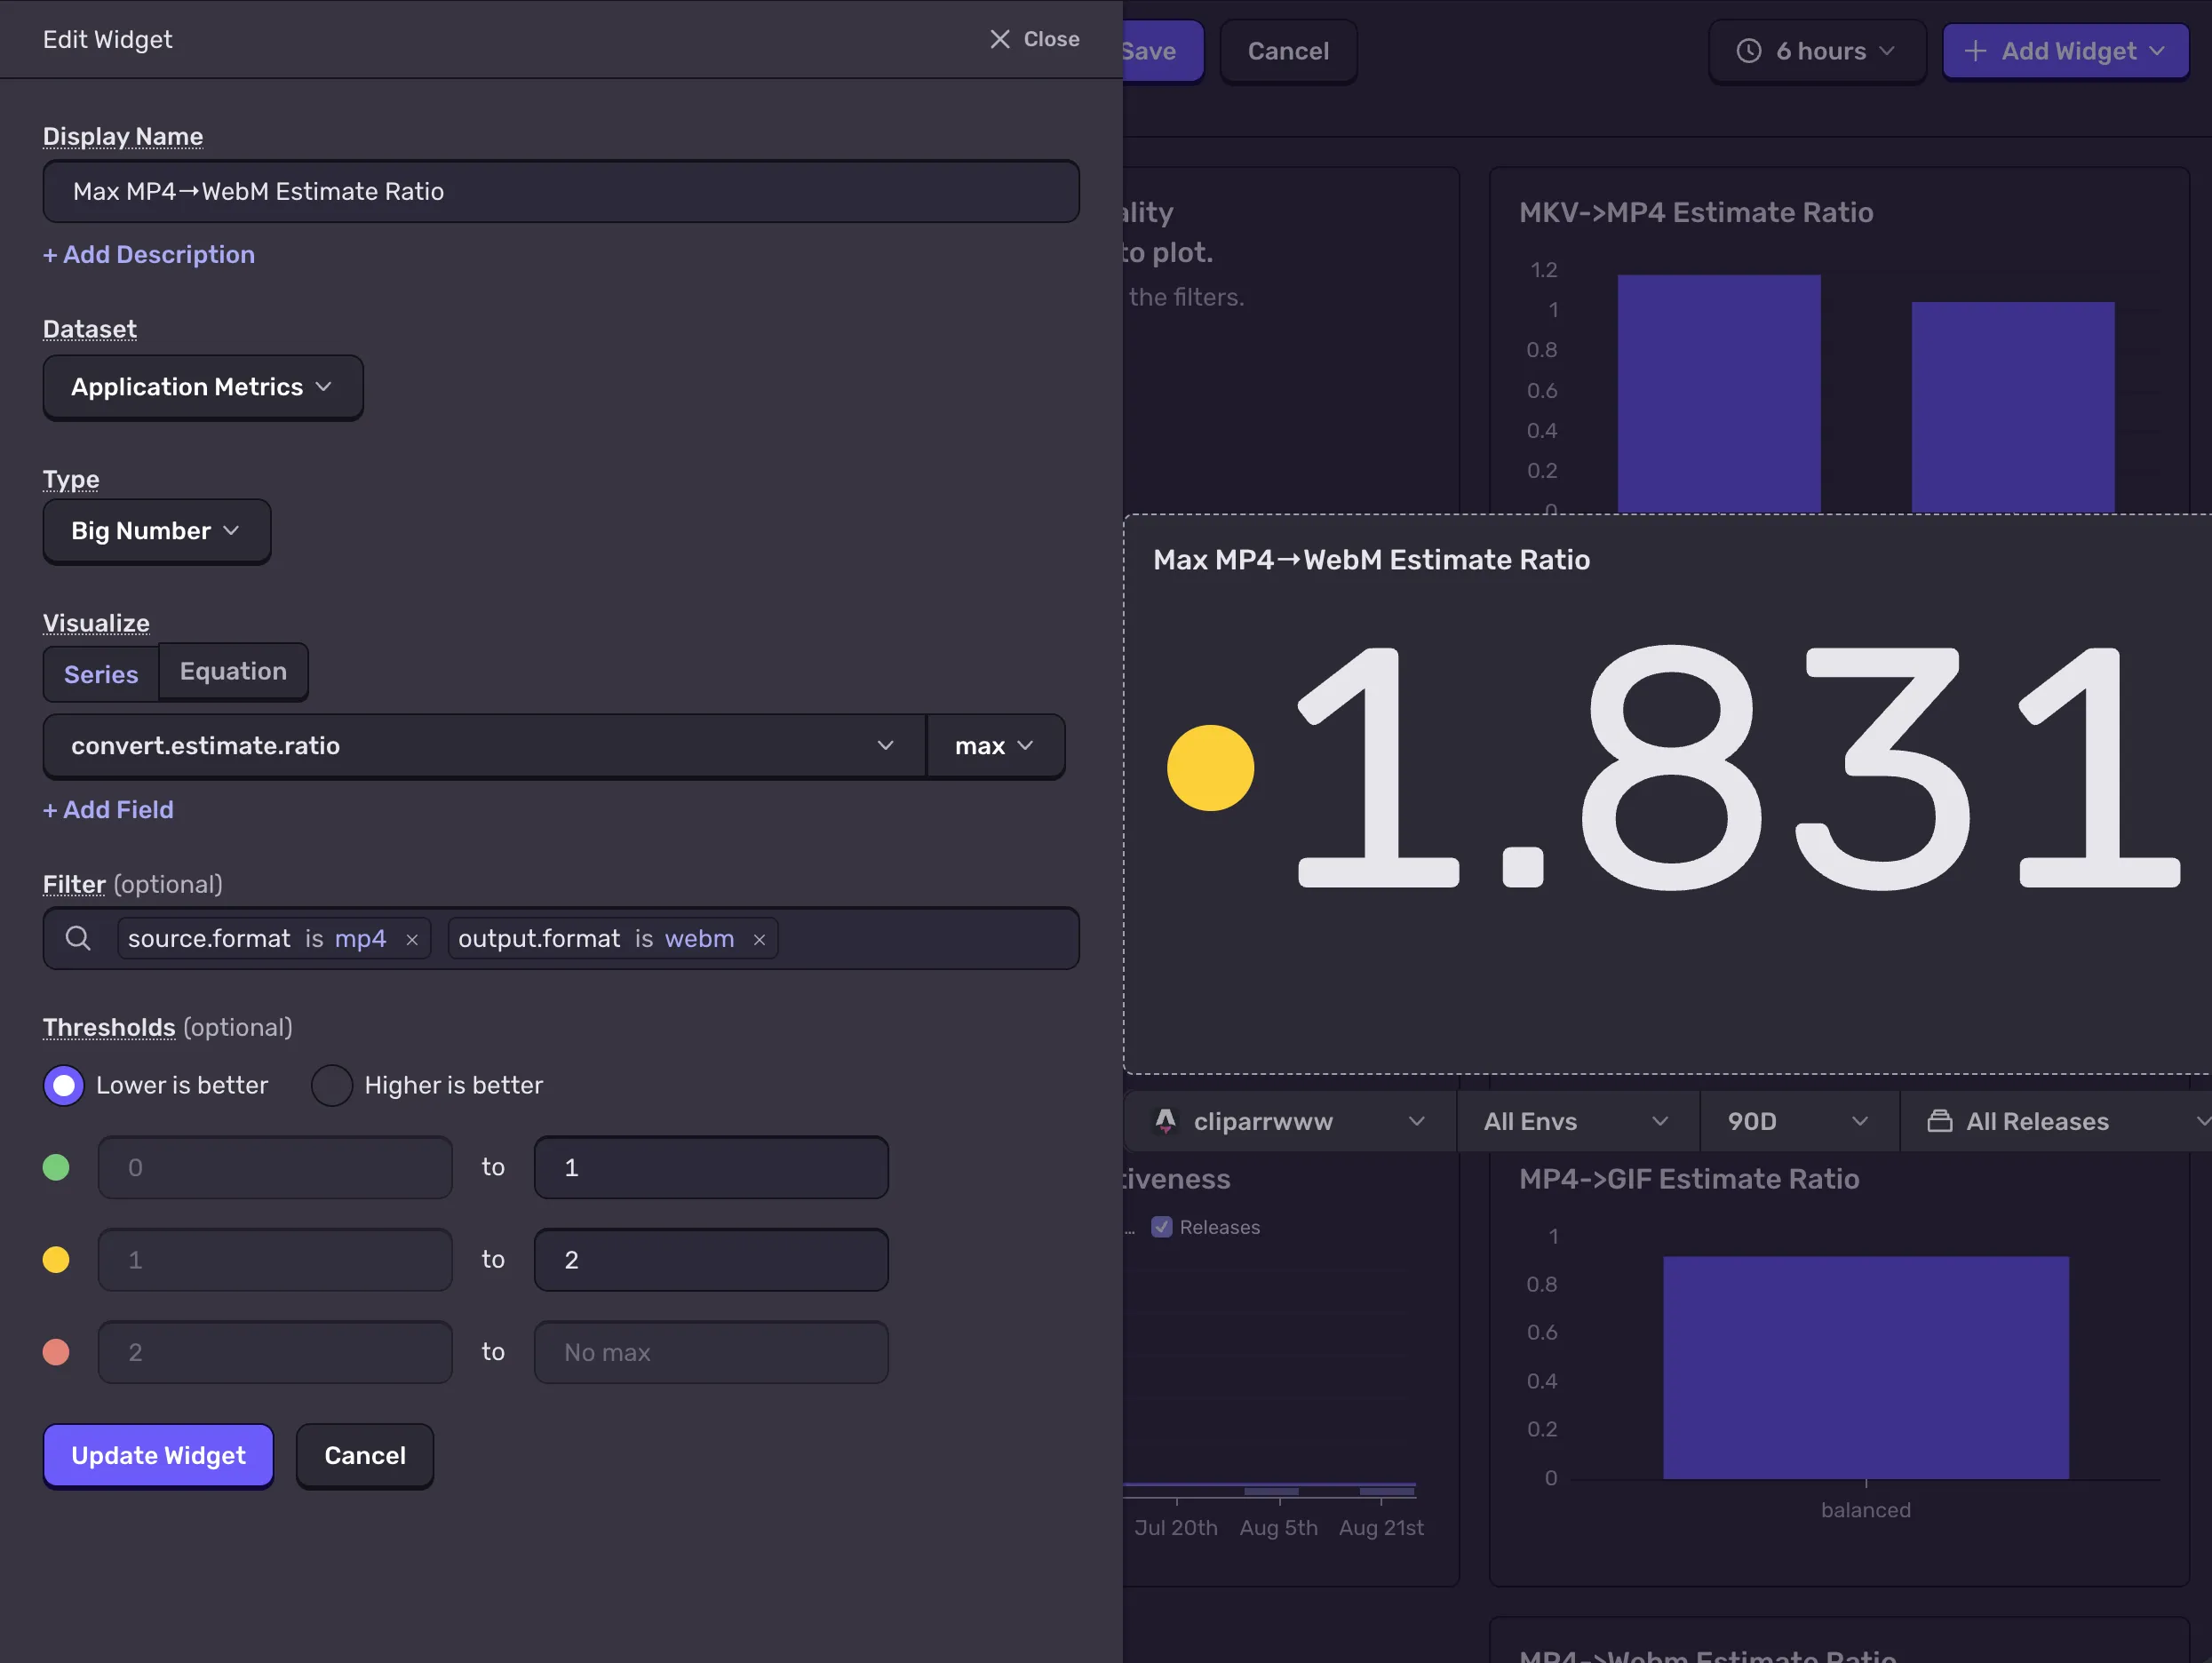
To easily catch those worst-case scenarios, I added a “Max Estimate Ratio” tile to the dashboard for each of the popular conversion workflows, in this case mp4 → webm.
If you’re following along, you can create a new widget in the dashboard, select the Application Metrics dataset, set the type to Big Number,
and under Visualize select convert.estimate.ratio and change the aggregate function from avg to max.
Then add a filter for source.format = mp4 and output.format = webm, if you want separate numbers for each workflow, otherwise you can leave the filters off to just see the overall worst case.
The same dashboard also caught two things I hadn’t gone looking for:
Copy mode over-estimates by ~16%. Cliparr doesn’t always need to re-encode the video, sometimes it can just copy it to a new container. But when copying, Cliparr is still using the transcode estimate. We also recorded the duration of each conversion, which made it obvious what was going on when grouped together. Conversions that didn’t need to re-encode were finishing in under a second, and the finished file was coming out about 16% smaller than the estimate. I can fix this next by adding a separate estimator for copy mode, which just uses the source file’s size.
GIF runs a steady few percent over. GIF estimation happens in a completely different way, but we can see that the estimator is consistently over-estimating by about 9%. We might go in and manually tweak the GIF estimator to see if we can get the average closer to 1.0.
None of these were hypotheses I set out to test. They fell out of grouping one distribution by a couple of attributes.
KPI #2: What are people actually doing?
Assuming we’ll need to focus on improving the estimates in the near future, it would be nice to know which files are most likely to be converted, and what they’ll be converted to. That way, we can prioritize the most common cases first.
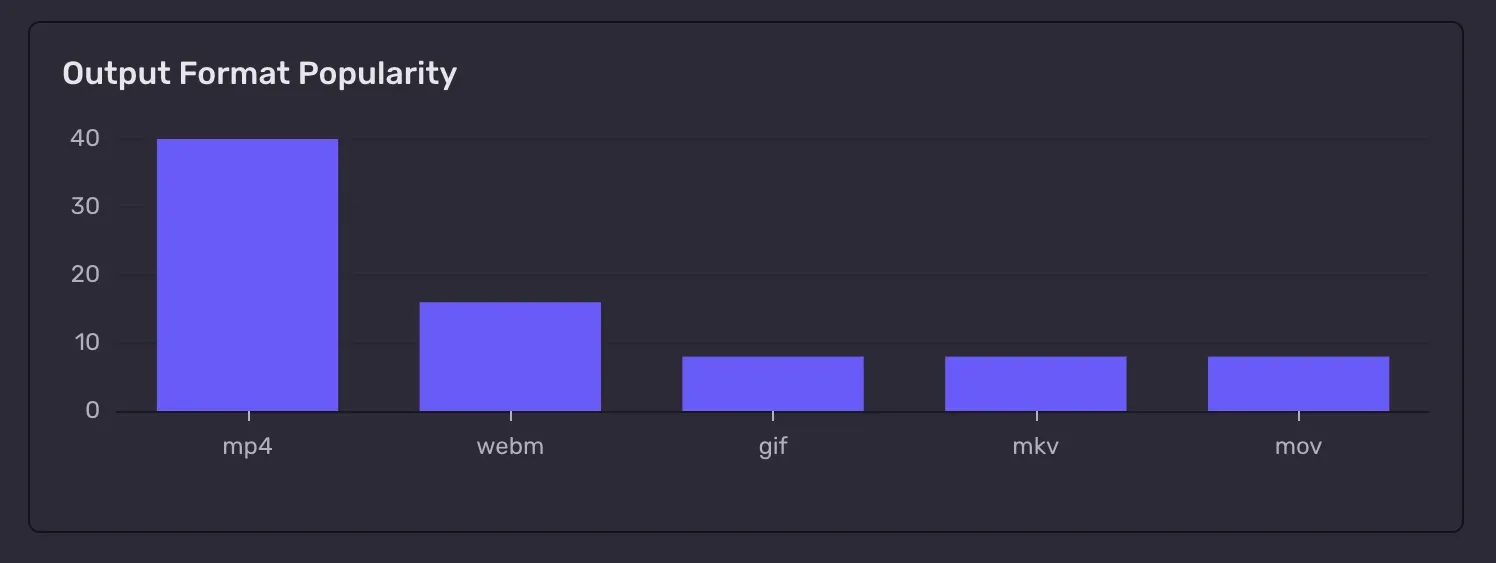
By adding the output format and conversion settings as attributes on each conversion, we can see what people are actually doing in practice:
Output format:mp4 is 2.5x more common than any other format, with webm a distant second and gif, mkv, and mov tied behind it.
Quality and resolution: in this sample size, sharp quality at the original resolution is the most common setting, suggesting people aren’t compressing as much as they’re converting.
Now that I know what users want, I can focus on improving the estimator for the most common use cases first, and keep in mind, when building future features, what people are actually doing with the tool.
Compressing video for chat apps was important to me, but maybe it isn’t to most users. Maybe they just want to convert a video to a different format for compatibility, and don’t care about the size at all.
KPI #3: Is it even working?
Maybe not the most interesting KPI, but clearly an important one: are conversions actually completing?
This tool runs entirely in the browser and is billed as offline and mobile-friendly. Am I being disingenuous?
I do not know how different browsers and devices are handling WebCodecs under the hood.
While we could, and will, track errors in Sentry, it’s also useful to have a historical view of overall success and failure rates, detached from any specific issue.
I’ll use three counters to map out the conversion funnel and see how many conversions are started, completed, and failed:
Sentry.metrics.count("convert.export.started", 1, { attributes });Sentry.metrics.count("convert.export.completed", 1, { attributes });// and, in the catch block:Sentry.metrics.count("convert.export.failed", 1, { attributes });
In my tests, across every conversion in the dataset, convert.export.failednever fired once.
Good news! It is still mostly just me testing right now, but we’re properly set up for the future.
Though right now, because I am not implementing tracing or recording any device information deliberately in the metric itself, if there was an issue, I wouldn’t actually know what device or browser it happened on.
I intentionally started recording the minimum amount of information and can add to it later.
Soon, I will add tracing, which will capture some basic device information, and then metrics and errors in Sentry will be linked together, so I can see which devices are failing and what the errors are.
We’ll leave connecting your metrics to debugging data for another post, but for now, the counters are enough to know the tool is working as intended.
KPI #4: Are people installing it?
The newest KPI that I’m still wiring up: adoption.
Cliparr Convert is installable as a PWA on mobile and desktop, and without any app-store to report on, I don’t have any way natively to know if people are actually installing it.
But, we can track it with metrics.
Installing isn’t a single yes/no, though.
The browser has to decide the app is installable, we have to show the prompt, and the person has to click it, accept it, and actually finish the install, assuming no errors or anything like that.
It is technically possible to drop out at any step, so we track the entire “funnel” with a few counters, and then if there are any issues, we can see exactly where people are dropping out.
convert.pwa.install.prompt.available → the browser is willing to offer itconvert.pwa.install.prompt.shown → we actually showed the promptconvert.pwa.install.clicked → they engaged with itconvert.pwa.install.accepted → they said yes …convert.pwa.install.dismissed → … or they said noconvert.pwa.installed → it landed on their device
Each stage is a counter, tagged with form_factor (desktop vs. mobile) and install_mode (ios vs. native).
Chrome on Android can open a real install prompt, while iOS has no equivalent API, so there it’s a manual “Add to Home Screen” I can only ask the user to follow.
Splitting up the funnel this way will likely show me what I expect, that there will be far less installs on iOS, but it will be good to track, and see if there is anything we can do to improve it over time.
It’s early, and honestly it’s pretty much just me using it now, but everything is wired up and ready to go.
When real traffic arrives, I’ll have a good idea of who is using the tool, on which devices, and how well it’s working for them.
The takeaway
None of this was super fancy or difficult.
I just wired up a few counters and distributions, and added a couple of attributes to each metric to make it easy to group and filter the data later (like by output format, quality, or resolution).
Then, I was able to create the dashboard I wanted, essentially replicating the matrix of formats, codecs, and quality settings I’d once thought about building by hand, without actually running through all the combinations myself.
I did create these dashboard widgets the “good-ol’-fashioned” way, but Sentry’s dashboards can also be created in-app with Seer using a prompt like “create a dashboard showing the average estimate ratio for each output format, grouped by quality setting and resolution,” and it will generate the panels for you.
You also don’t even have to create a dashboard at all. Both in-app and via the MCP server, you can just ask questions about your metrics directly through your agent.
What feels interesting about this going forward to me is just potentially how many questions you can answer by adding relatively few metrics and attributes to your codebase, knowing you don’t have to worry about presentation or reporting right away.
Getting started with Application Metrics
Ten metrics added to your app, each with five attributes, and you can potentially answer hundreds of questions about how users interact with your app, or about your app’s performance, without having to write a single query.
You also don’t even have to create a dashboard at all. Both in-app and via the MCP server, you can just ask questions about your metrics directly through your agent.
If you’re already using Tracing and Logs, Metrics is a natural next step, and getting started takes about as much code as the snippets above. Every Sentry plan, including the free Developer tier, comes with 5GB of Application Metrics, so it costs nothing to start.
Metrics moves your telemetry past just engineering-level debugging into being able to also answer product-level questions: what people are doing, what’s working, and whether a change actually helped.
My AI agent wrote a size estimator that was up to 83% off, and I might not have caught it without monitoring some simple KPIs with Application Metrics. If you have a number that matters to your app, consider whether it belongs in logs or traces, or if it deserves its own metric.
FAQs
When should I use Application Metrics instead of logs or traces? ▾
Reach for metrics when you have a number you intend to alert on: a count, a rate, or a distribution where every measurement matters. Counters, gauges, and distributions are purpose-built for KPIs. Logs are better for investigation and retaining rich context, and traces are better for following a single request through your system, but traces are commonly sampled, so they're a poor fit for KPIs that need accurate totals.
What are counters, gauges, and distributions in Sentry Metrics? ▾
They're the three metric types. A counter tracks how many times something happened (conversions completed, errors thrown). A gauge records a value that rises and falls at a point in time (queue depth, active users). A distribution records the spread of many measurements so you can read percentiles like p50 and p90, ideal for latency, or, in this case, estimate accuracy.
Do Sentry Application Metrics get sampled like traces? ▾
By default, no. Metrics capture every measurement, while traces are commonly sampled, meaning you keep only a fraction of spans. That makes metrics a better fit for counts, rates, and distributions where every event matters. A success rate or a rare-failure count computed from sampled data can miss exactly the events you care about.
We moved Android SDK operations to a worker isolate, then streamlined scope updates by removing duplicate normalization and encoding JSON directly into UTF-8 bytes.
The back/forward cache is one of the most impactful performance features on the web and one of the least observable, because success looks like silence. Here's how we made it measurable.