
← Back to Blog Home


How to evaluate session replay software: a developer's guide
Session replay software lets you see exactly what your users saw without having to pull a Freaky Friday with your customer. The question is: which tool actually delivers on that for your team, your stack, and your regulatory environment?
This guide covers the architectural decisions that separate session replay tools: how they capture data, where they mask it, how they connect to your error monitoring, what overhead they add, whether their data is consumable by AI debugging agents, and how they handle mobile.
Not all session replay tools are built for the same job
It can help to think of session replay software as falling into two categories:
-
UX analytics tools are built for Product Managers and UX researchers trying to understand how users navigate a product: where they click, where they drop off, what confuses them. These tools optimize for rich visual playback and quantitative analysis like heatmaps, funnel analysis, and engagement metrics.
-
Developer debugging tools are built for engineers. The question isn’t “where do users get confused” but “what state was the application in when this error occurred, and what did the user do to get there?” These tools optimize for replay-error correlation.
Before evaluating any specific tool, figure out which of these categories your use case falls into, then pressure-test whether the tool was actually built for it. Gorgeous heatmaps with weak error integration won’t help an engineering team trying to debug production incidents.
Recording methodology: DOM snapshots vs. pixel capture
There are two dominant approaches to recording a session replay. Both have meaningful architectural consequences.
-
DOM snapshot + mutation recording captures an initial snapshot of the DOM, then records every subsequent mutation (element changes, attribute updates, user events) as a stream of structured events. To replay a session, the tool reconstructs the DOM from the initial snapshot and replays the mutations in sequence. This is how open-source libraries like rrweb work, and it’s the approach Sentry uses.
-
Pixel capture takes periodic screenshots or video frames of the rendered page. The output looks like a screen recording.
The tradeoffs run in opposite directions. DOM-based replay is more compressible and more privacy-friendly. Because you’re recording structured events rather than pixels, sensitive data can be redacted at the SDK level before it leaves the browser, and the event stream compresses to a fraction of the size of equivalent video frames. The structured format is also what enables deeper debugging workflows, from integrating replay with error monitoring to querying sessions at scale and feeding data to AI agents.
Pixel capture, on the other hand, handles complex CSS, canvas elements, and third-party iframes more faithfully than DOM serialization. If visual fidelity is the primary requirement, like your design team needs pixel-perfect playback of complex animations, pixel capture wins on accuracy.
Privacy architecture: where data gets masked matters
There are two points where a tool can mask sensitive data: at the SDK (before data leaves the user’s browser) or at ingestion (after the data reaches the provider’s servers).
-
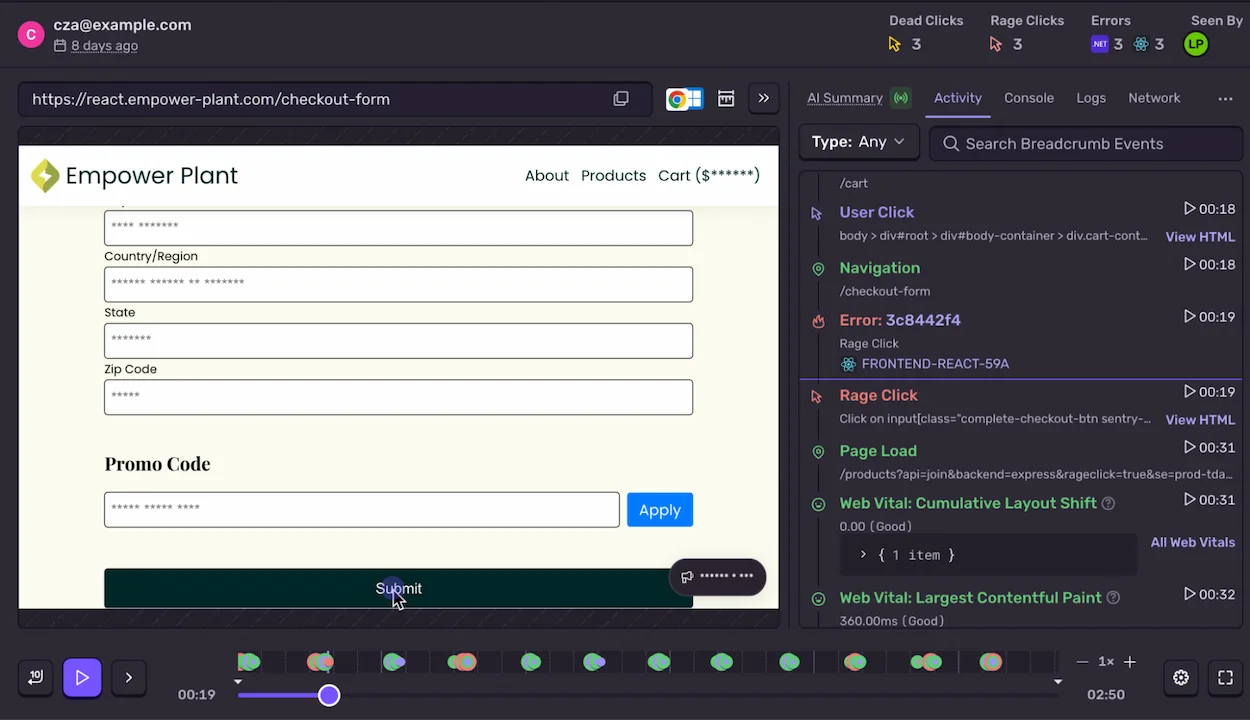
Client-side masking happens before data is ever transmitted. The SDK intercepts DOM mutations and applies masking rules locally, either redacting specific elements you’ve flagged or defaulting to masking everything and requiring explicit opt-in for fields you want to capture.
-
Server-side scrubbing happens after data reaches the provider’s servers. This has real advantages: scrubbing rules can be updated without SDK deployments, the tool can apply more sophisticated pattern matching than client-side SDKs typically support, and it adds a useful second pass even on top of client-side masking. The tradeoff is that data travels to the provider before it’s scrubbed, meaning a data transfer event has already occurred. For applications subject to strict data regulations like GDPR or HIPAA, that distinction often matters.
The default posture matters as much as the capability. A tool that defaults to capturing everything puts the burden on every engineer who touches a form or input field to correctly tag it, for as long as the application runs. A tool that defaults to masking everything requires explicit opt-in. There’s more friction upfront, but it’s typically safer at scale. Neither is universally right; it depends on which default fits your team’s workflow and risk tolerance.
For GDPR compliance: even with client-side masking, you’ll still need consent mechanisms, data residency controls, and a data processing agreement with your vendor. Check whether the tool supports EU data residency if that’s a requirement. Not all do, and some only offer it on higher pricing tiers.
One more consideration worth raising with your security team: where the SDK is hosted. An open-source SDK your team can audit and optionally self-host is meaningfully more transparent than a closed-source snippet loaded from an external CDN. If you’re in a security-conscious environment, this distinction will come up during vendor review.
Integration depth: standalone replay vs. contextual debugging
How much integration depth matters depends on what you’re using replay for. For product teams running behavioral analysis, a standalone replay tool works well on its own. For engineering teams debugging production issues, it’s probably the most important criterion on this list (no pressure).
- With a standalone tool, finding the replay for a given error means searching by timestamp in a separate product and hoping you land on the right session.
- With native integration, you click through from the error directly to the replay, with the network requests, console errors, and breadcrumbs already surfaced in the same context. No separate investigation, no tab-switching.
In Sentry, a production error issue automatically surfaces the associated session replay without any custom instrumentation. The trace ID from your backend carries through to the frontend replay, and you can move between the error, the trace, and the replay without leaving the tool or copying IDs. Tools that connect via webhooks and custom event tagging can get close, but require setup and ongoing maintenance when either system changes.
Pay to play: performance overhead and sampling
There’s no such thing as a free render. Session replay adds real performance overhead across CPU, memory, and network. How much varies depending on DOM complexity, mutation frequency, and how aggressively the SDK compresses and batches data.
That variability is exactly why you should benchmark on your own application rather than relying on vendor-provided numbers run on simple demo pages. We published a methodology for measuring session replay overhead across CPU, memory, and network dimensions, which gives you a practical framework for running your own measurements.
You can balance performance and coverage by adjusting sample rates. Recording 100% of sessions is expensive and usually unnecessary. Most tools support a few strategies:
- Random sampling: Record a fixed percentage of all sessions. Simple, but you might miss rare bugs that surface in only a small fraction of traffic.
- Error-based sampling: Always record sessions where an error occurred. This captures high-value debugging context without recording every routine session.
- Session-length thresholds: Only record sessions above a minimum duration, filtering out bounced sessions with little diagnostic value.
The most effective configuration for engineering teams: record a small random sample for baseline analysis, but always capture full replays when an error fires. Additionally, consider adding replays to critical experiences like checkout flows, or new features. Sentry’s sampling strategy guide covers the mechanics of setting this up.
What AI agents need from your session replay tool
As AI-assisted debugging matures, a new question is worth adding to your evaluation checklist: can your replay data be consumed by machines?
The answer depends almost entirely on recording methodology.
-
Pixel-capture replay stores video frames. If an AI agent needs to analyze a session, it has to work from images, which limits what it can extract. It can’t parse event sequences programmatically, trace user actions to specific code paths, or correlate what happened in the UI with what was happening on the backend.
-
DOM-based replay produces structured event data instead: a timestamped stream of DOM mutations, user inputs, network requests, console messages, and breadcrumbs. An AI agent can analyze that event stream directly, identify anomalous sequences, retrace a bug’s preconditions, or correlate user behavior with a backend error trace.
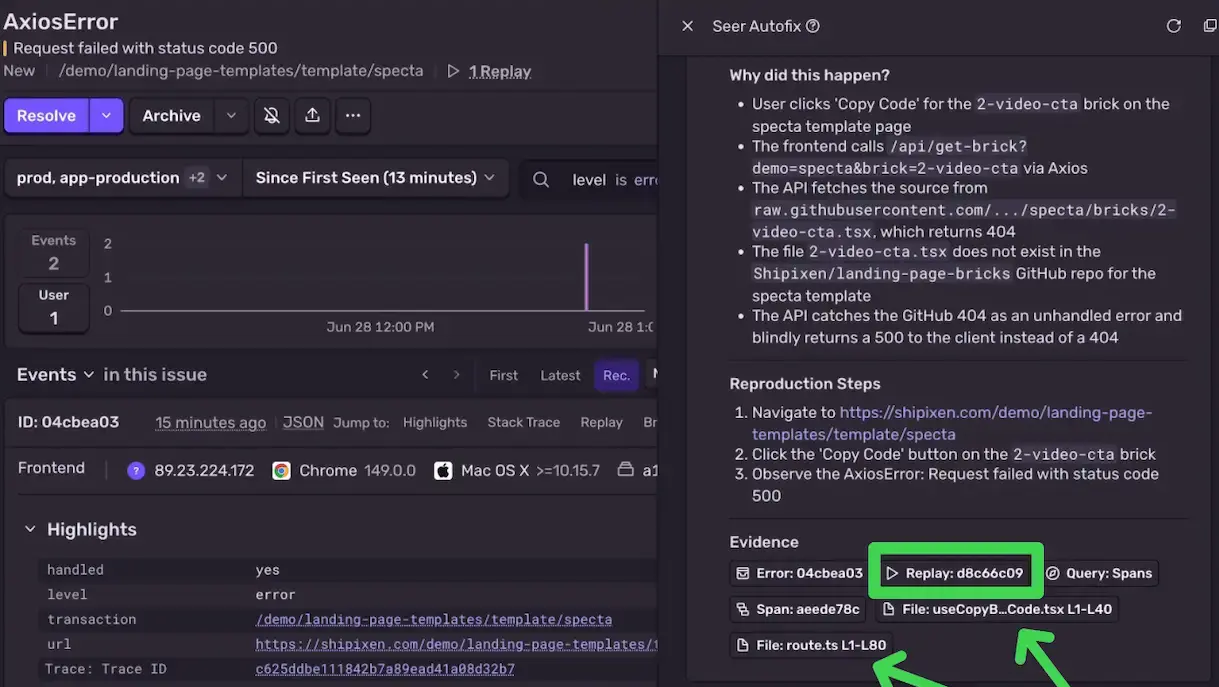
Sentry’s replays already include an AI-generated summary of the user’s session, and Seer can analyze the underlying event data to suggest a likely root cause when an error occurs. Whether other tools can build similar capabilities depends on whether their replay data is structured enough to support it.
When evaluating tools, check whether replay data is accessible via a structured API and whether individual replay events are exportable.
Mobile support: is the tool cross-platform or cross-platformish?
Session replay on mobile is a different technical problem than on the web. Rather than serializing a DOM, mobile SDKs record native view hierarchies, touch events, and gesture sequences, and the implementations vary significantly across tools in terms of coverage, fidelity, and stability.
If your application has meaningful mobile traffic, answer these questions before committing:
- Does the tool have native iOS and Android SDKs, or only React Native and Flutter wrappers?
- How does the mobile SDK handle masking? Mobile apps commonly handle sensitive data like financial transactions, health information, and authentication flows, and mobile masking implementations are generally less mature than their web equivalents.
- Can you correlate mobile sessions with backend errors the same way you can on web?
- What’s the measured overhead on mobile? Battery and CPU constraints are more significant than on desktop, and recording native view hierarchies is not lightweight.
Mobile replay is a newer capability for most tools, so look beyond “yes, we support mobile” in the documentation. Find example replays from production iOS or Android sessions if you can, and verify whether mobile sessions link to backend errors and traces the same way web sessions do.
Making the call
Different teams will weigh these criteria differently. A few questions to drive the decision:
- Is the primary consumer of replay data engineers, product managers, or both? (This determines whether debugging integration or analytics depth matters more.)
- Do you operate under GDPR, HIPAA, or other data regulations that make server-side scrubbing a no-go?
- Does your team already use an observability platform? If so, does your replay vendor integrate natively, or is it a bolt-on?
- What percentage of your traffic is mobile, and do you need to debug native mobile sessions?
Use the checklist below to pressure-test any tool against the criteria that matter for your team:
| Criterion | Key question | What to look for |
|---|---|---|
| Recording methodology | How does the SDK capture data? | DOM-based for debugging and privacy; pixel capture only if visual fidelity is the priority |
| Privacy architecture | Where does masking happen, and what’s the default posture? | Client-side masking with mask-by-default for regulated environments |
| Integration depth | Is replay native to your observability platform? | Native pipeline integration vs. webhook-based connection between separate data stores |
| Performance overhead | Has the vendor published methodology for measuring overhead? | Benchmark on your own application, not a demo |
| AI-readability | Is replay data accessible via a structured API? | Exportable event streams, not just video playback |
| Mobile support | Are there native iOS and Android SDKs? | Native SDKs; find real production replays before committing |
If debugging is your primary use case, look for a tool native to your observability stack that masks data by default and links errors to replays automatically. Sentry’s session replay was built around those criteria. If UX research is the priority, a dedicated analytics tool will likely serve you better.
The decision that costs most teams is skipping past the architectural choices: how data is recorded, where it’s masked, whether it connects to your error context. Those are what determine whether session replay actually helps you ship more reliable software, or just gives you another tool to ignore during an incident.
Learn more: