Introducing OpenTelemetry Support: Take Action on Your Observability Data
Introducing OpenTelemetry Support: Take Action on Your Observability Data
As an open source company that grew out of a side project in 2008 to an application and performance monitoring platform (APM) used by over 3.5 million developers, Sentry is committed to open source and the community of developers maintaining and building in the open.
Similarly, we take a public approach to building our software, which is why it’s a natural extension of our values to announce our support for OpenTelemetry (or OTel), the leading open standard for observability. Thousands of companies use OpenTelemetry to capture data across their services, but capturing raw logs, traces, and metrics is only the first step in improving software performance.
Developers with OpenTelemetry can now use Sentry’s modern APM - a tool that’s actually built for them - to make their observability data actionable.
With support now generally available for Golang, Node.js, Python, Ruby, Java, and .NET coming soon, you can combine the power of Sentry with the performance data from your OpenTelemetry instrumented applications to get down to the line of code or function causing the issue. No more sifting through data or going between tools - just see the answers you need to get to the fix faster.
Getting started with OpenTelemetry and Sentry
As a developer-first tool, Sentry makes it a breeze for you to get up and running so you can write more code and focus less on complex instrumentation and months-long projects. With the OpenTelemetry integration that’s no different - all you have to do is add a few lines of code to your software, and you'll start seeing telemetry data in Sentry right away.
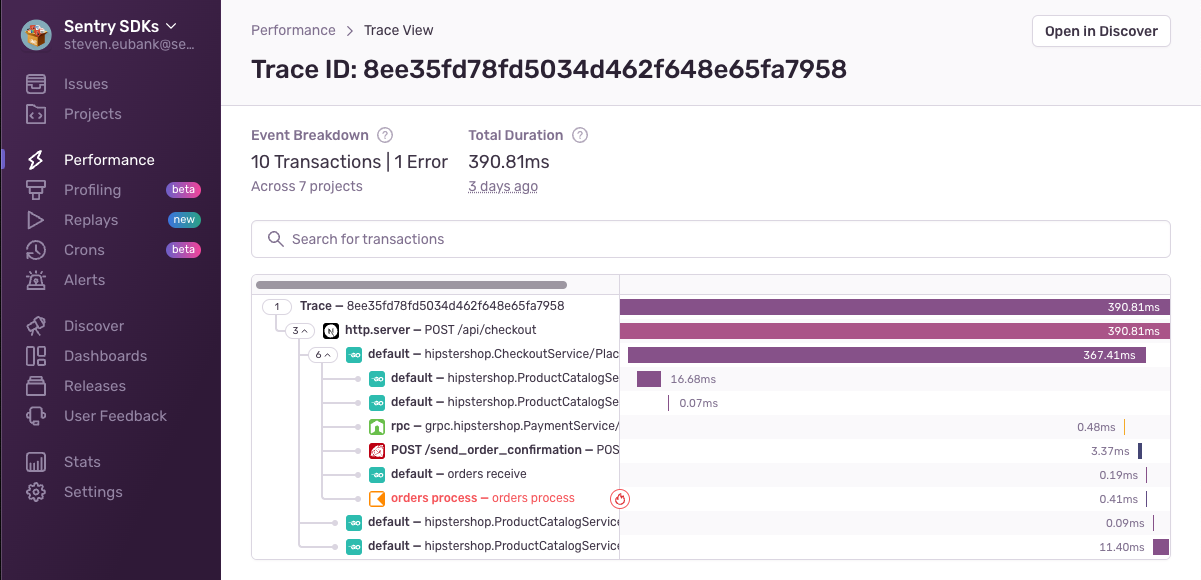
Once set up, you’ll automatically start tracing slow-loading pages and request all the way back to the API calls and Kafka queues that cause the problems. Further, if there are any related errors, Sentry surfaces those too and connects them with errors that may happen along the way, giving you all the context you need to fix the issue quickly. It's like having a GPS for your software, guiding you straight to the source of the problem.
Getting started with Sentry and OpenTelemetry was fast and easy. We chose Sentry because we can understand why and where something is slow, fix it quickly, and get ahead of user complaints.
Dominik Sandjaja Senior Software Engineer @ bex technologies GmbH
Fix your software faster with OTel and Sentry
Your customer gets to your checkout page to place an order 💰. On the surface, everything worked fine, but a silent crash caused by an errors.errorString (aka invalid product ID) breaks the checkout flow leaving your customer mashing the order button and writing an angry social post 💸.
With automatic grouping, you’ll see an issue in your feed grouping all unique instances together. Then using the traces and spans from OTel, it connects that error to the related distributed services which caused the problem. Once the issue is identified, with the deep Git integration, you can also see which team or engineer owns the code for those distributed systems and route it to them to work on a fix and ship to production - without even talking to anyone 🪄
To learn more about Sentry’s OpenTelemetry support, sign up for our upcoming AMA to get all your questions answered from the team building it.
We’d also love to hear from you in GitHub or email us directly at otel@sentry.io to share your thoughts and feedback.
And if you’re new to Sentry, you can try it for free today or request a demo to get started.


