Session Replay: Debug Faster without the Guesswork
Session Replay: Debug Faster without the Guesswork
As developers, we know that debugging can be a time-consuming process. Hunting down elusive bugs or trying to reproduce an issue based on vague user reports can turn a simple fix into an hours-long journey. While leveraging logs, metrics, and tracing to reproduce locally or try to understand what happened can help us identify a root case, we’re often missing a critical component to truly being able to understand the impact on our users.
Enter Session Replay — an essential tool for speeding up the debugging process by giving you a video-like replay of user sessions. Without needing users to report anything, half-baked repro steps, or a dev environment that perfectly matches all of your users, Session Replay allows you to see exactly what went wrong and when.
Let’s dive into how Sentry’s Session Replay works and why it can become your secret weapon for more efficient debugging, reduced back-and-forth with users, and overall better application performance monitoring.
What is Session Replay?
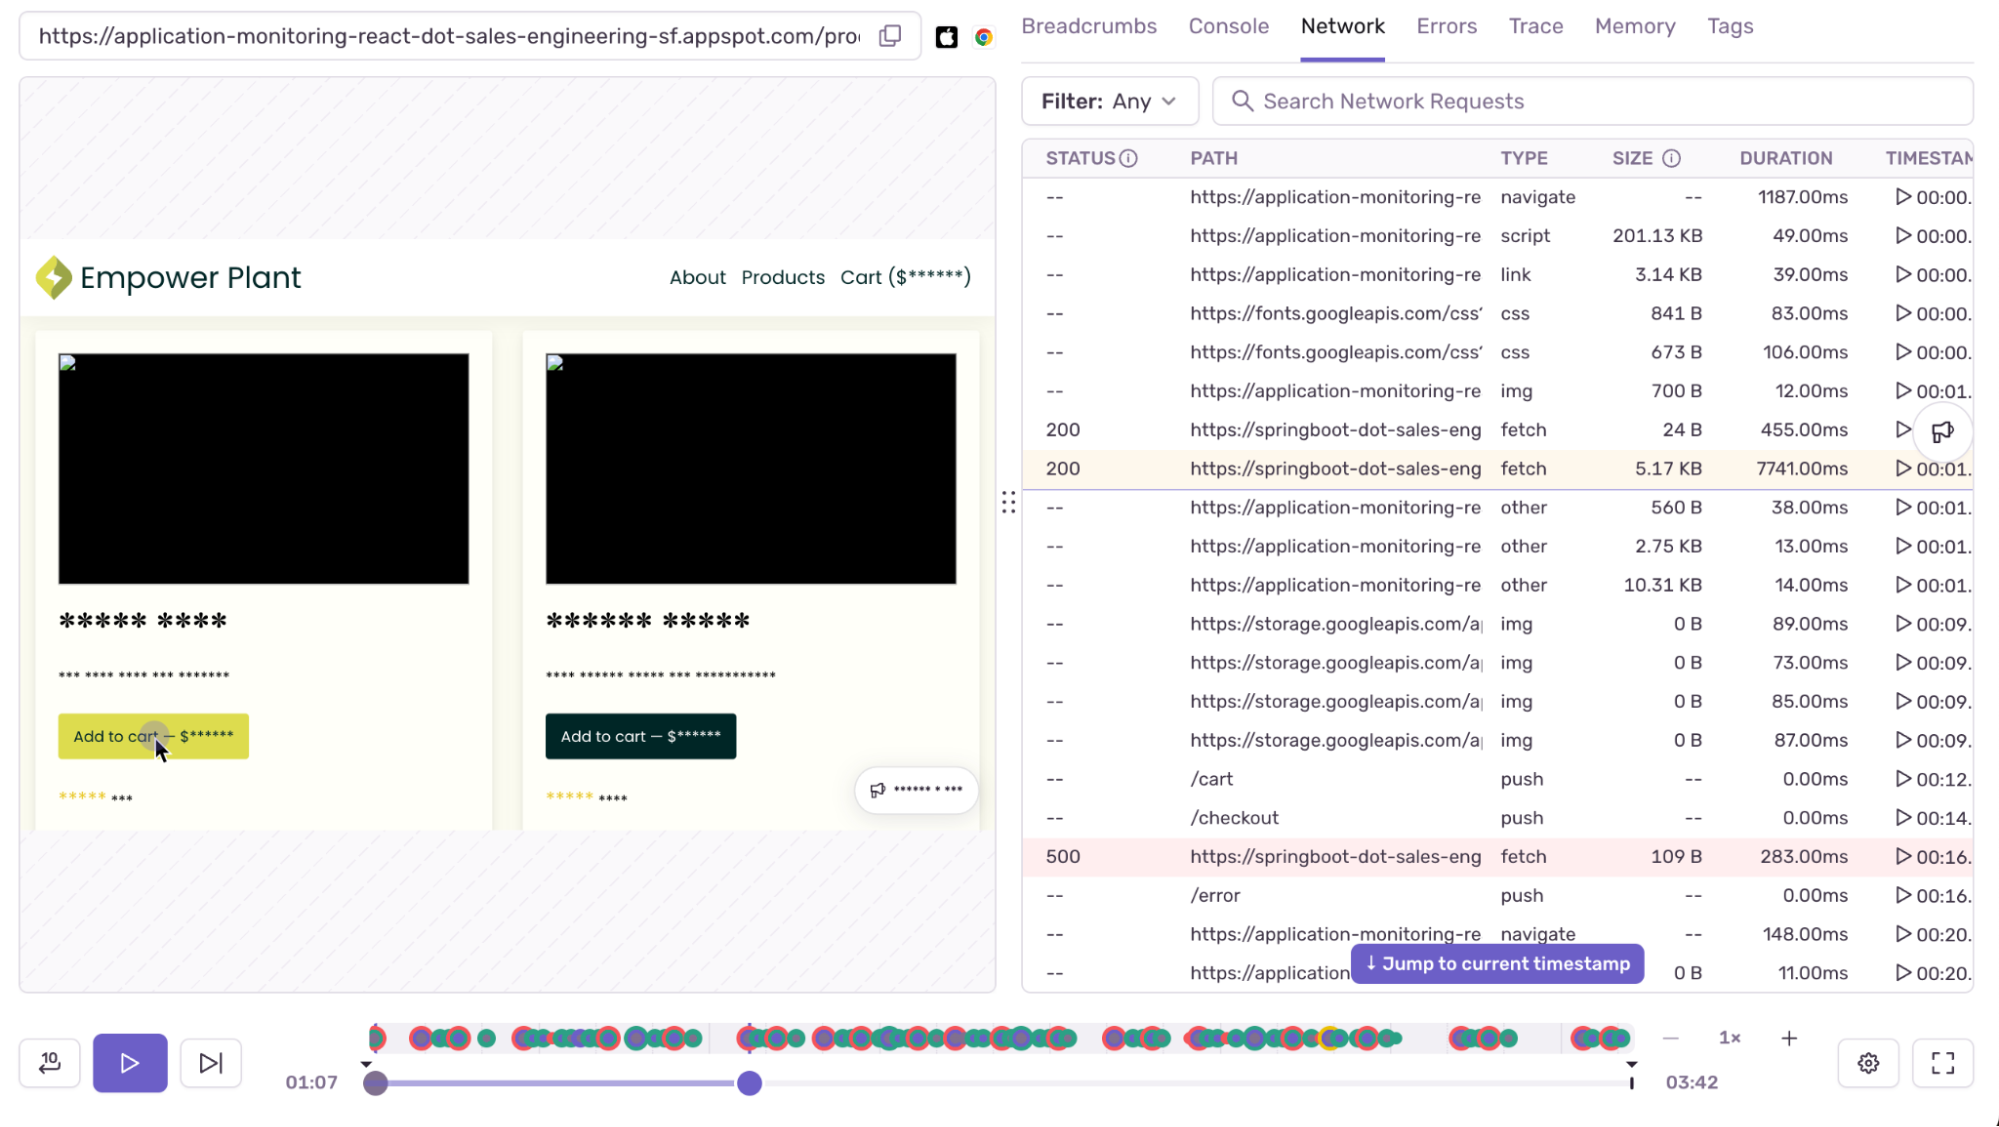
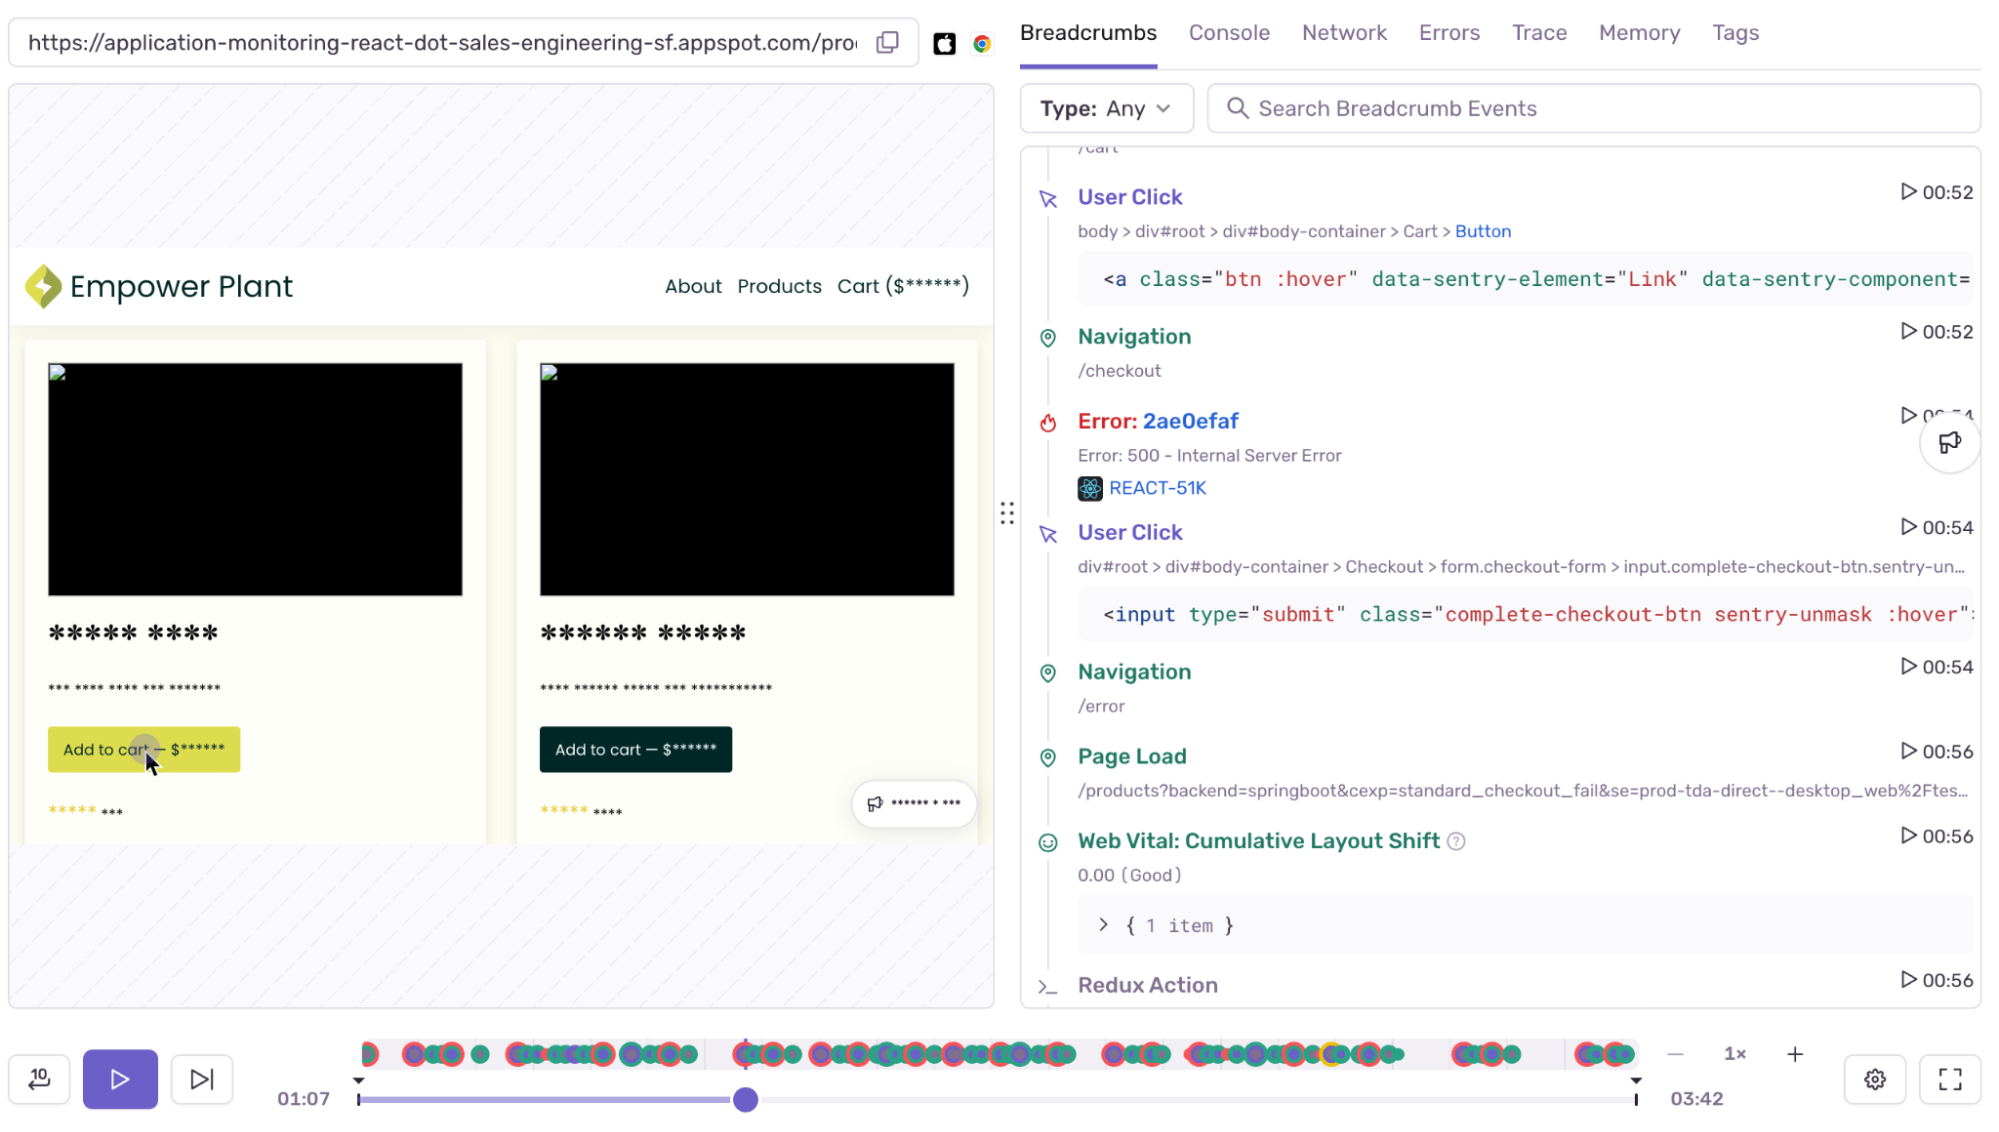
Imagine having the ability to watch a real-time video of your application as users interact with it, including seeing the exact sequence of events that led to a crash or performance issue. Session Replay does exactly that—it captures a user’s session (including clicks, scrolls, and input fields) and presents it alongside network activity, console logs, error details, and even Core Web Vitals. This gives you full visibility into the events leading up to an issue, eliminating the guesswork from troubleshooting.
Session Replay is particularly useful when traditional tools like stack traces and logs don’t give you enough context to reproduce or fully understand a bug. By seeing the steps the user took and how the app responded, you can pinpoint the problem much faster.
Why developers should use Session Replay
The benefits of Session Replay are somewhat dependent on you, your team, your users, and your application. However, there are some key ways replays improve the developer and user experience that are universally beneficial.
Session Replays enable faster debugging
How many times have you had to ping users for more details when an error report comes in? Whether it’s asking them to describe the issue more clearly, upload a screen recording, or capture network logs, this back-and-forth eats into your time. With Session Replay, you can skip all that. You immediately get a clear, video-like reproduction of the user’s actions leading up to the error, often before a user even reports the issue themselves.
Learn more:
Session Replays offer effortless reproduction of complex bugs
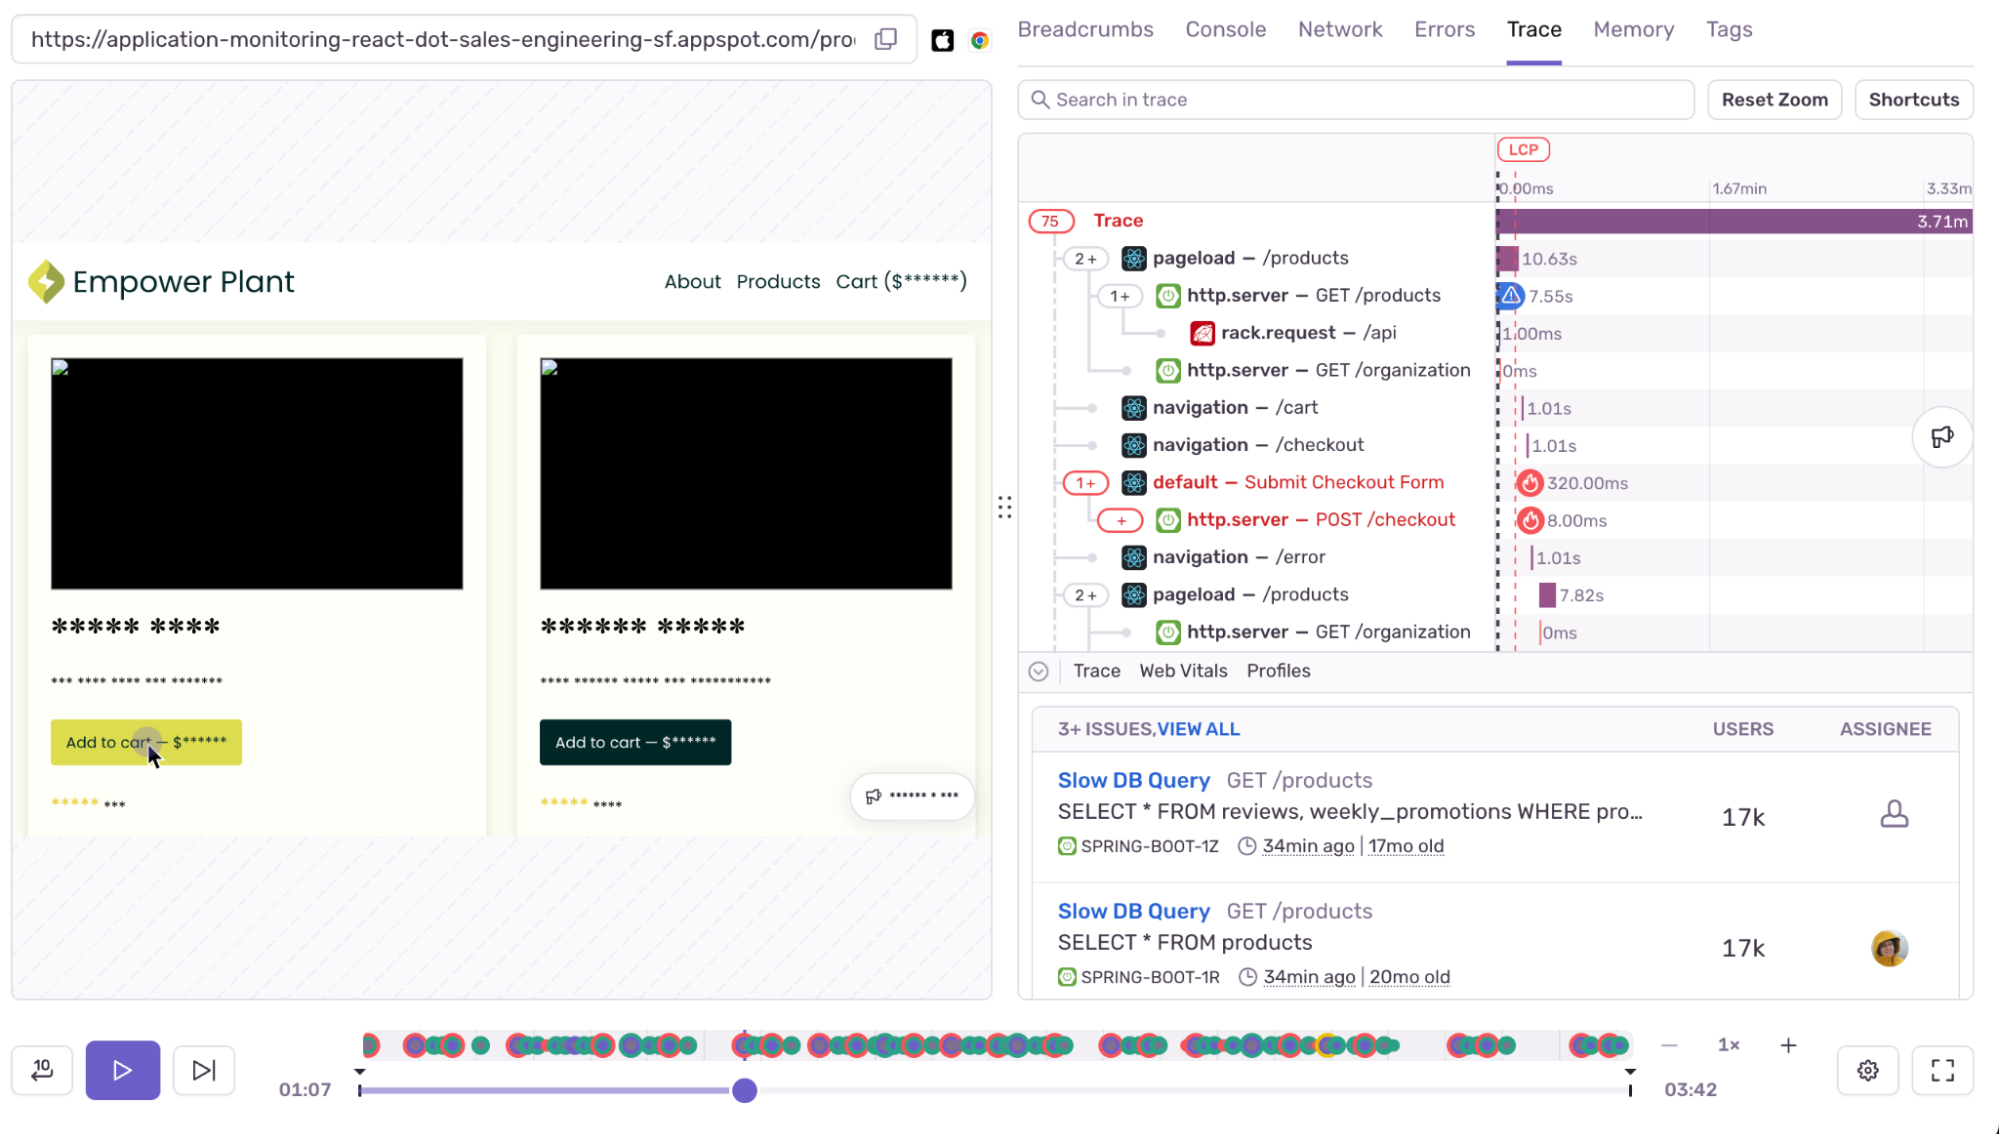
Reproducing bugs—especially ones that only happen sporadically—can be maddening. Complex bugs, often involving a combination of frontend and backend failures, can take hours to isolate and reproduce. Sentry’s Session Replay automatically captures these moments in real-time, allowing you to see which UI interactions caused a backend failure or API request issue.
Learn more:
Session Replays give end-to-end visibility
When paired with Sentry’s tracing features, Session Replay offers an end-to-end view of issues—from frontend clicks to backend API calls. For example, if a slow API is affecting user experience, Session Replay shows the exact moment users are impacted, and with Sentry’s network traces, you can track down slow server responses or misconfigured endpoints.
Learn more:
Session Replays help improve the user experience
Fixing bugs quickly is one thing; proactively catching issues before they become widespread is another. Session Replay gives you insights into how users interact with your app. You can identify areas where users are getting stuck or experiencing performance issues, allowing you to proactively fix them. This can turn frustrated users into happy ones and prevent them from abandoning your app.
Learn more:
Privacy concerns? Covered.
When working with user session data, privacy is a top concern. Session Replay is built with privacy-first principles in mind. You can easily control what data is captured, such as obfuscating sensitive information (like personal details in forms), ensuring you maintain user trust while debugging effectively. The tool gives you fine-grained privacy controls out-of-the-box, meaning you can strike the perfect balance between visibility and privacy.
For example, if you're working on a static website that's free of personally identifiable or other types of private data, you can opt out of the default text masking and image blocking by configuring the maskAllText and blockAllMedia configuration options, respectively:
Sentry.replayIntegration({ // NOTE: This will disable built-in masking. Only use this if your site has no sensitive data or if you've already set up other options for masking or blocking relevant data, such as 'ignore', 'block', 'mask' and 'maskFn'. maskAllText: false, blockAllMedia: false, });
How to get started with Session Replay
One of the best things about Session Replay is how easy it is to get up and running. The integration is as simple as adding the appropriate Sentry SDK to your frontend. For example, if you have a Next.js frontend, you would just run the wizard:
npx @sentry/wizard@latest -i nextjs
You can then customize Session Replay specifically to control session capture rates and configure privacy settings, all without adding significant performance overhead to your app. This is just a couple of lines in your sentry.client.config.ts file:
import * as Sentry from "@sentry/nextjs";
Sentry.init({
  dsn: [YOUR_DSN],
  // This sets the sample rate to be 10%. You may want this to be 100% while
  // in development and sample at a lower rate in production
  replaysSessionSampleRate: 0.1,
  // If the entire session is not sampled, use the below sample rate to sample
  // sessions when an error occurs.
  replaysOnErrorSampleRate: 1.0,
  integrations: [
    Sentry.replayIntegration({
      // Additional SDK configuration goes in here, for example:
      maskAllText: true,
      blockAllMedia: true,
    }),
  ],
});
NOTE: While you're testing, we recommend that you set replaysSessionSampleRate to 1.0. This ensures that every user session will be sent to Sentry. But once testing is complete, we recommend lowering this value in production. We still recommend keeping replaysOnErrorSampleRate set to 1.0, so that, whenever possible, every error has an associated replay with additional debugging context.
TL;DR Session Replay setup
Install the Sentry SDK: You’ll first want to make sure Sentry is set up in your project. Once that’s done, adding Session Replay is as simple as including the integration in your client config file.
Configure Privacy Settings: Use Sentry’s built-in privacy tools to obfuscate sensitive data like input fields or personal identifiers. This ensures you stay compliant with data protection regulations while still getting the insights you need for debugging.
Monitor Sessions: Once Session Replay is enabled, you’ll start getting video-like reproductions of user sessions alongside errors, performance issues, and network traces. Use this information to speed up debugging, isolate the root cause of issues, and improve user experience.
Debug faster with Session Replay
In a world where developers are expected to deliver high-quality applications faster than ever, Session Replay is essential. Whether you’re a frontend engineer debugging complex UI issues or a full-stack dev trying to tie together frontend interactions with backend API performance, Session Replay can help you close the gap between bug reports and fixes. By reducing the time spent reproducing bugs and enhancing the visibility of issues, Sentry lets you focus on building better software.
If you haven’t tried it yet, take a few minutes to integrate Session Replay into your app and experience the difference it makes in your workflow. Debug faster, debug smarter.
Ready to get started? Sign up for Sentry and start debugging with Session Replay.


