Fixing Native Apps with Sentry
Fixing Native Apps with SentryWhether it’s a computer game, IoT device, or high-performance backend, chances are you’re using a native language to develop this application. Hands down, by far the most popular choices today for native application development are C and C++. Okay, maybe not the most popular, but definitely the most prevalent. Some might even say "inevitable."

Equally inevitable, unfortunately, is the occasional application crash; "segmentation faults" and "bus errors" are likely no stranger to you. Here's a look at how you can use Sentry to detect these crashes and fix them in no time.
Choose the right client
First, pick a client that captures crash reports and sends them to Sentry. For a long time, Sentry has supported the popular Google Crashpad and Google Breakpad libraries. If your application already uses one of these libraries, or you are familiar with how to set them up, you're all set. Simply set the upload URL to our minidump endpoint and see crashes coming in.
With our brand-new Native SDK, you have an even better choice. It comes in three distributions that perfectly adjust to your needs:
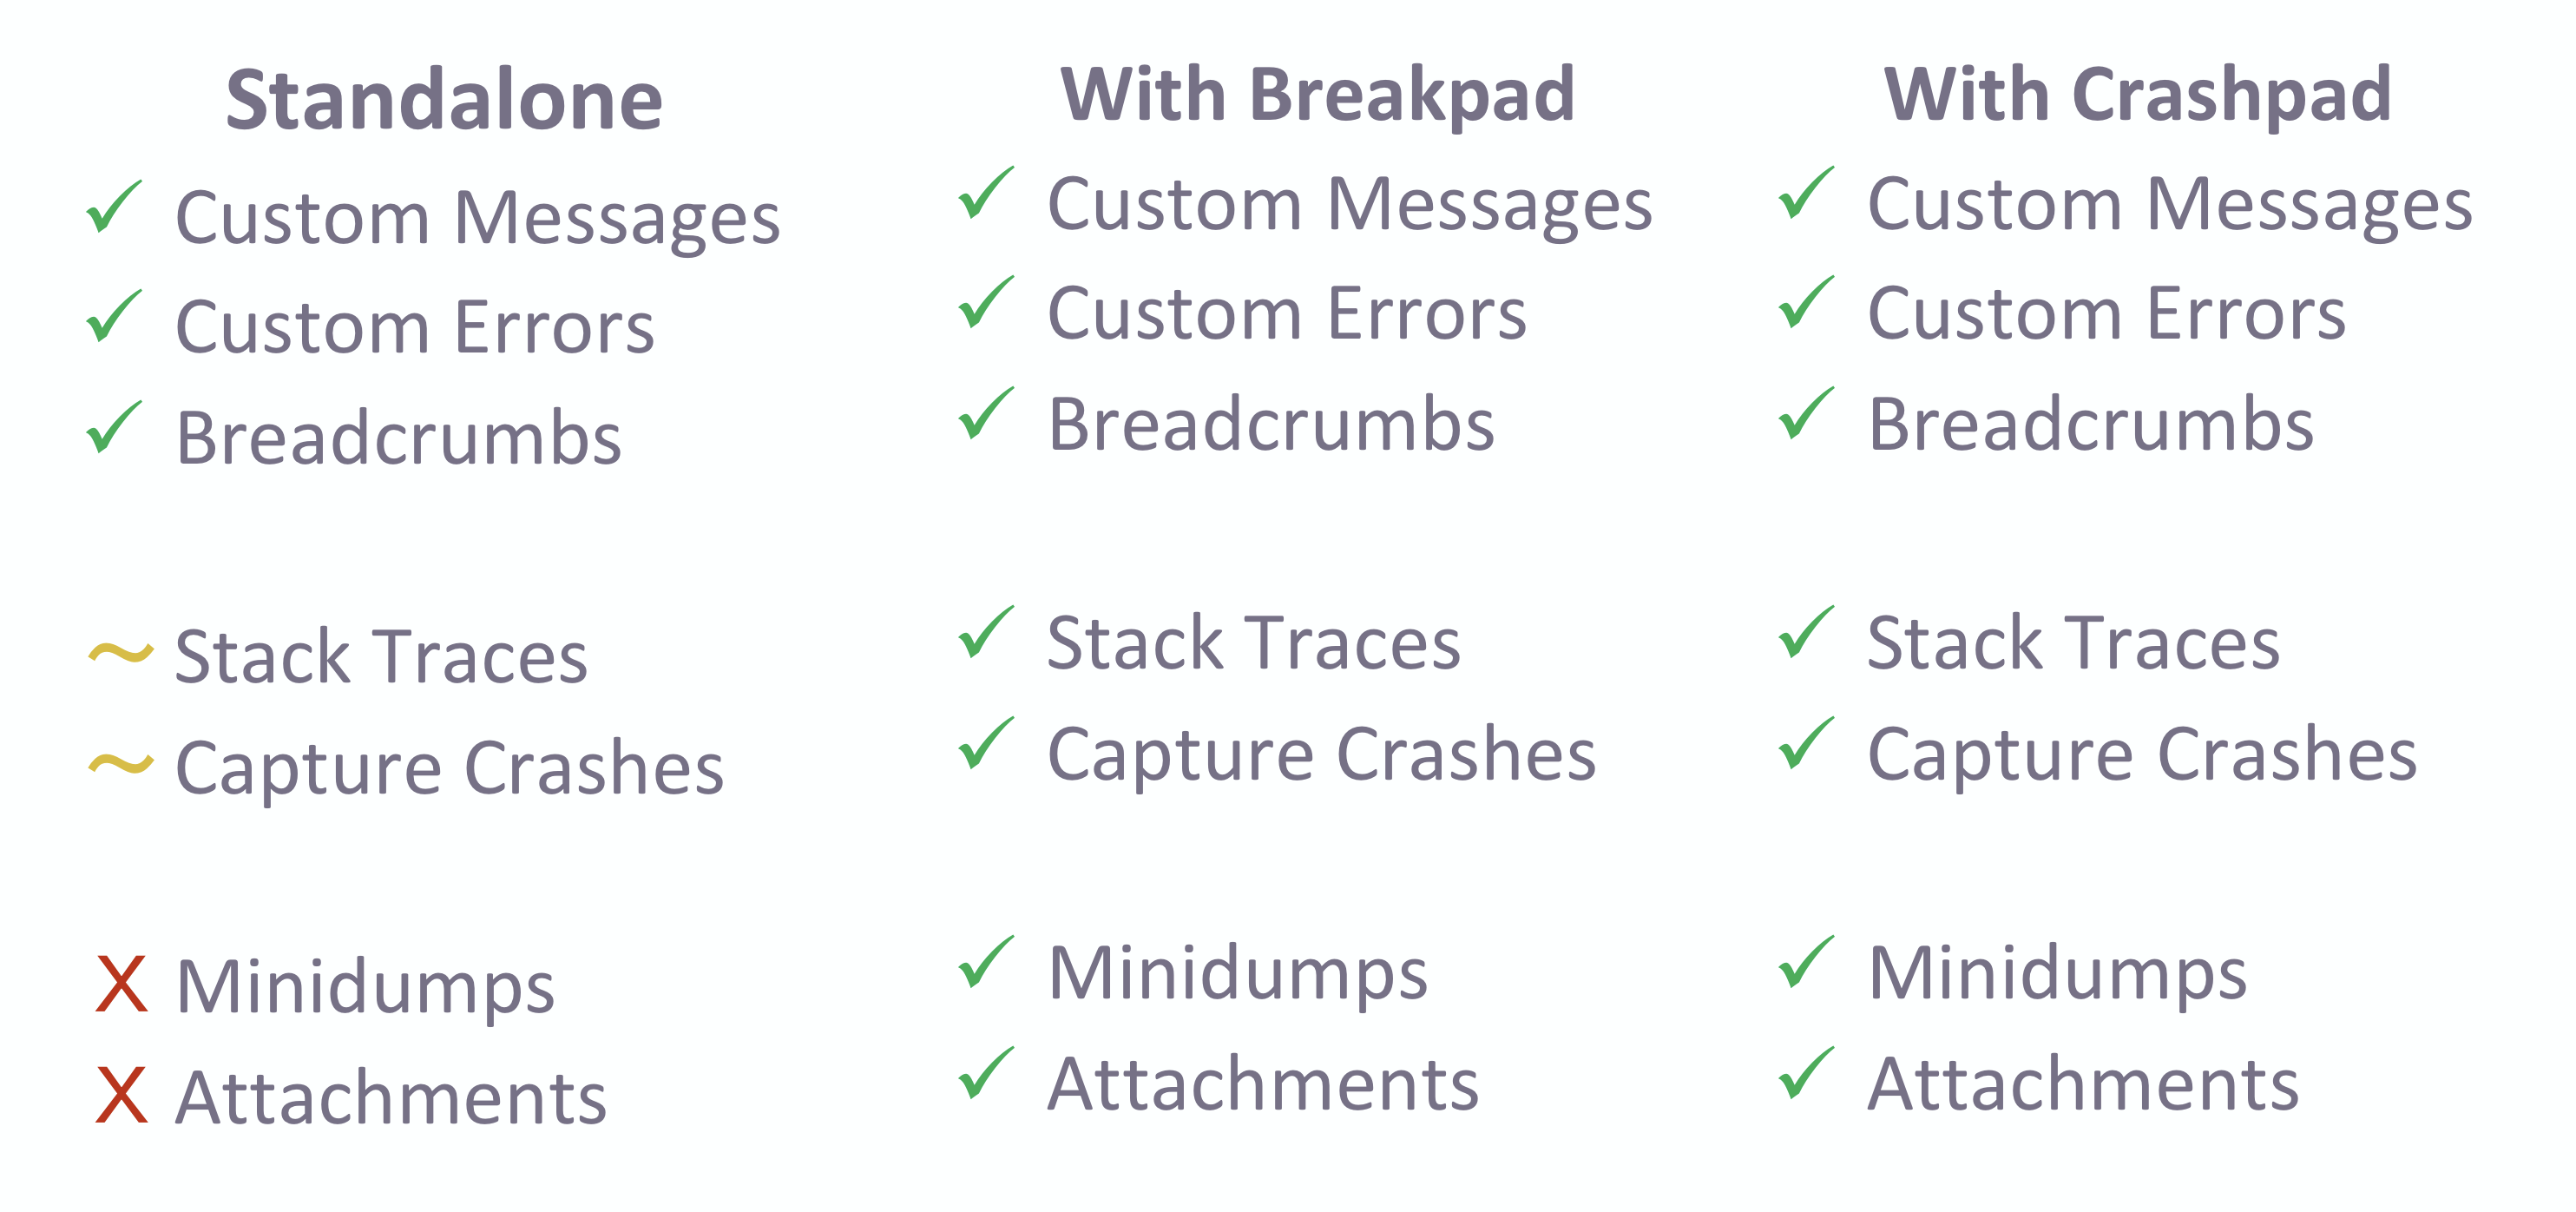
Standalone: Capture custom messages and errors, and add breadcrumbs. While this is the most basic distribution, you can customize the signals you want to handle and supply your own stackwalking library. Our standalone SDK provides the most flexibility, but also requires you to handle crashes yourself.
With Crashpad: Based on the standalone SDK, this version ships and wraps Google Crashpad to capture crashes. You can still add breadcrumbs and capture custom messages, but you additionally get minidumps of crashed applications for free. This works best on Windows and macOS.
With Breakpad: As an alternative to Crashpad, this version ships and wraps Google Breakpad to capture crashes. Otherwise, it is identical. We recommend to use this distribution on Linux.
If you are familiar with one of our other SDKs, you will immediately recognize the code required to initialize the SDK. In the example below, we're initializing the Crashpad version for a Windows application and also passing the path to handler executable:
#include <stdio.h>
#include <stdlib.h>
#include <string.h>
#include "sentry.h"
int main(void) {
sentry_options_t *options = sentry_options_new();
// The handler is a Crashpad-specific background process
sentry_options_set_handler_path(options, "bin/Release/crashpad_handler.exe");
// This is where Minidumps and attachments live before upload
sentry_options_set_database_path(options, "sentry-db");
sentry_options_add_attachment(options, "application.log", "../ce32ff7a.log");
// Initialize the SDK and start the Crashpad handler
sentry_init(options);
// Capture a custom message
sentry_value_t event = sentry_value_new_event();
sentry_value_set_by_key(event, "message",
sentry_value_new_string("Hello World!"));
sentry_capture_event(event);
// Make sure everything flushes before exiting
sentry_shutdown();
}On our releases page, you can download a bundled version of the SDK's sources and build files. For Windows, we provide you with a Microsoft Visual Studio 2017 solution. You can either start directly from that solution and add your own files, or drag the projects over into an existing solution.
For macOS and Linux, we distribute Makefiles that build libraries, utilities, and example programs. You can either integrate them into your existing build process, or use them separately to build binaries and copy them over.
In case our release bundles do not contain the project files you need, premake files allow you to generate a custom project or make modifications to the build setup. The official readme contains more information on integrating and customizing the SDK.
Add context information for debugging
Now that you've added the SDK, you can use its API to add information that helps you debug your issues. The SDK's value API allows you to create arbitrarily complex values from a few primitives:
// create an object and add a string value
sentry_value_t object = sentry_value_new_object();
sentry_value_set_by_key(object, "key", sentry_value_new_string("value"));

// add that object into the list
sentry_value_t list = sentry_value_new_list();
sentry_value_append(list, object);

// ...
Internally, the SDK takes care of memory management for strings, objects, and lists. As long as you always assign the return value of these functions, you never need to worry about memory leaks. And all these functions are thread-safe.
Let's look at the most common attributes to add:
sentry_value_t user = sentry_value_new_object();
sentry_value_set_by_key(user, "id", sentry_value_new_int32(42));
sentry_value_set_by_key(user, "username",
                        sentry_value_new_string("some_name"));
sentry_set_user(user);
This adds a user (with the given identifier and name) to all future events or minidumps. The user information is stored until it is overwritten by another call to sentry_set_user and applies immediately to all future events.
sentry_value_t default_crumb = sentry_value_new_breadcrumb(0, "hello, world");
sentry_add_breadcrumb(default_crumb);
This adds a breadcrumb that is included in every future event. The SDK keeps a window of the 100 most recent breadcrumbs.
sentry_set_transaction("startup");
sentry_set_level(SENTRY_LEVEL_WARNING);
sentry_set_tag("mode", "demo");
This sets tags and other basic event attributes. Like user information, these attributes are applied until they are overwritten. Of course, you're not constrained to just these attributes. See the event payload docs for a more complete list of all supported attributes and interfaces for creating custom events.
Provide Sentry with debug information
Now that your application is ready to send data to Sentry, it's time to build. In order to process crash reports, Sentry requires debug information, which allows us to extract stack traces and symbolicate stack frames into function names and line numbers.
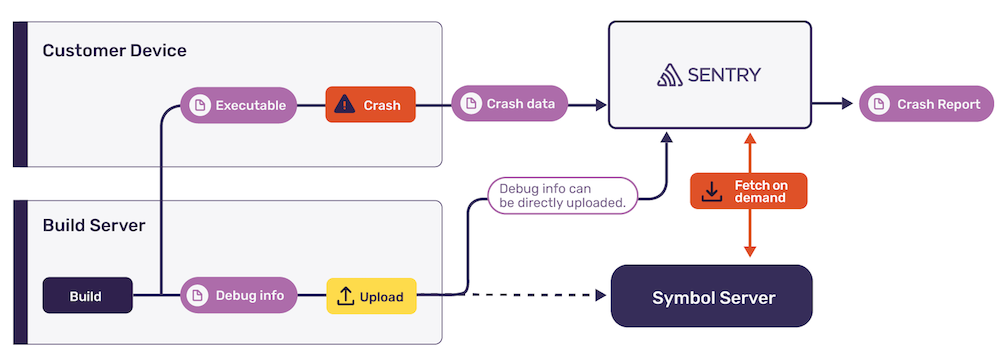
The easiest way to provide Sentry with debug information is by uploading it using sentry-cli. This little helper will scan for compatible files and upload them to your project. You can run it during your build or release process:
$ sentry-cli upload-dif /path/to/files
> Found 2 debug information files
> Prepared debug information files for upload
> Uploaded 2 missing debug information files
> File processing complete:

     OK 3003763b-afcb-4a97-aae3-28de8f188d7c-1
        (crash.exe; x86_64 executable)
     OK 3003763b-afcb-4a97-aae3-28de8f188d7c-1
        (crash.pdb; x86_64 debug companion)
There are two main points to look out for:
Always upload debug information and executables of the same build that you deploy or distribute to your users. Sentry uses unique identifiers that change with every build to match them to crash reports.
Check that all available debug information is uploaded. Sentry analyzes uploaded files and displays which information is contained in them on the Debug Files settings screen. For optimal results, check that both "debug" and "unwind" are present for your uploaded files:

If you're not sure which of your files contain usable information, you can also use sentry-cli to check their contents. This is particularly useful on Linux, where generating and stripping debug information is slightly more involved than on other platforms:
$ sentry-cli difutil check path/to/file

Debug Info File Check
  Type: elf debug companion
  Contained debug identifiers:
    > 924e148f-3bb7-06a0-74c1-36f42f08b40e (x86_64)
  Contained debug information:
    > symtab, debug
  Usable: yes
Configure symbol servers
In case you cannot upload debug files to us or store them in a different location already, we've got you covered. We're excited to announce that symbol servers are now out of preview. You can conveniently configure them on the Debug Files settings screen:
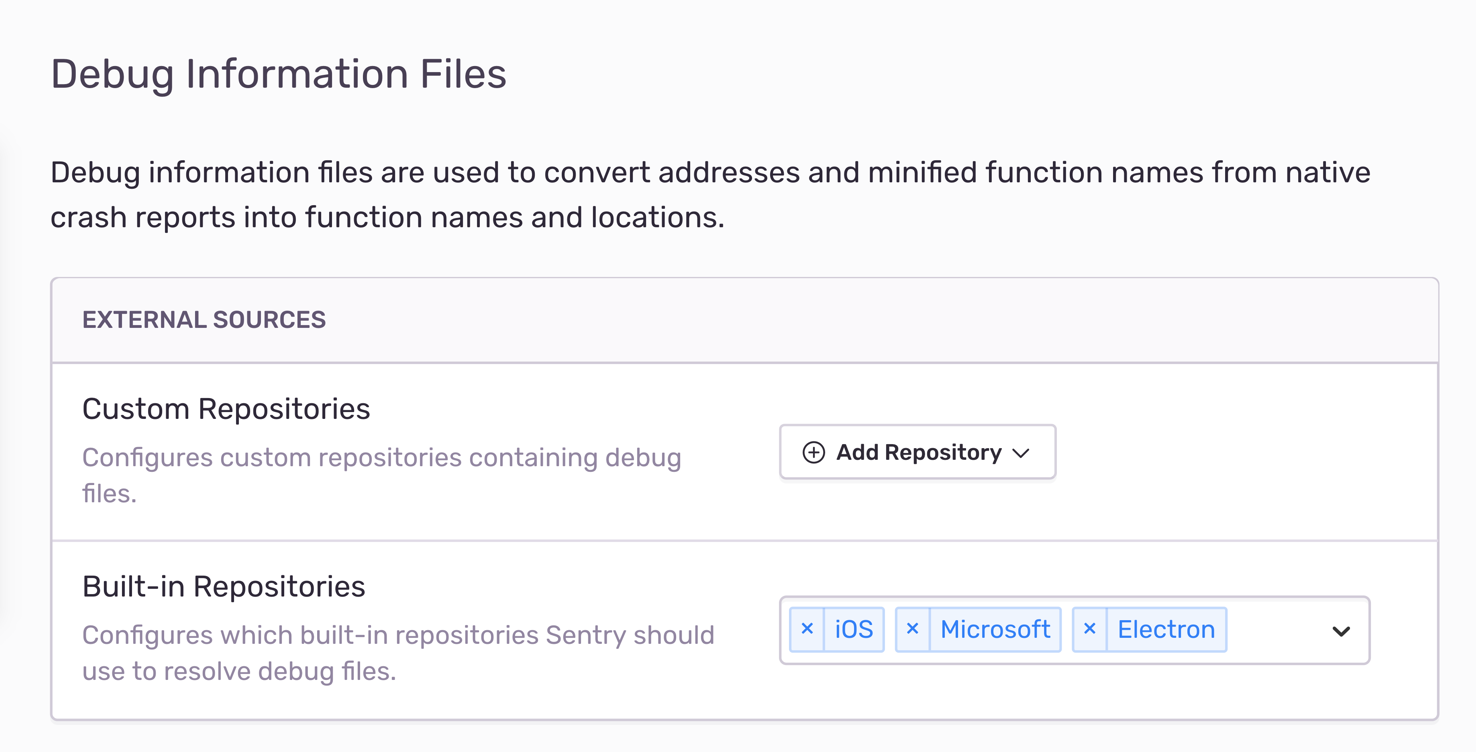
Out of the box, Sentry provides you with a list of built-in symbol servers that contain debug files for system libraries or popular third-party frameworks. By default, iOS and Microsoft are active, which give you function names for the two platforms. Other examples include graphic drivers for Nvidia and AMD, the Unity project, and Github's Electron framework.
Once you've selected repositories from the list, Sentry immediately applies debug files from those servers to all new incoming crash reports and events. Likewise, you can remove servers at any time from the list, and Sentry will no longer use their debug files.
If your organization is on a Business or Enterprise plan, you can even add custom servers to this list. This is probably most interesting to you if you are running your own symbol servers. We currently support HTTP servers that speak the Symbol Server Protocol, Amazon S3 buckets, and Google Cloud Storage buckets. By this, we are fully compatible with servers used by the Microsoft Debugger and support the same lookup paths that LLDB and GDB use.
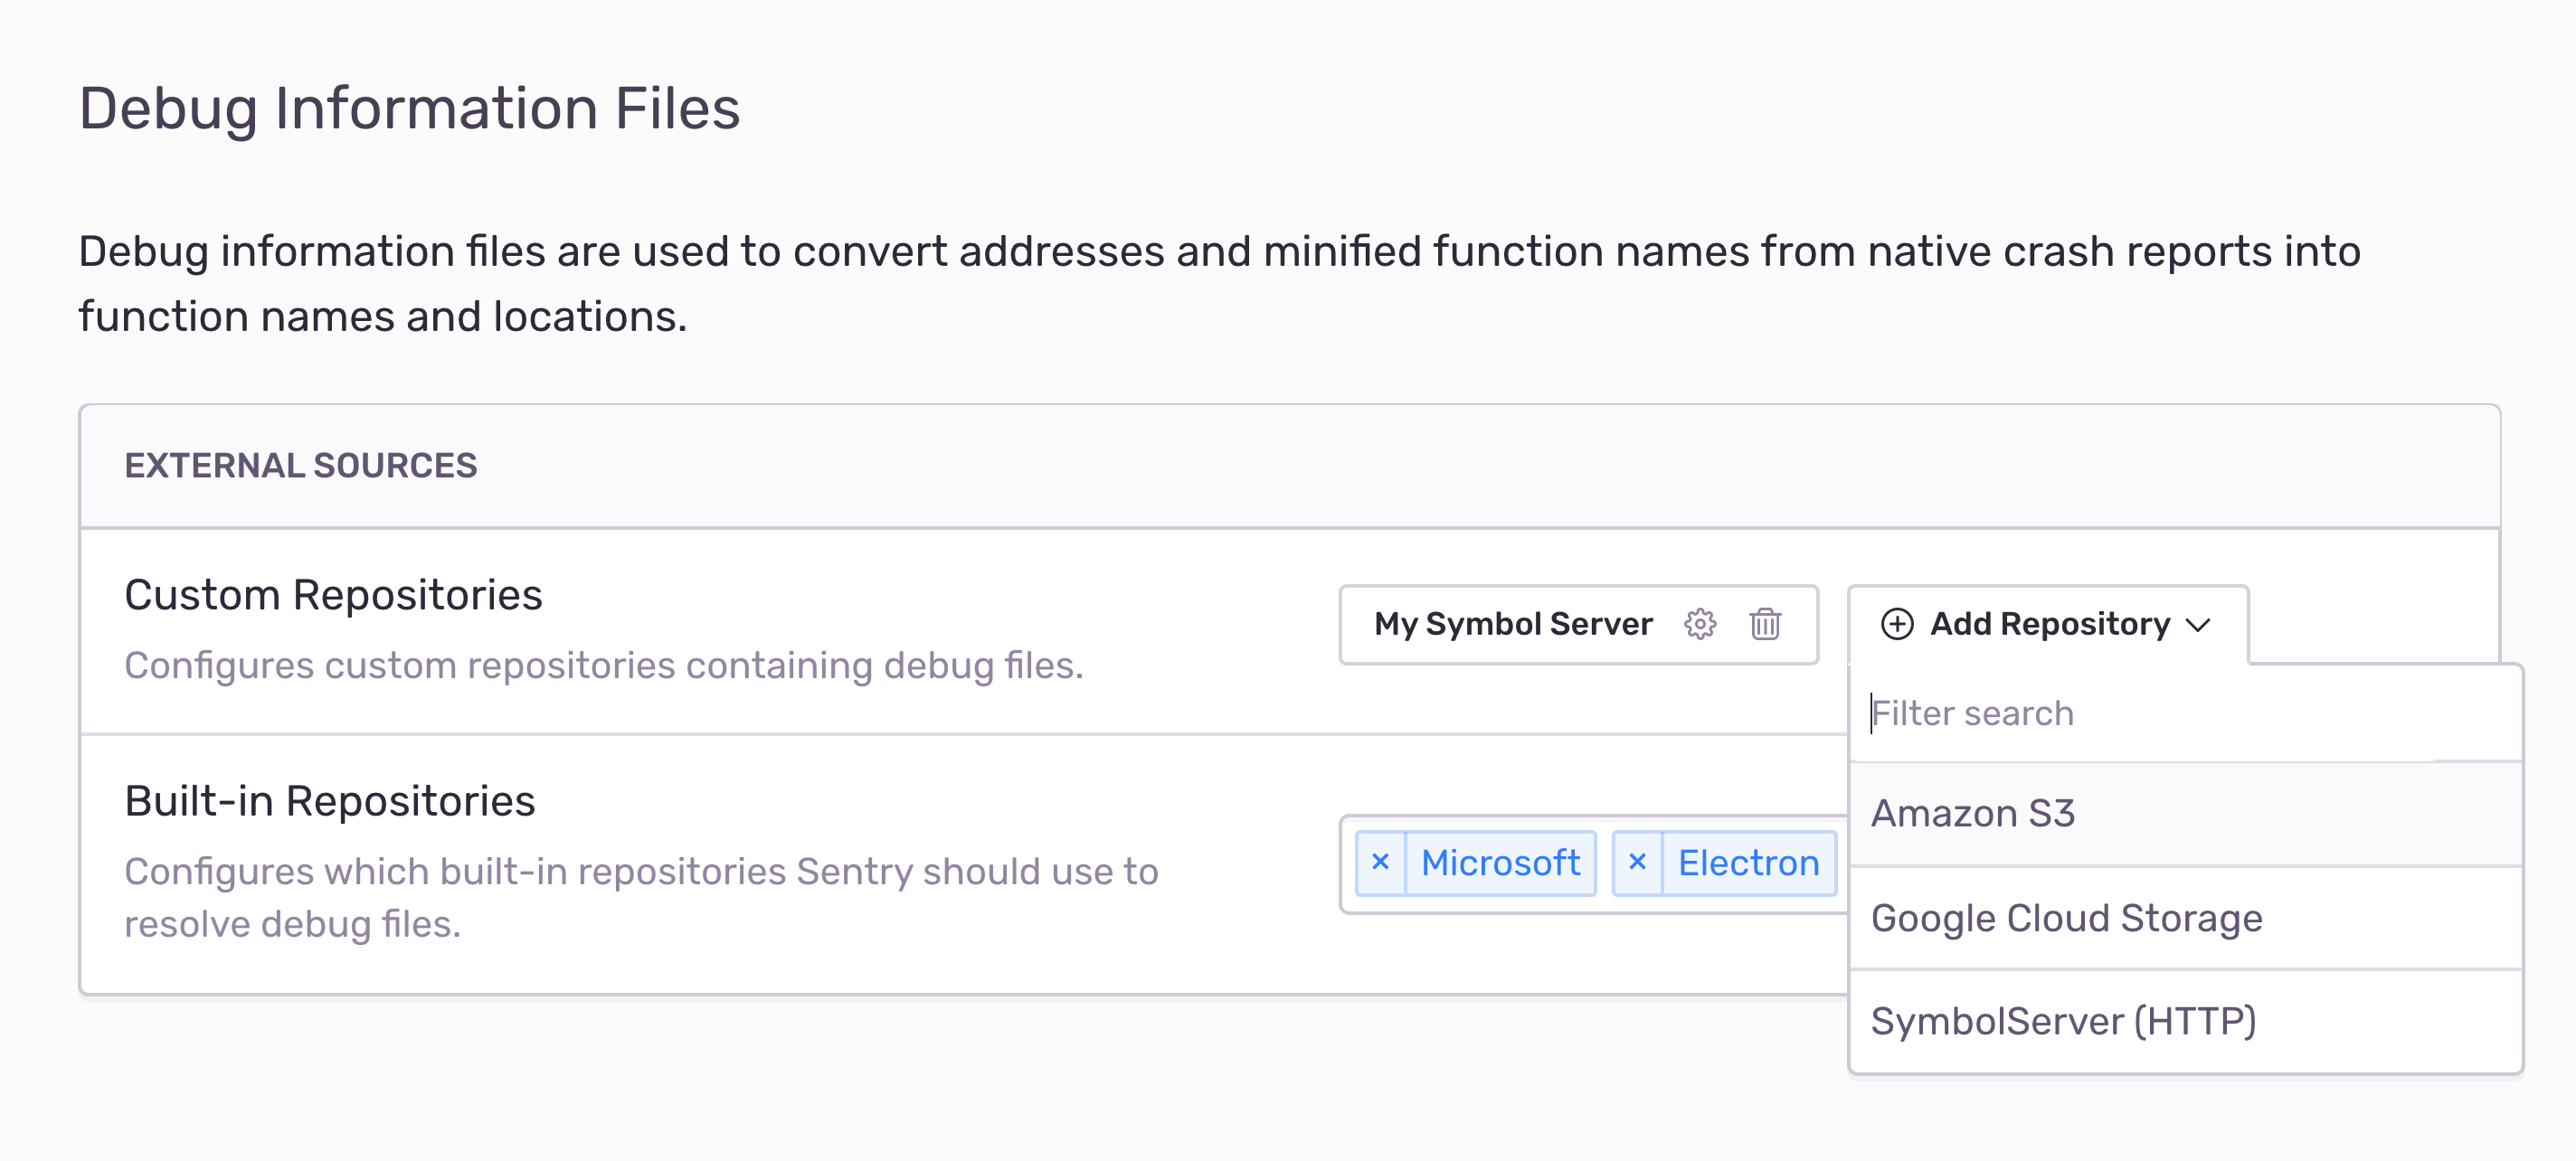
Sentry is compatible with all major layouts for debug file repositories and supports various compression formats. See our documentation of all supported features for more information. Of course, we're here to help if you're stuck, so please reach out to our amazing support engineers if you have questions about custom symbol servers.
Reduce noise with custom grouping
Now that crash reports are flowing in, it’s time to focus on the exciting parts: squashing those bugs. Don’t get us wrong, we’re not suggesting that bugs are exciting. But, you have to agree that there is this pleasant, almost therapeutic feeling when finally resolving an issue.
Sentry helps by grouping events into unique issues, which provides an overview of the state of your application:
Which crash is happening the most?
Is a crash still happening in the latest release despite my fix?
Which issues affect my most important users?
Issue grouping is done automatically by Sentry in the background. In order to group issues, Sentry looks at the error and relevant parts of the stack trace to find issues with similar events. While we employ sensible defaults to perform this matching, we sometimes get it wrong. For this reason, you can fine-tune grouping with custom rules.
First, ensure that you’re on the latest version of your grouping algorithm. In Project Settings > Grouping Config, you can upgrade to the most recent algorithm and base configuration. We’re constantly improving the grouping logic, but you choose the time when you apply the change to prevent sudden workflow interruptions by new issues.

Sometimes, Sentry might still consider stack frames for grouping that are not important to you. Common namespaces like std or boost are hidden and disregarded by default, but frames from other libraries might still be considered. You can fine-tune this by adding custom grouping enhancements. These allow you to override which frames are being considered in-app and which to include for grouping. By default, only in-app frames are considered for grouping.
So how does this work exactly? Let's assume your application is always called through a function run_loop and eventually calls a function call_external which dispatches to third party code. To exclude all frames below run_loop and above call_external, add the following grouping enhancements:
platform:native function:call_external ^-group ^-app
platform:native function:run_loop v-group v-app
Grouping rules can match on frames and then execute a number of actions. ^ specifies to apply the action to all frames above, and -group and -app are actions to exclude the frame from grouping and app frame display, respectively.
Let's look at a different example. What if we don't want to see any frames from the google::breakpad namespace? Easy peasy:
platform:native function:google::breakpad::* -appYou can reduce stack traces down to the essential parts required for debugging your issues. Of course, there's more matchers and actions to configure, so head over to our grouping docs for a full rundown.
One more thing: Source context
As a little cherry on top, let's add source code context. What is better than seeing the offending code directly in your stack trace, right? All you have to do is upload sources to Sentry.
No worries, you're not alone here. Sentry CLI can conveniently process your debug files, search for relevant sources, and create a bundle with all required metadata. If you're uploading debug files directly from the build system, it's as easy as passing --include-sources to the upload command:
$ sentry-cli upload-dif --include-sources path
> ...

     OK 3003763b-afcb-4a97-aae3-28de8f188d7c-1
        (crash.exe; x86_64 executable)
     OK 3003763b-afcb-4a97-aae3-28de8f188d7c-1
        (crash.pdb; x86_64 debug companion)
     OK 3003763b-afcb-4a97-aae3-28de8f188d7c-1
        (crash.pdb; x86_64 source bundle)
After that, you will notice that source bundles appear along with your debug files in settings and share the same identifier. This is how Sentry matches up the right version of your sources with the events and crashes coming in. No matter how complicated your build process — using submodules, symlinks or generated files — source context will always be there:
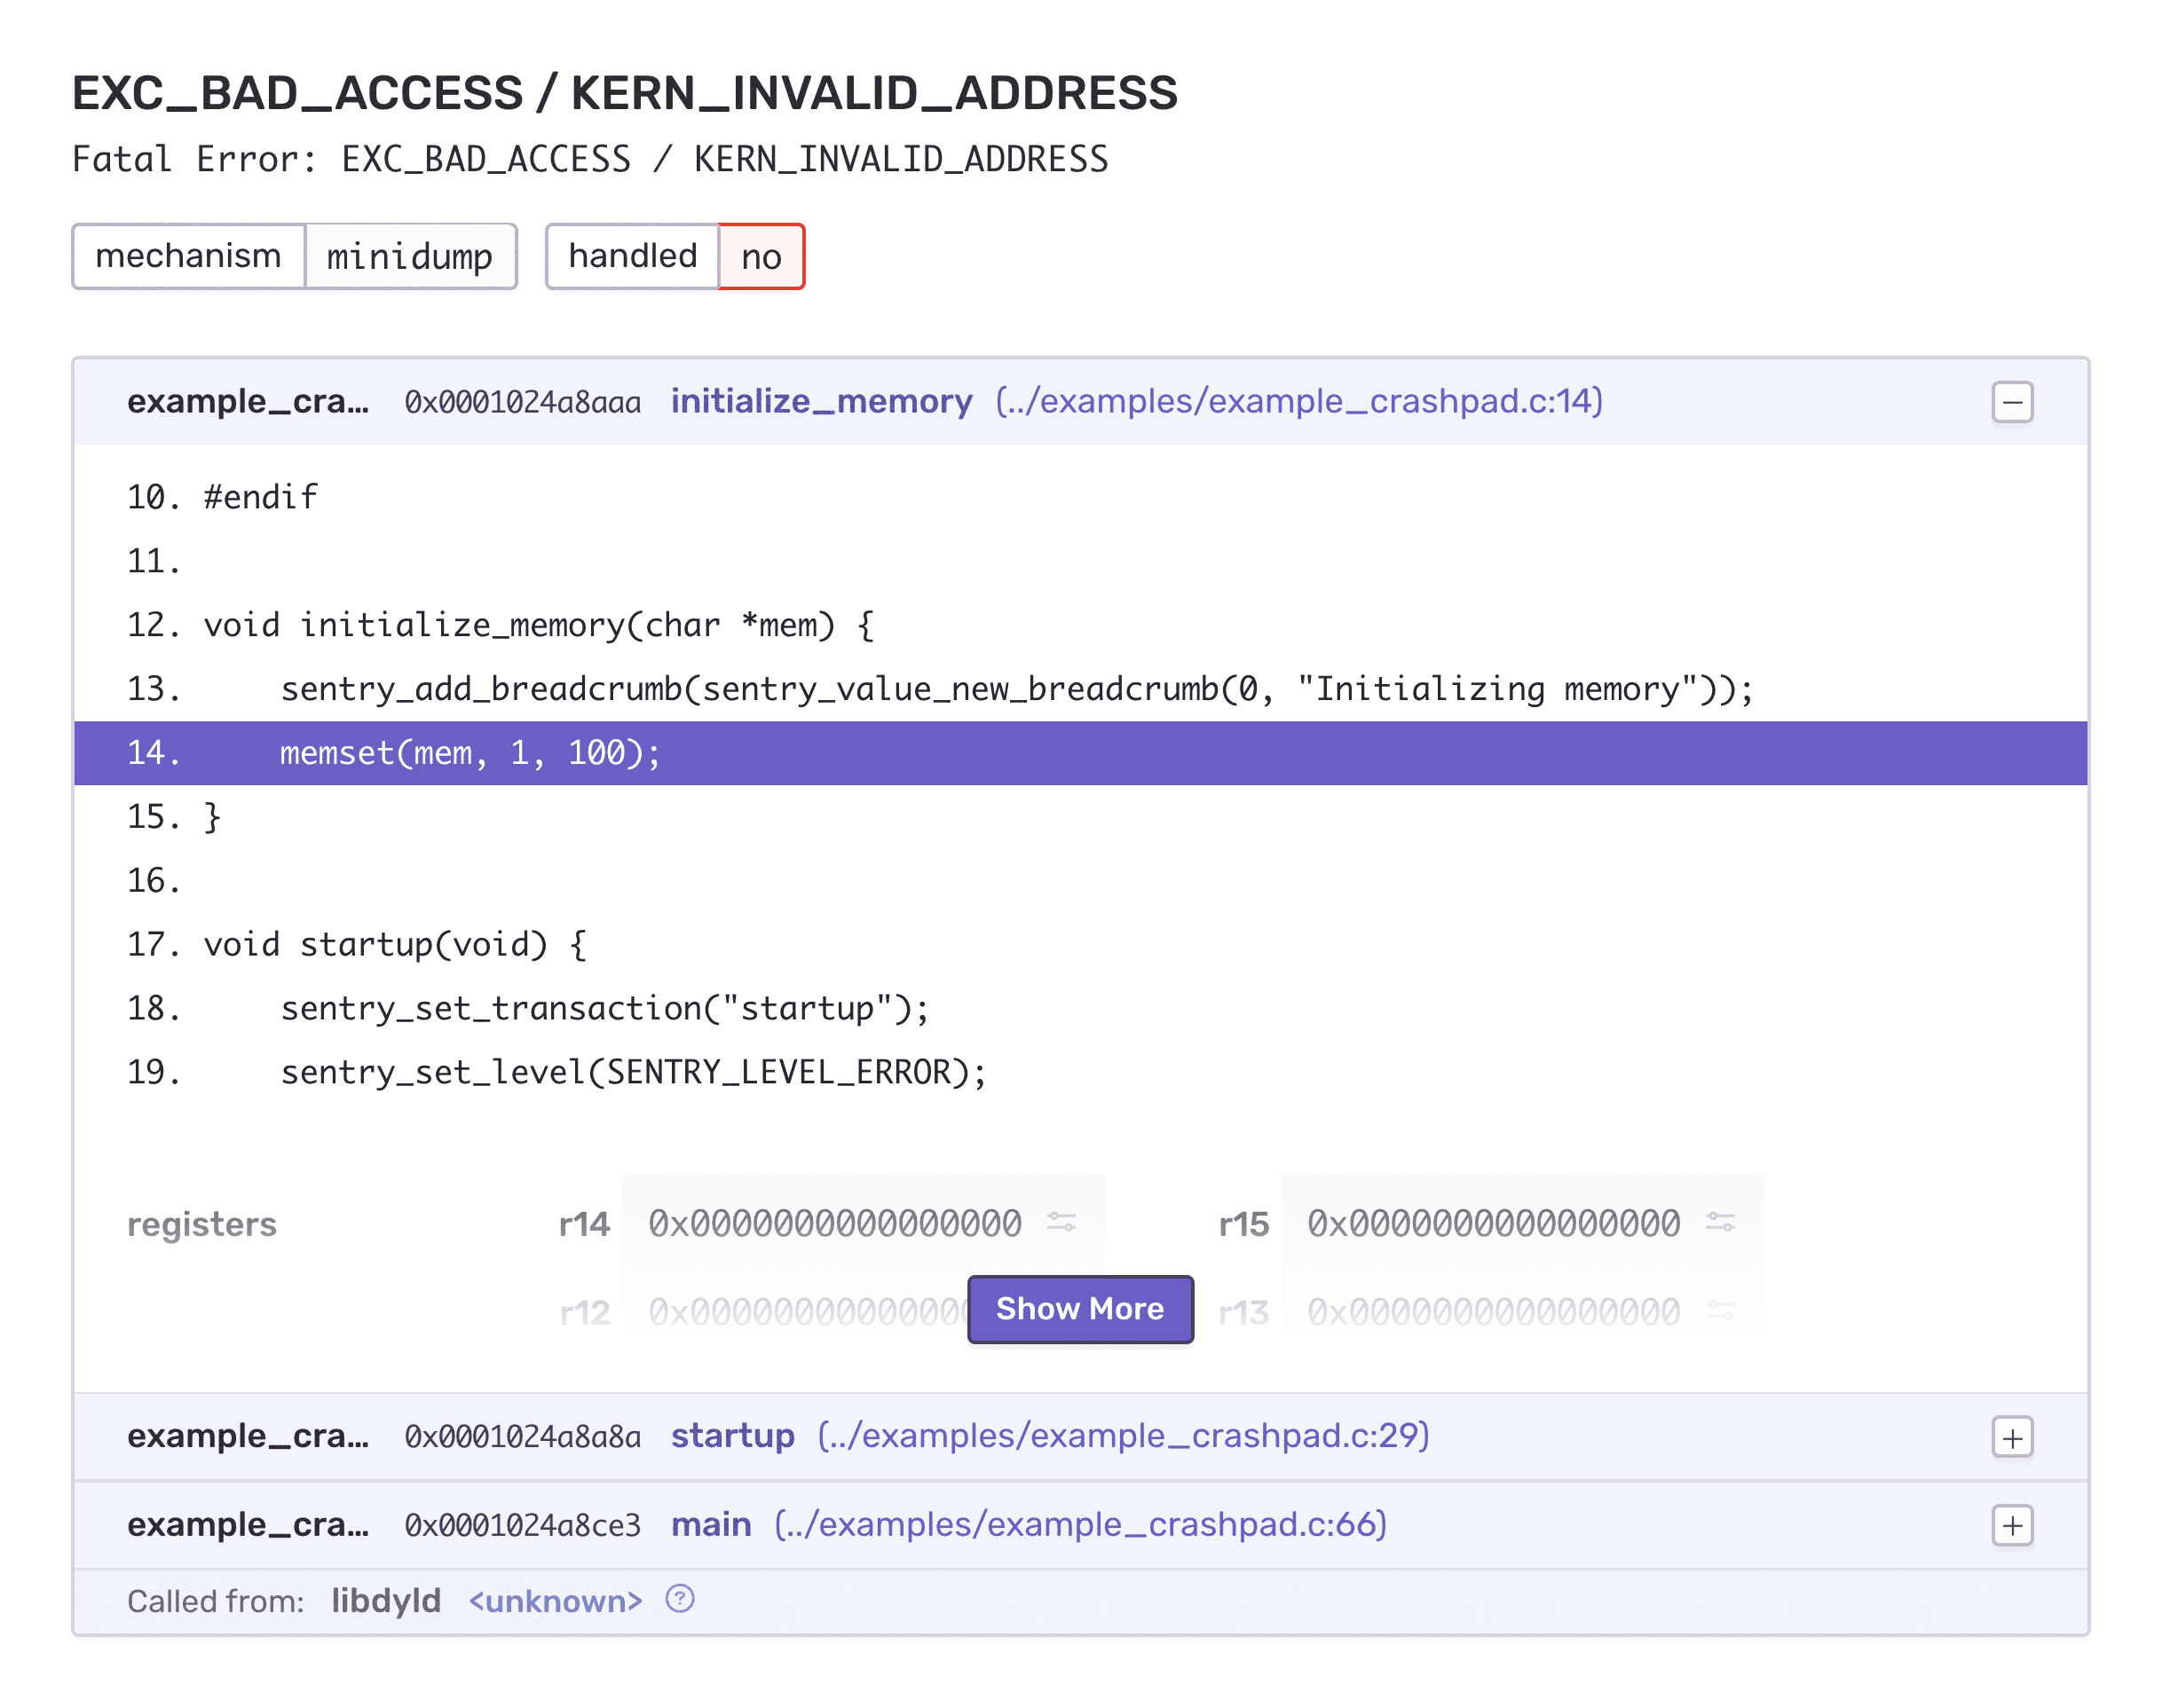
It is important to run this command on the same machine where the build happened. Sentry CLI uses absolute paths stored in the debug files to ensure that the correct sources are bundled. If your build process does not run uploads right away, you can alternatively generate a bundle at build time without uploading it:
$ sentry-cli difutil bundle-sources /path/to/debug_fileThis creates a source bundle ZIP next to the debug file that can be uploaded with upload-dif. This way, you can upload sources together with your debug files at a later time.
What's Next?
From here on, you have the entire Sentry platform at your service. Link your version control system to receive suspect commits, integrate with project management tools like JIRA for extended workflows, or use Discover to run advanced analytics on your events.
We are very excited to offer first-class error monitoring for native applications. Since crashes create the most frustrating experiences to both users and developers, it is vital to capture as much context as possible to squash those bugs quickly.
Many of the features presented in this post have been long in the making. We are thrilled to hear about the unique applications that you are building, and our team can't wait for feedback from your engineers.
As always, you’re very welcome to create a post in our forum or reach out to our support engineers with questions.
From Sentry, with ⌨️ and ❤️


