Fix your actual slow-loading assets with Resource Monitoring
Fix your actual slow-loading assets with Resource Monitoring
Slow-loading assets on your web pages can lead to frustrated users, high bounce rates, and lost conversions. For the vast majority of websites, slow-loading resources will be your main performance bottleneck. There’s no way to get around going through the network for essential resources like JavaScript, CSS, and images — thus, it’s crucial that you can quickly identify and fix your slow-loading assets.
The current tools for optimizing asset size are not enough
One common method to address asset performance is using the local development environment to inspect production and observe slow apps in action. Some organizations might go a step further and analyze asset size as part of CI, or employ synthetic tests to identify issues.
However, this is not production data. You don’t know how these files will be used in reality, and it doesn’t make sense to prioritize optimizing a script file that nobody actually accesses. In modern JavaScript, there are also chunking and loading patterns that generate many one-off files — and it’s ineffective to apply blanket reductions to random files. To make meaningful performance optimizations, you need to know how your assets are used in production workloads.
Discover performance problems in production with Resource Monitoring
To help identify your problem areas with slow-loading JavaScript, CSS, and font assets, Sentry now has Resource Monitoring. Resource Monitoring works with our automatic JavaScript performance monitoring instrumentation for browser JavaScript. If you have it enabled, you can check out how it looks for your Sentry org here.
As you can see in the walkthrough above, the Resource module displays all the assets that your website loads, along with their load duration and size information.
Understand how your resources load in the real world
Most modern web development setups use bundlers like Webpack , vite, or esbuild to automatically add output bundles to served HTML. Monitoring the weight of these assets in your dist folder is challenging, especially since modern frameworks have preloading and chunking to lazy load built-in.
In addition, assets can be render blocking, which means they stop the browser from rendering anything on the screen until the resource is fully downloaded and processed. Without proper monitoring, render blocking assets can easily sneak into pages, especially when certain JavaScript or CSS assets are render blocking only for certain pages.
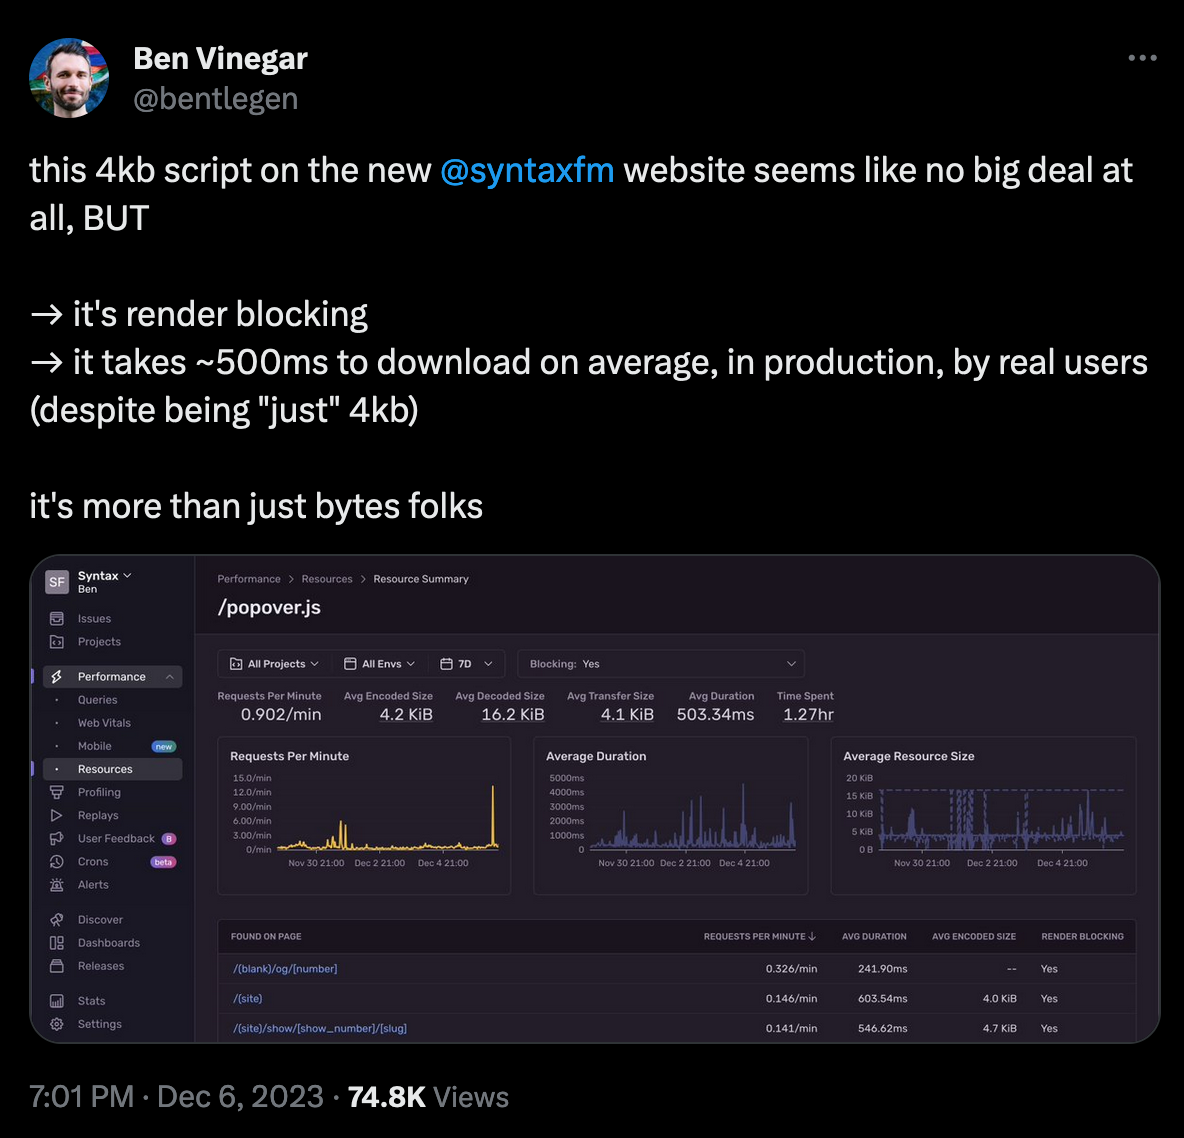
Using our resource monitoring workflow, the SyntaxFM team at Sentry discovered a 4kB render blocking script originating from a polyfill for the popover API.
It turned out there was no reason for this asset to be render blocking - so a fix was made to make the loading of this logic non-blocking, and we updated the polyfill docs to make it easier to not use the blocking pattern.
Don’t just find your largest assets — find your most problematic ones
While asset byte size is an important metric for understanding page performance, it’s not the sole factor that determines page loading speed. Optimizing for filesize alone provides only a partial view — you also need to look at how resources are loaded, what pages they load on, and what functionality the resource has to understand if it really is a performance problem.
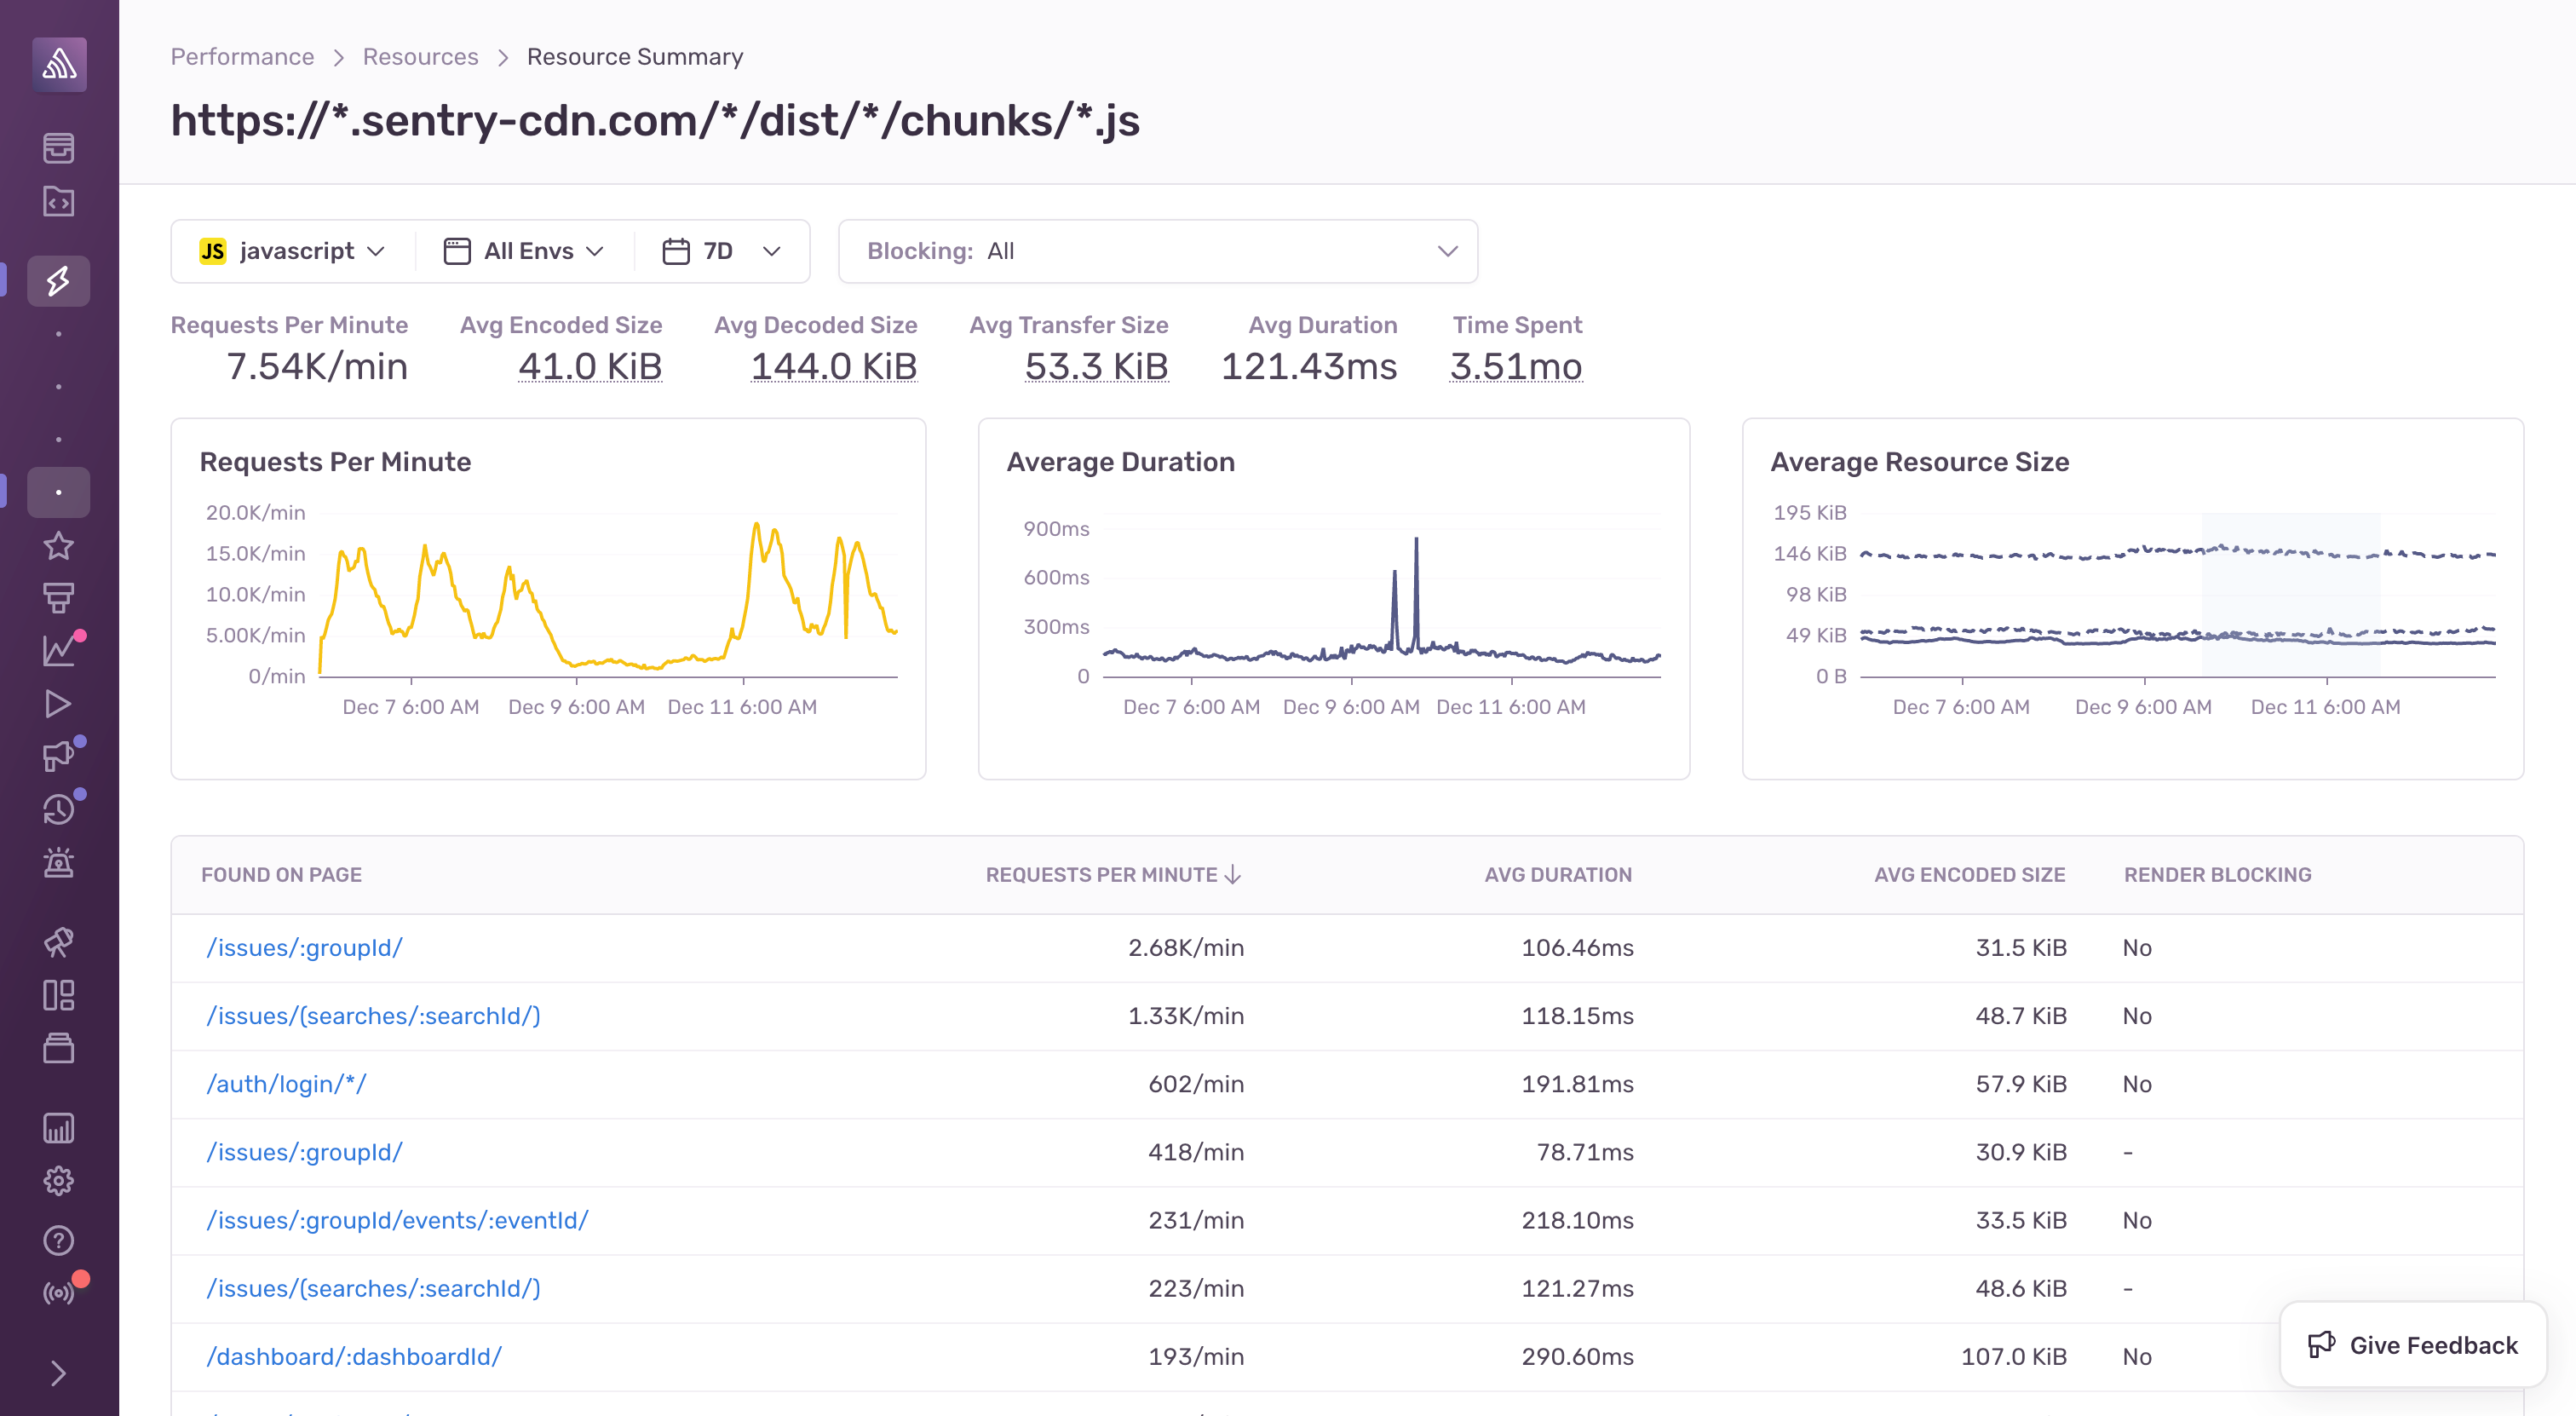
To cut through the noise and zoom in on problematic assets, you can filter for render-blocking resources and the pages they are impacting.
The screenshot above shows the resource summary page, providing helpful aggregate stats about a specific resource loaded by your site. By displaying resource size alongside duration in the displayed charts, you can directly correlate the size of a resource to its duration over time. This helps you to visualize the impact of bundle size optimizations you make (e.g. sometimes bundle size decreases might surprise you and cause no noticeable change in duration).
Discover third-party scripts added outside of the development process
Many web applications contain third-party resources outside of the main bundled JavaScript, such as scripts for services like Google Analytics or Amplitude. These scripts and their impact on performance can easily be overlooked, as they often don’t show up in bundle analyses of the main bundle. On larger web projects, these scripts are often added by different teams or departments, making it challenging to keep track of them all.
With Sentry, it’s easy to see how often a third-party script is used and how it’s affecting your site’s performance. In fact, we were able to discover that three of the top 5 most-used resources on the Sentry frontend were from third-party scripts we were loading.
What’s next for Resource Monitoring with Sentry
Soon, we’ll be connecting the resource module with Sentry’s web vitals module, where you can easily identify when a resource is contributing to a bad LCP, FCP, or FID score. We’re also looking to add more network-related info to resources, including network timing information (e.g. time spent requesting a resource vs. time spent on the response for a resource and cache hit/miss information). This will help you understand if you need to optimize your networking/caching setup.
Lastly, we aim to let you see the modules and npm packages included within every bundled JavaScript asset. We’re doing this by building bundle analysis features (like what you get out of something like a webpack bundle analyzer) right into Sentry, in collaboration with Codecov.
Don’t get left in the dark; get started with Resource Monitoring today
Loading resources can bottleneck your web app’s performance, especially with modern bundlers that obscure how resources are loaded and split up. Large or render-blocking resources aren’t always an immediate issue — you instead need to make a performance decision by evaluating how and where a resource is used alongside all its performance metrics.
Sentry’s resource monitoring makes it clear what your resources are, where they’re used, and how they are performing with real customers. This helps you prioritize the fixes that matter.
To start using Resource Monitoring, set up Sentry Performance today. You can also drop us a line on Twitter or Discord, or share your Resource Monitoring feedback with us on GitHub.


