Dogfooding Chronicles: Thinking Backward, Moving Forward
Dogfooding Chronicles: Thinking Backward, Moving Forward
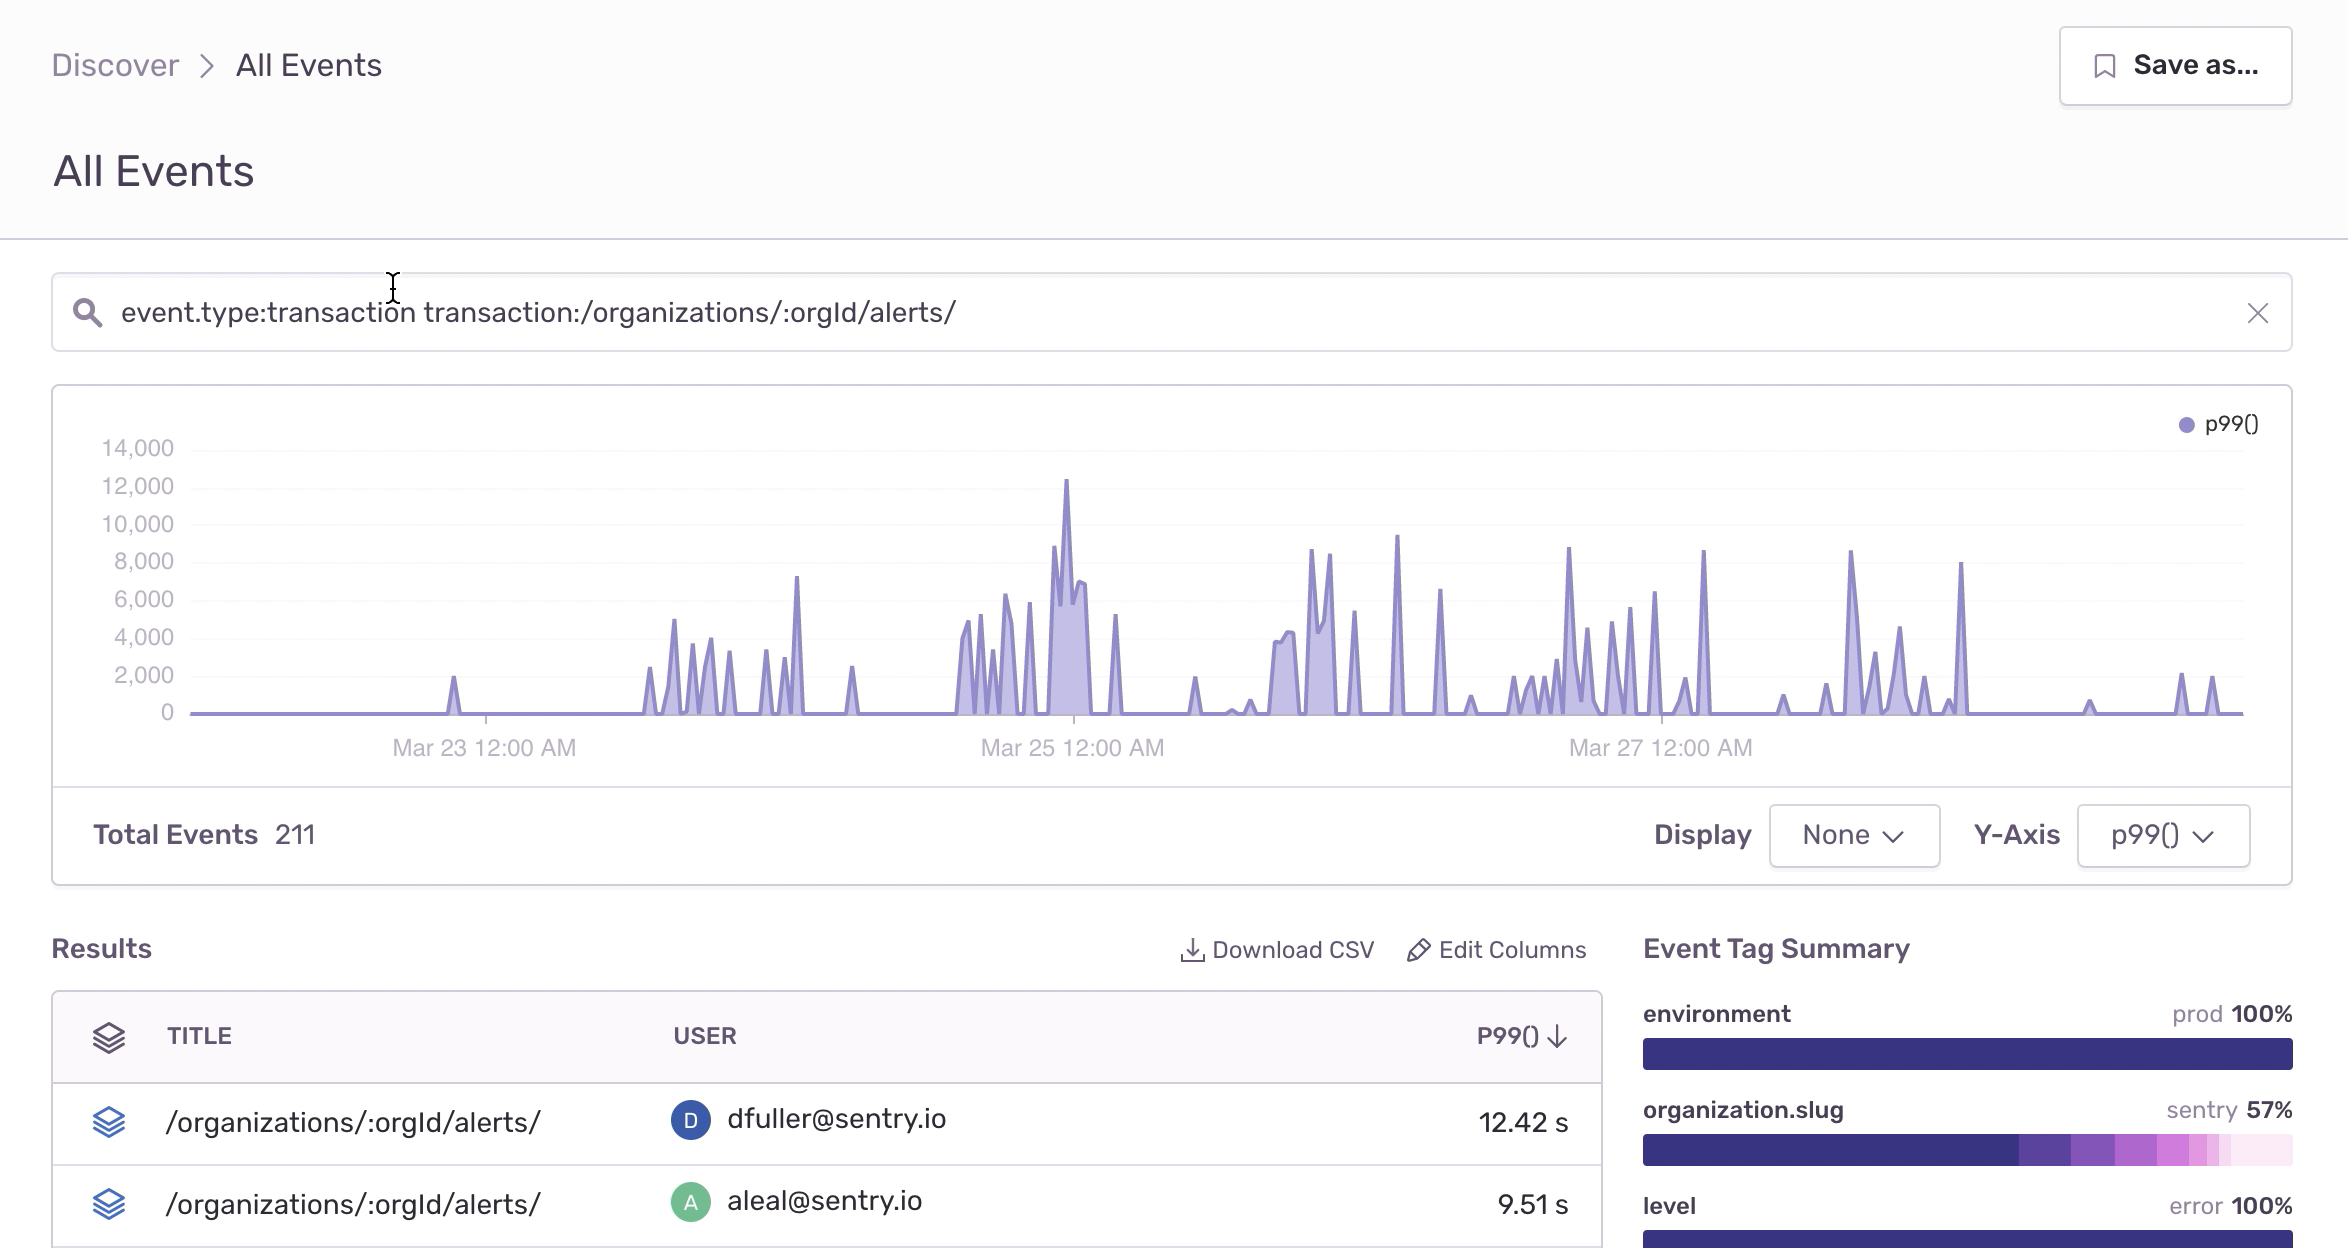
Zac Propersi, Engineering Manager at Sentry, can tell when a page is not loading as fast as it should — just by looking at it. While working on our new Metric Alerts feature, Zac noticed that the alerts pages were rendering slowly. Being the super Sentry user that he is, he wrote a custom query in Discover to see just how slow the transactions were.
Reproduction
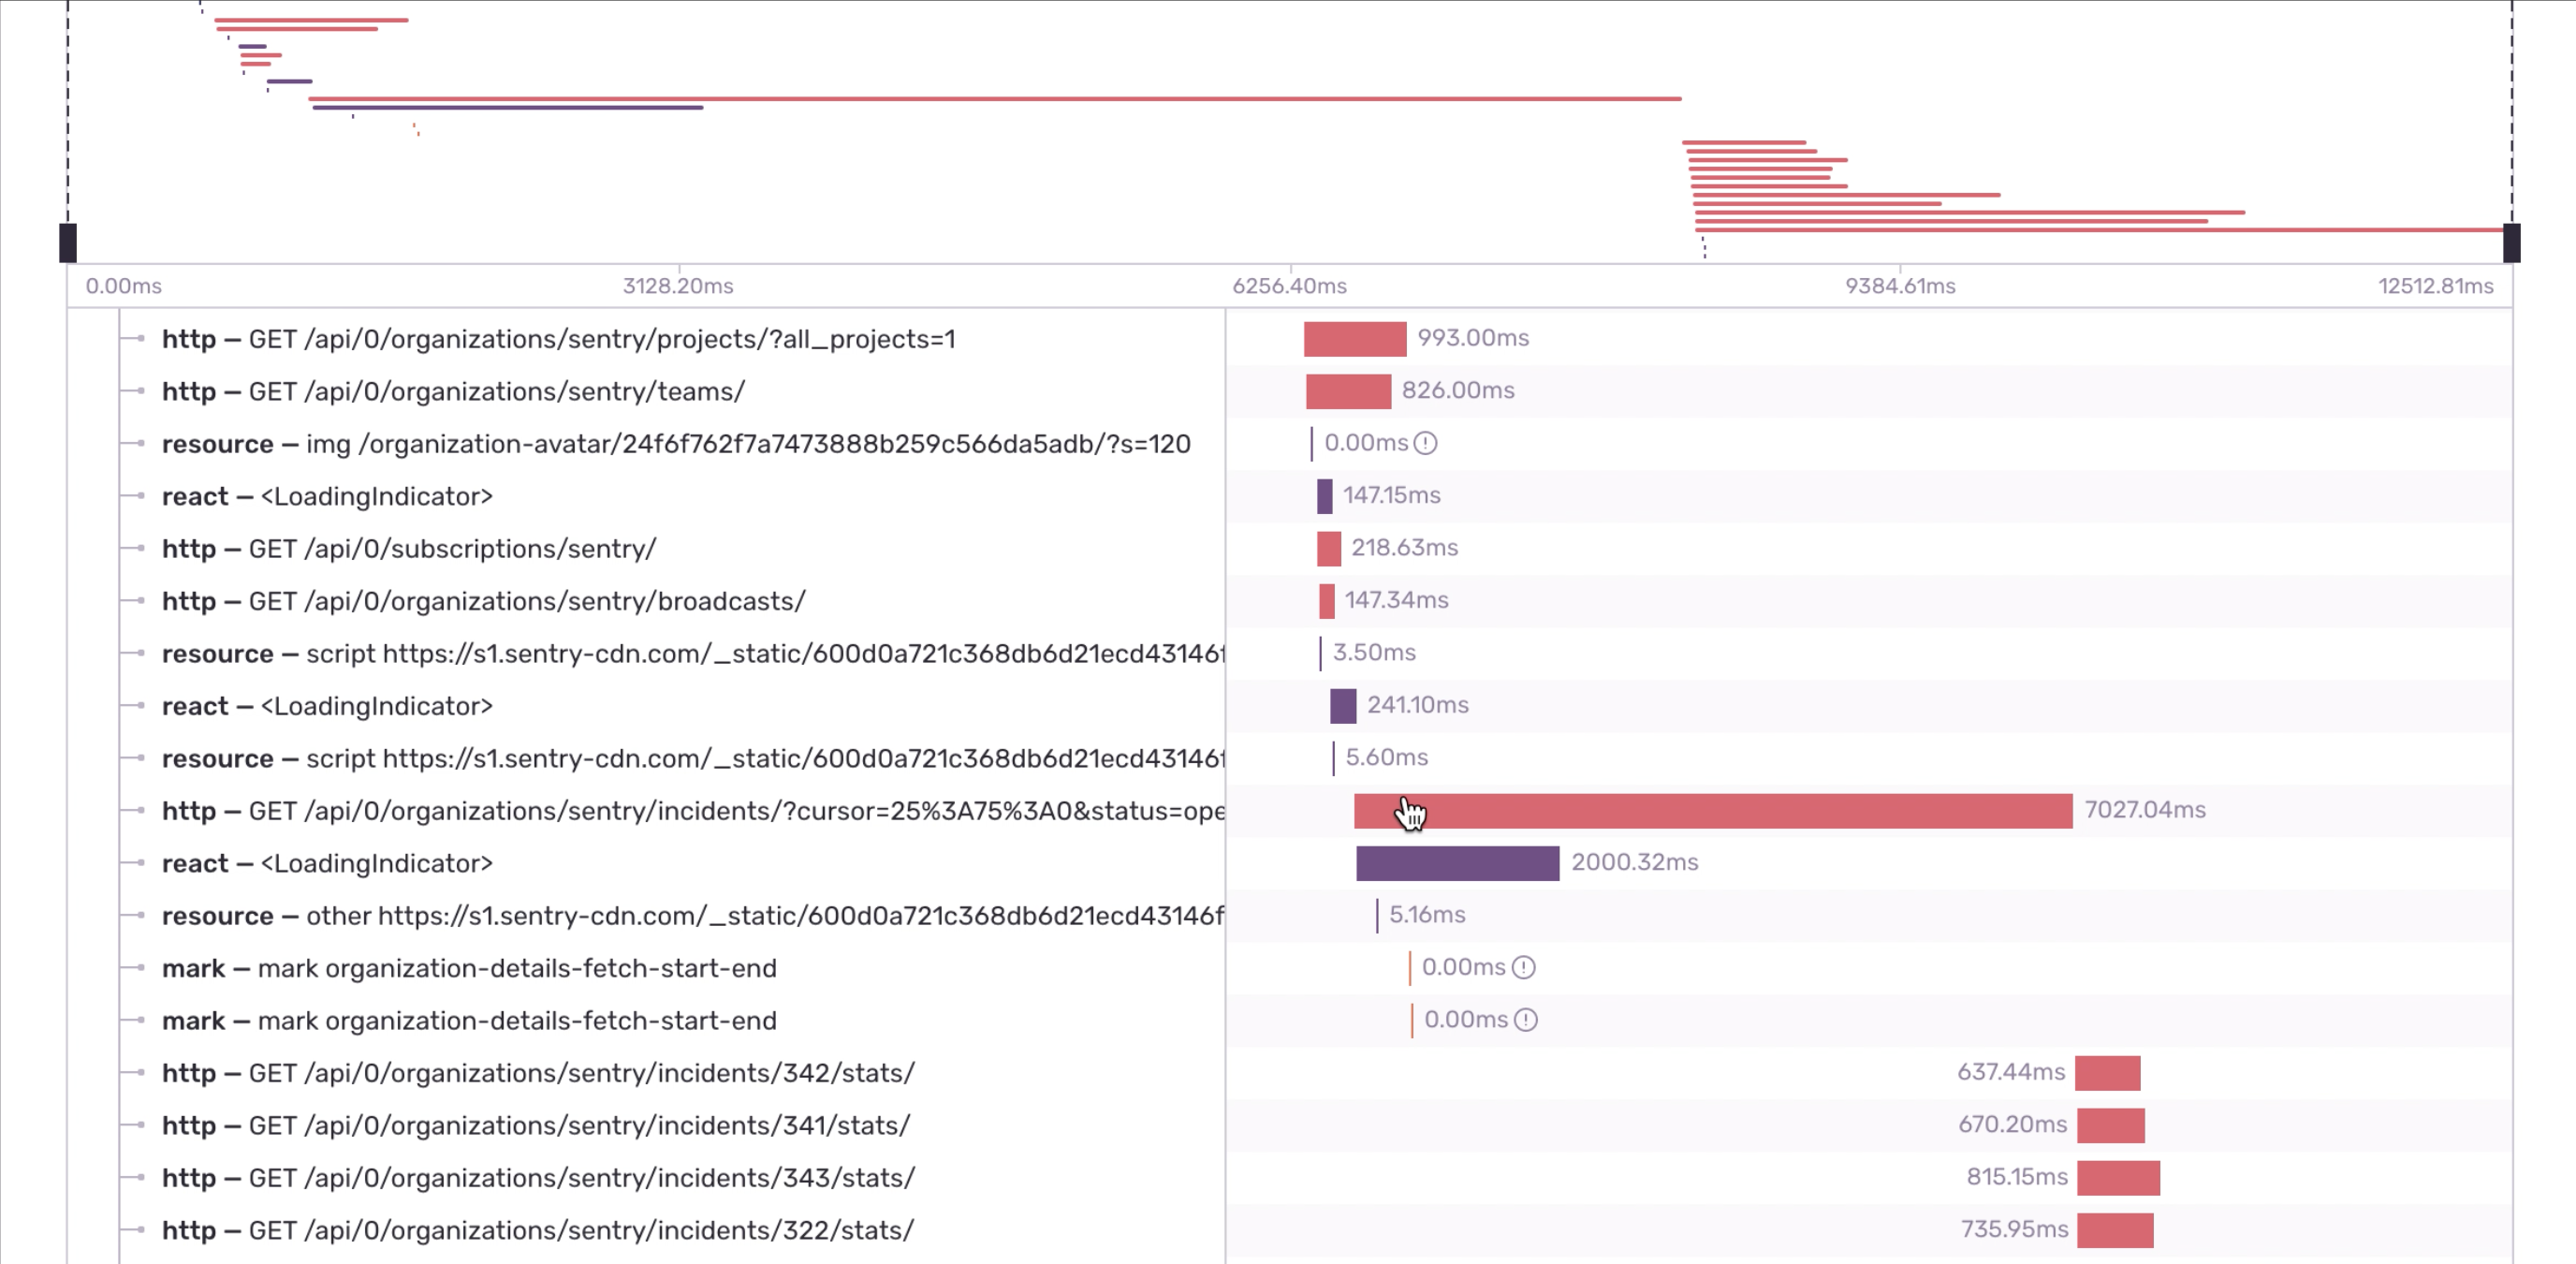
By using the tracing capabilities as a part of our new performance monitoring offering, Zac found out that an incident’s endpoint call was taking seven seconds to complete. This, along with a handful of other queries, were powering the trend graphs and alert statistics which impacted load time.
Resolution
Enter Billy Vong and Dan Fuller, specialists in delivering quality customer experiences. They solved the problem by deferring the slow-loading queries to run shortly after the page loads. This way, the most relevant alert data would load first and then trend graphs and supporting statistics would follow. The result? A landing page that loads in less than 300 ms.
Application monitoring means monitoring all aspects of your code, not just your errors. From getting notified with Metric Alerts and analyzing the code with Discover, to using tracing the issue with Performance, the team was able to run circles around the frontend/backend feedback loop.


