Detecting Main Thread Issues in Mobile Applications
Detecting Main Thread Issues in Mobile ApplicationsMobile device users care about three things when it comes to good app performance:
Smooth UI
Long battery life
How quickly the app does what they need it to do
We’re going to look at how modern concurrency APIs can help with some of these.
We recently shipped a new profiling feature to help you find the sources of main thread contention; specifically detecting issues with image and JSON decoding or regex matching. These point you to spots where you can immediately make improvements to your app’s UI performance.
Let’s take a closer look at how and why offloading work from the main thread can polish your app experience.
The main thing about UI
Both iOS and Android use a dedicated “main” thread that handles drawing the UI and responding to users’ actions. When we do a lot of additional unrelated work on this thread, we can delay subsequent UI renders. A device with a refresh rate of 120 Hz must redraw the entire screen every 8.3 milliseconds. If the main thread is kept busy for too long, it may “miss” or “drop” frames — and if enough frames are dropped, users will notice hitches in “janky” animations, or “hangs” in a completely unresponsive UI. While Apple states that humans can perceive a screen refresh delay of around 100 ms, research from MIT shows this could be as little as 13 ms — meaning just one missed frame render at 60 Hz.
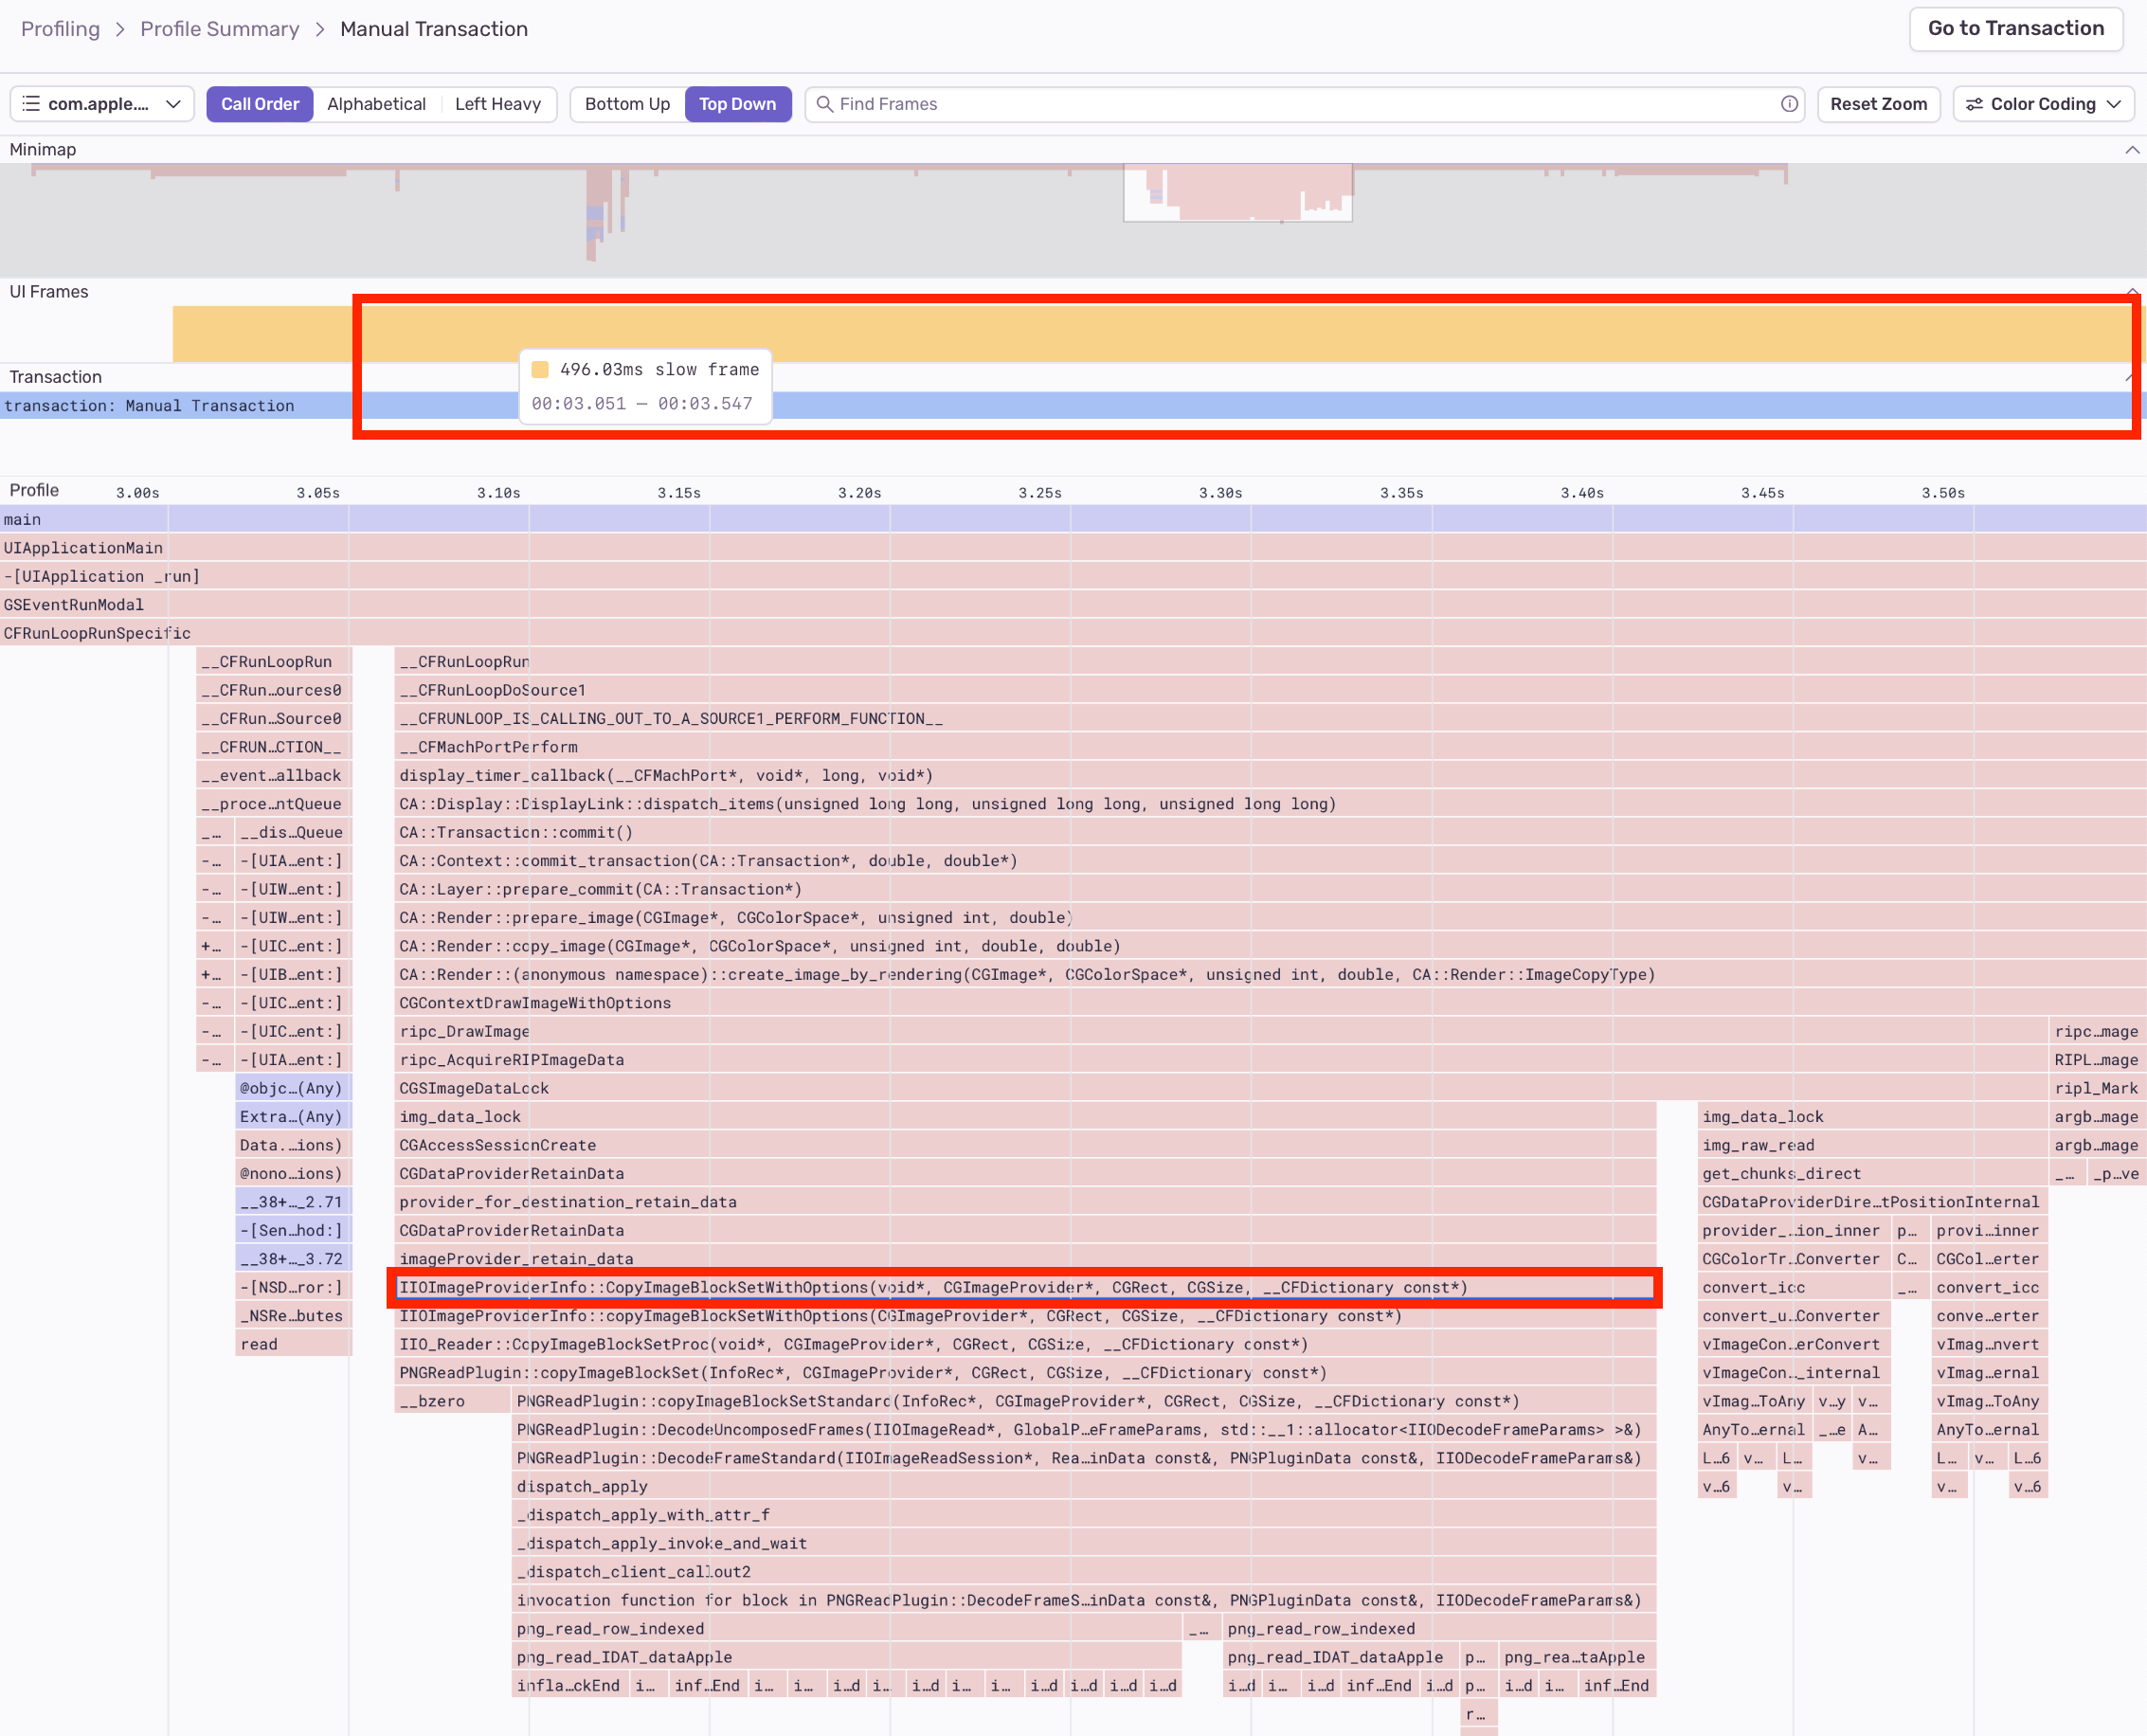
Sentry already detects dropped frames — and in our new flamechart viewer, you can see where a dropped frame occurs directly above the functions running at that time. If your flamechart shows complex stack traces on the main thread that line up with dropped frames, the first course of action is to move as much of that work off the main thread as possible.
A profile detail page showing dropped UI frames coincident with an image decode on the main thread. The highlighted frame in the stack trace is one of the function signatures we search for to detect Image Decoding on Main Thread performance issues.
It can be challenging to manually determine the true source of frame drops. Thankfully, Sentry’s servers can sift through vast amounts of data to look for calls to API in NSJSONSerialization, NSRegularExpression, and UIImage in your profiles (the latter was previously mentioned in our series Improve Performance in your iOS Applications). Calls from these API can last longer than a UI render interval and can safely run in a separate thread, allowing the UI to go on drawing newer frames while the work is being done. Then when the results are ready, an update can be dispatched back to the main thread to display them.
Queue up...
Maybe you’ve experienced strange bugs when updating the UI from a background queue, or have encountered warnings from Xcode’s Main Thread Checker. The typical solution to this issue is to dispatch the UI update to the main queue using Grand Central Dispatch (GCD).
To do the inverse of moving work to a background thread, you’d set up a new GCD queue with a lower Quality of Service (QoS) like QOS_CLASS_USER_INITIATED or QOS_CLASS_BACKGROUND. Or you could opt for NSOperation’s object-oriented API over GCD with extra options like dependencies and cancellation. On macOS, you can delegate work to an entirely separate process using XPC.
You could, of course, dip your toes into NSThread or POSIX threads — however, this isn’t recommended unless you need more precise control beyond what GCD or NSOperation provide. Higher-level APIs take care of low-level details like matching thread pool sizes to the number of available cores, which will be different from machine to machine.
Face off!
The best way to illustrate the difference between a stalled main thread and one that’s unburdened of non-UI work is to see an example of each running side by side.
Let’s set the scene: it’s been busy at work lately. You’re trying to track down an issue in your code, and need to scan through log files to find the first messages from certain classes. Separately, a new feature you’re writing requires you to parse JSON files and extract the top-most elements for analysis.
You write an iOS app that will display the results in a table view, so you have something really slick to show off at your next company show-and-tell. First, you load the logs from disk and find the first regex match in each, displaying each result in its own cell; then, the JSON files, parsing them and inspecting their structural elements. And for a finishing touch, you sprinkle in some stock images. Pics just really make things pop, don’t they?
You add a spinner and text label to show progress while the app churns through its work, and finally send Testflight builds to some coworkers to preview. But something’s wrong — you start getting emails saying it doesn’t seem to be working. Because everything was done on the main thread, it can’t update the progress UI or table view — the app can’t even respond to gestures. Most people that tried it thought that the app was frozen and simply force-quit it. Others who waited it out finally saw the results unceremoniously dumped onto the screen all at once at the end. Yuck!
a janky UI is born
So what happened here? Because all the tasks were done one after the other on the main thread, the UI couldn’t update again until they all finished, one by one. You can see from an Instruments trace that the main thread was pegged with work, causing an app hang:
Instruments trace showing the main thread doing all the work, causing an app hang. Recorded on an iPhone 14 Pro.
Luckily, you had Sentry integrated and profiled your code. A couple performance issues appear on your dashboard, showing you all the things you could move to a background thread. You opt to schedule them with a separate NSOperationQueue per type of work; then you can enqueue a final operation to stop the progress spinner, which is dependent on all tasks to complete. Each operation block submits an update to the table view when it’s done so we can see results in real time. You can scroll through the ones displayed so far, or even back out of the screen to cancel the work. (OK, that last part isn’t implemented, but it’d be easy enough with NSOperation cancellation.)
I can’t believe it’s not beachballing!
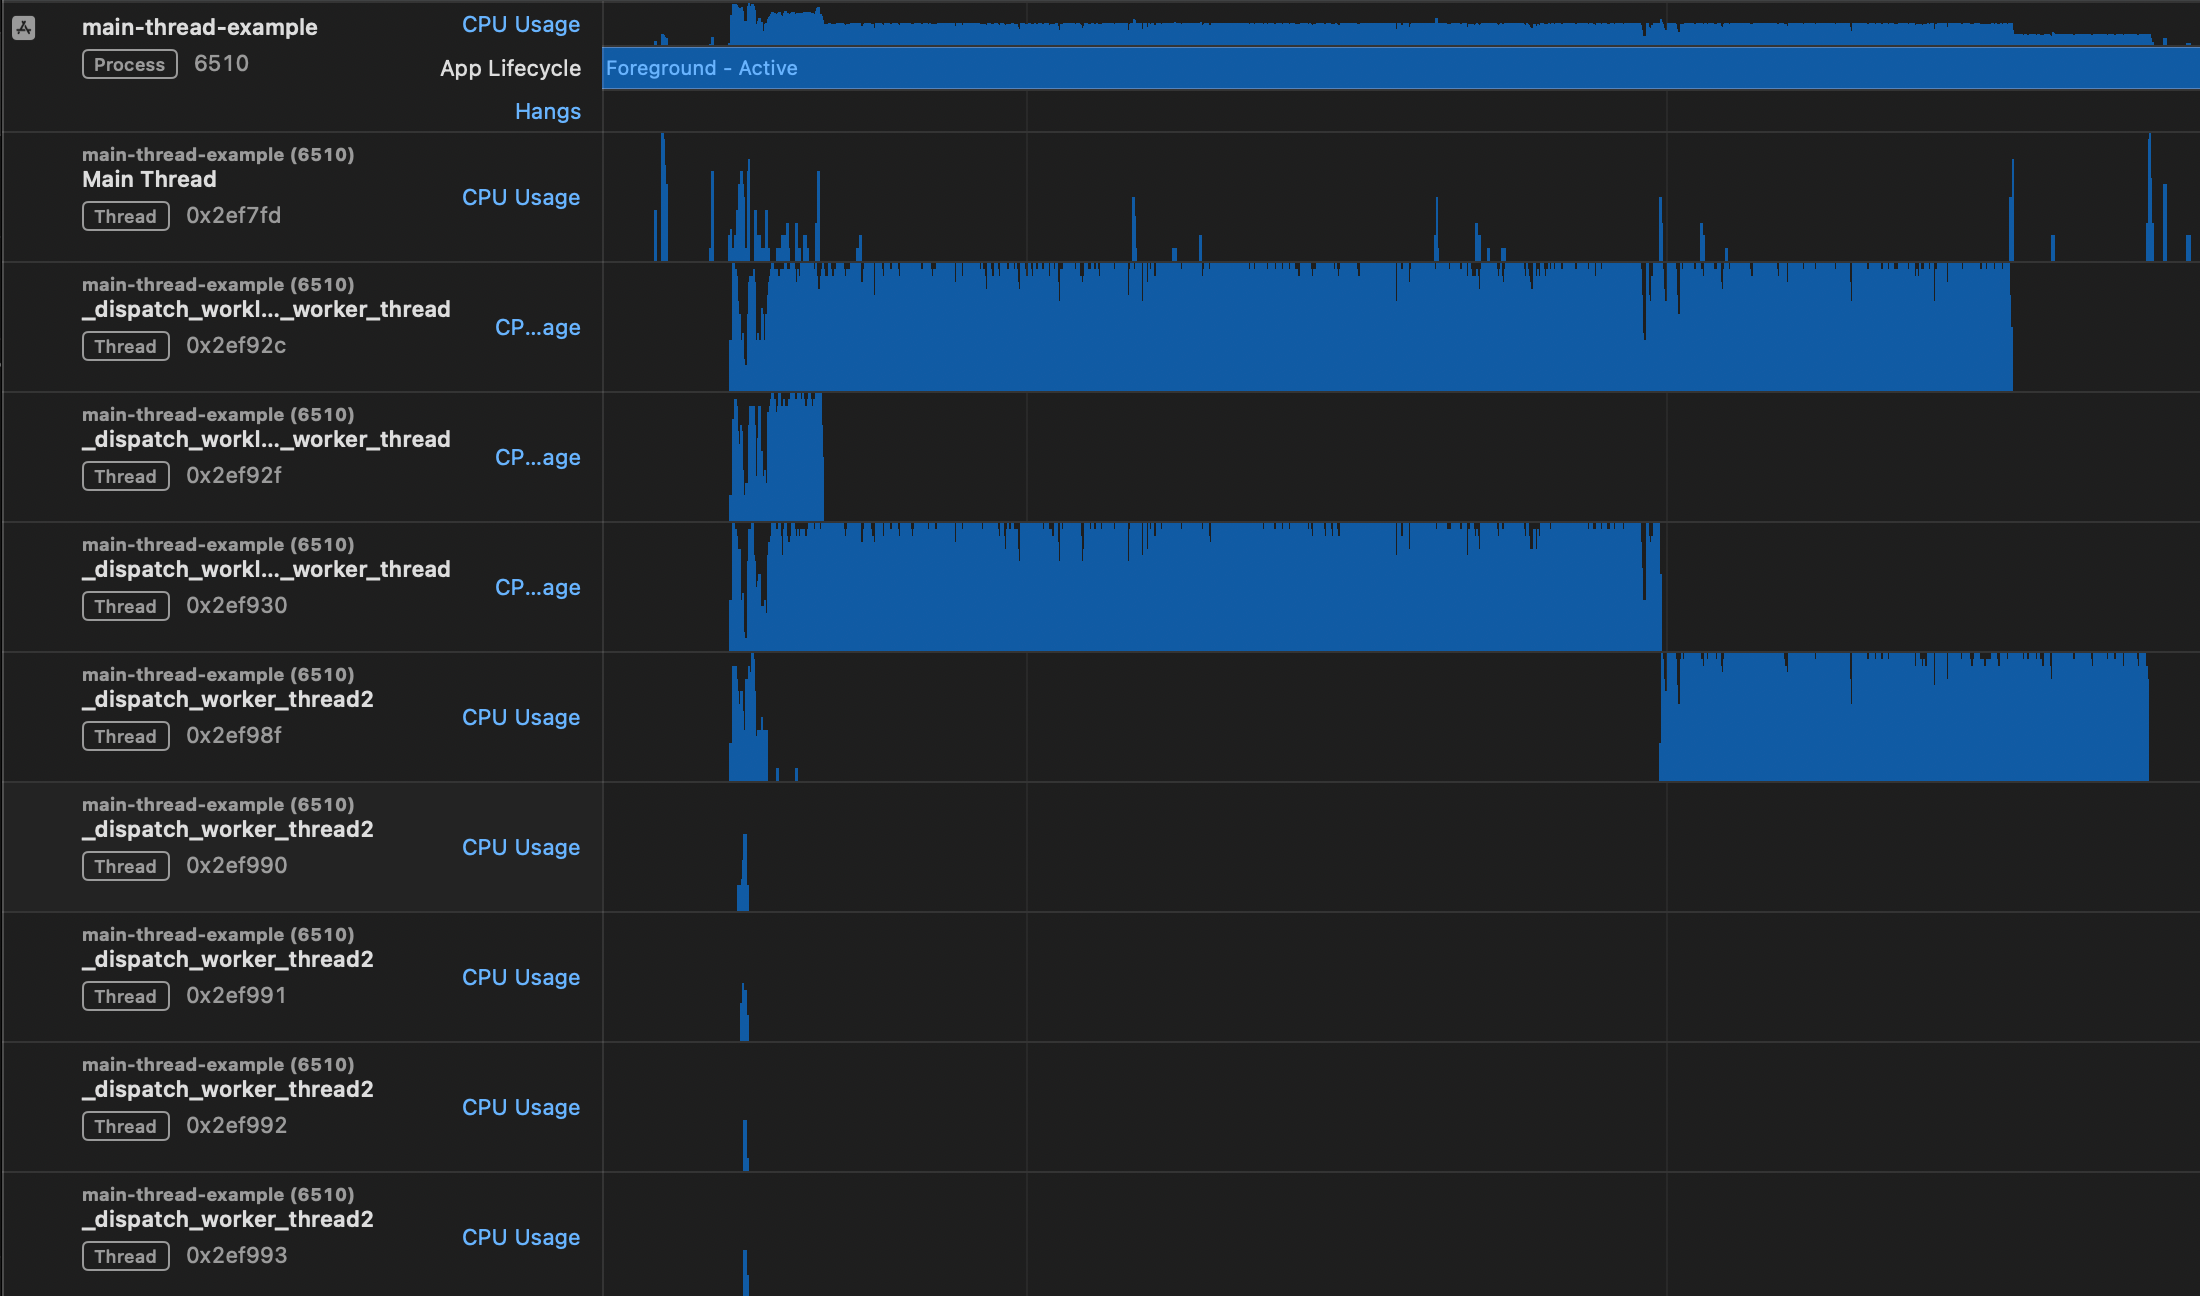
Let’s see what our threads are up to in this improved example:
In the screenshot above, you can see the Instruments trace showing other threads doing the non-UI work so our main thread can draw updates as results come in. If you look at the code, there are three NSOperationQueues used to schedule up to two concurrent tasks each, but that doesn’t mean there are always 6 threads going. At the beginning, there were actually 8 threads running at once, even though the iPhone 14 Pro only has 6 cores (2 performance and 4 efficiency), but later only 2 threads were running simultaneously.
Hot knife, meet butter
Offloading work from the main thread allows your app to maintain a buttery smooth UX and match the speed of your users’ thoughts. The trick to optimizing performance is correctly prioritizing the different kinds of work it needs to do.
Flamecharts can help, but they can also be hard to interpret. Fortunately, Sentry’s Performance Issues can help point out specific tasks that you should consider moving to background threads. We’re testing the next batch of main thread anti-patterns that we can reliably detect, helping you deliver the smoothest possible app experiences.


