Improve Performance in your iOS Applications - Part 2
Improve Performance in your iOS Applications - Part 2
The performance of your iOS app is crucial when building and publishing it for any number of users. Your users expect it to be delightful, fast and responsive, so if your app seems sluggish or unresponsive, it will affect your reviews and you might lose valuable users. While solving this for your apps, it's easy to overlook the influence of the choices made on performance throughout development.
This is the second article in the series, which focuses on iOS performance tips that help you improve the UI interactions, media playback, animations and visuals, etc. delivering a smooth and seamless experience.
It is important to make sure there's an issue to be fixed before attempting to optimize any code! Don't fall prey to the temptation to "pre-optimize" your code, which is a mistake. Make regular use of Instruments to profile your code and discover any flaws. Matt Galloway has a nice lesson on how to optimize your code using Instruments.
Some of the suggestions made in this article may need a lot of effort to implement, or may make your code more difficult; thus select cautiously. Let's dive right in.
You can read about the first article in the series here, which focuses on performance tips that help you improve compile time of your iOS apps, build apps faster, and focus on iOS performance improvements in the build system.
Monitoring Application Behavior
Apple's iOS App Store is a massive market with millions of applications, and it provides several opportunities for any organization or individual to develop and publish apps. However, with so many apps accessible, determining your "sweet spot" - the best place to attract new customers – may be difficult.
You must develop a set of indicators that will allow us to monitor your success against your objectives before you can expect to see an increase in your App Store revenue. Maintaining vigilance and knowing how your app will react when new features are deployed is critical after metrics and a clear aim for measuring performance have been defined.
Sentry is an essential monitoring tool to maintain the health and performance of your application code. Error Tracking and Mobile Performance Monitoring features enable you to see, correct, and learn about the applications from the frontend to the backend in a more clear, quick, and efficient way.
Sentry's iOS performance monitoring for iOS applications allows you to determine the root of performance issues, such as slow API calls and database queries.
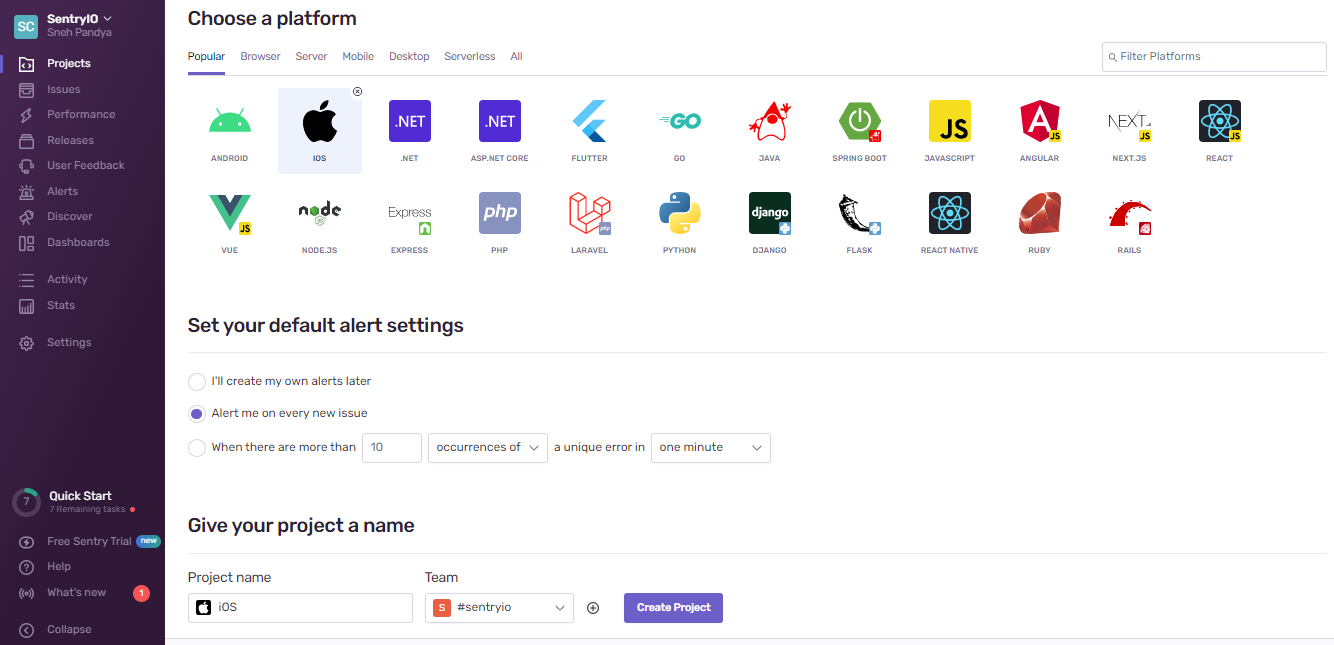
Setting up Sentry for your iOS application takes just a couple of steps once you sign up, also visible in the below image:
The iOS SDK setup is required with the steps in order to start receiving data on your Sentry dashboard to track, identify and resolve alerts and performance issues.
In this article, we will briefly understand how Sentry helps monitoring your iOS application performance.
The Fundamentals of iOS UI
Before going into the recommendations, it is important to define and understand how the main thread works, in order to optimize performance of the rendering UI.
As a rule of thumb, the main thread shouldn't be used for very heavy tasks. Instead, it should mostly be used for actions like:
Accepting user input and interactions
Displaying results and updating the UI
Most of the time, the main thread processes too many things, which leads to loss or drop of frames. This happens when the device cannot process the standard frame rate and the user witnesses a lag or stuck screen.
So, it becomes important to identify which frames have been lost and which haven't, but how?
There are times when it's easy to spot them, because the most important thing is that they aren't responding. Other times, it isn't, and you need something more accurate to track them down. If you want to track them quickly, you can make use of profiling tools to identify the issue.
Once you identify the root causes behind the frames dropping, you can address them during your development. Here are some of the possibilities you can think of, to overcome frame-drops:
Limiting the number of views being rendered on the mobile screen
Avoid transparency to elements wherever applicable
Reduce the amount of time and frequency of requested jobs
Decode JPEG images
Perform operations on background threads
Let's go over them one by one.
How to Reduce View Hierarchy
The easiest thing to start with is to reduce the number of views in the view hierarchy and avoid transparency wherever possible. To achieve the same, below code snippet helps drawing a white background which instructs the rendered to avoid any complex processing of transparency:
label.layer.opacity = 1.0
label.backgroundColor = .white
To verify the transparency overlapping issue is fixed, you can use the Color Blended Layers tool from Debug --> View Debugging --> Rendering menu in your Xcode.
Reduce the Frequency of Operations
Functions like cellForItemAt, indexPath, and scrollViewDidScroll must be very smooth and fast because they are called frequently, almost every moment, so they need to be very quick.
You should always make sure you have the simplest views and cells you can create and maintain. You should also make sure the configuration methods you use are always very light, such as layouts with constraints.
Decode Images
When it comes to missing frames, one of the most common culprits is image decoding. Typically, imageViews do this process on the main thread, behind the scenes. However, this might occasionally cause a continuous slowness in your apps, particularly when the images are rather large in size or resolution.
One solution to this issue is to delegate the decoding task to the background thread or queue. The operations will not be as efficient as the UIImageView's standard decoding, but the mainThread will be free.
In this approach, it is important to sync specific updates, such as errors or warnings, because they are handled by the main thread and the image processing happens on the background thread to avoid any glitches, or crashes.
Bonus Tip: Handle App in Background
Official documentation from Apple Developer indicates that you should prepare your app to run in the background. Even the simplest instances when the user exits a foreground app, your app moves to the background before UIKit suspends it. According to the documentation guidelines, when your app is in the background, it should do as little as possible, and preferably nothing.
In such cases, all the processes including non-main thread operations, should also release resources in use - without hurting your app's performance. When your app goes in the background, UIKit calls one of the following methods of your app:
sceneDidEnterBackground(_:)method of the appropriate scene delegate for apps that support ScenesapplicationDidEnterBackground(_:)method for all other apps
The good thing is, you don’t need to discard the images that you loaded from your application's asset catalog.
Bonus Tip: Scaling Images
A UIImageView can only display images that have the same dimensions as the UIImageView. A UIImageView encased in a UIScrollView makes zooming in and out of photographs on the fly expensive.
It is possible to use a background thread to scale the image after it has been downloaded and used in the UIImageView if it is loaded from a remote service and you do not have control over its size before downloading.
Perform Optimized Operations
When dealing with certain properties of our UI Items, you may have encountered some off-screen rendering difficulties since you must prepare such elements before exposing them. In other words, it makes extensive use of the CPU and GPU. So, how can you identify this issue?
Color Offscreen-Rendered Yellow comes handy! You can find the same under Debug --> View Debugging --> Rendering menu.
With this tool, you can identify the elements in the yellow or red color depending on how resource-heavy they are.
A common example such as the use of cornerRadius property indicates something like this in your app:
imageView.layer.cornerRadius = imageHeight / 2.0
The above line of code results in a 50% more resource-heavy operation per image. To avoid this, you should adapt to the below performance best practices:
Avoid use of
CornerRadiusproperty, replace it with other approachesAvoid use of
ShouldRasterizeproperty unless extremely necessaryAvoid use of
Shadowsin most of the cases, since it leads to off-screen renderingAvoid use of
boundingRectWithSizefor text measurements since it leads to heavy processingMake use of
.rounded(), as they are lighter and less resource heavy while computation
Set Background Efficiently
colorWithPatternImage from UIColor class is designed to generate small repeating pictures as backgrounds, if you want to utilize a full-frame background, you must use UIImageView. In this case, switching to UIImageView may result in considerable memory savings.
UIImageView *bgView = [[UIImageView alloc] initWithImage:[UIImage imageNamed:@"background"]];
[self.view addSubview:bgView];
If your background is made up of small tiles, you should utilize the colorWithPatternImage function from UIColor class, which shows faster and consumes less memory.
self.view.backgroundColor = [UIColor colorWithPatternImage:[UIImage imageNamed:@"background"]];
Improve App Launch Time
It's a good idea to assess your iOS application launch time before making any optimizations. How much does your application take? There is a delayed starting time or are you OK with the existing threshold?
After you've done your research, you'll want to determine an app's realistic launch window. The initial frame of your app should take no more than 400 milliseconds to generate, according to Apple at WWDC 2019. If you have high hopes for your application, you should set this as a minimum goal.
There are three distinct types of launches:
When your application hasn't been started in a long time or after a reboot, you may experience a "cold startup." After a cold launch, each subsequent launch is referred to as a warm launch. System-side services are currently running and your programme has already been brought into memory. Restarting your application from the home screen or the application switcher will resume your previous launch. We don't have to wait long for your application to go live since it's already operating!
To examine how your code influences startup time, use Xcode's App Launch Time template. Using the template gives us an overview of the life cycle of the app when it is initially published. This is an excellent method for gaining early insight into which stages are generating the greatest delays. Instruments are particularly useful for honing in on code that is creating performance issues.
Sentry tracks application performance, measures metrics like throughput and latency, and displays the impact of errors across multiple services while capturing distributed traces consisting of transactions and spans to measure individual services and operations within those services.
For iOS, Sentry allows different SDK installation methods including Cocoapods SDK, Swift Package Manager and Carthage. The SDK is also capable of measuring app start activity, spanning different phases from the application launch to the first auto-generated UI transaction.
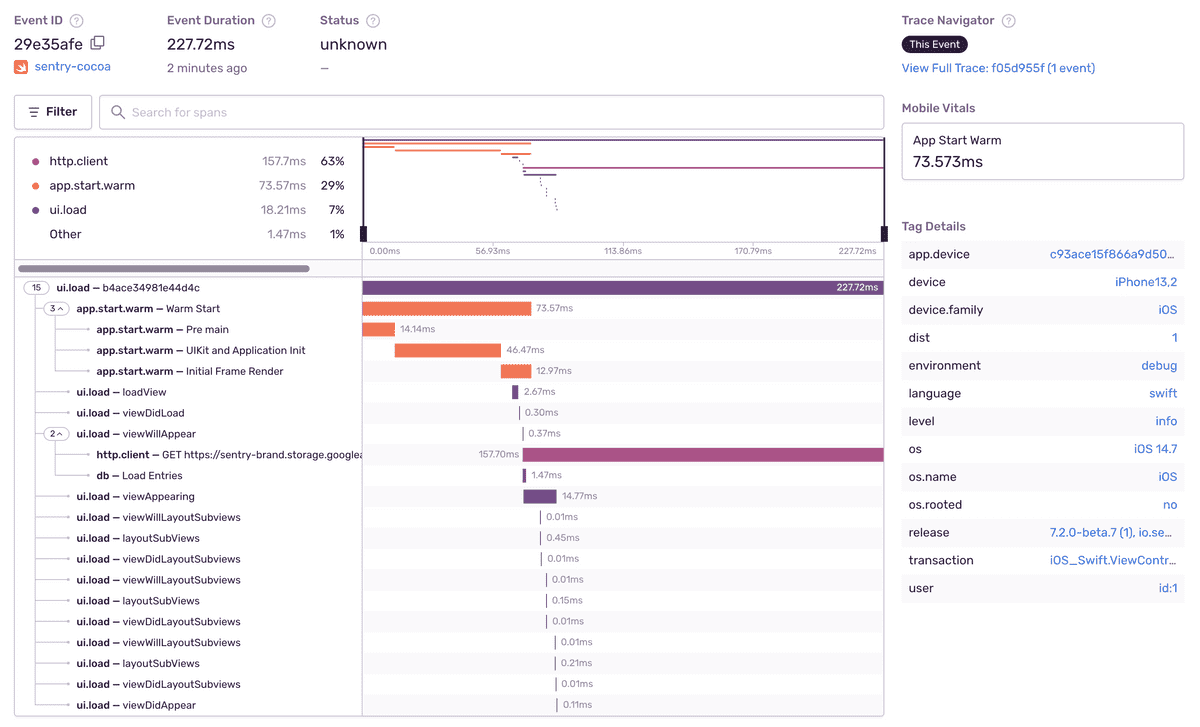
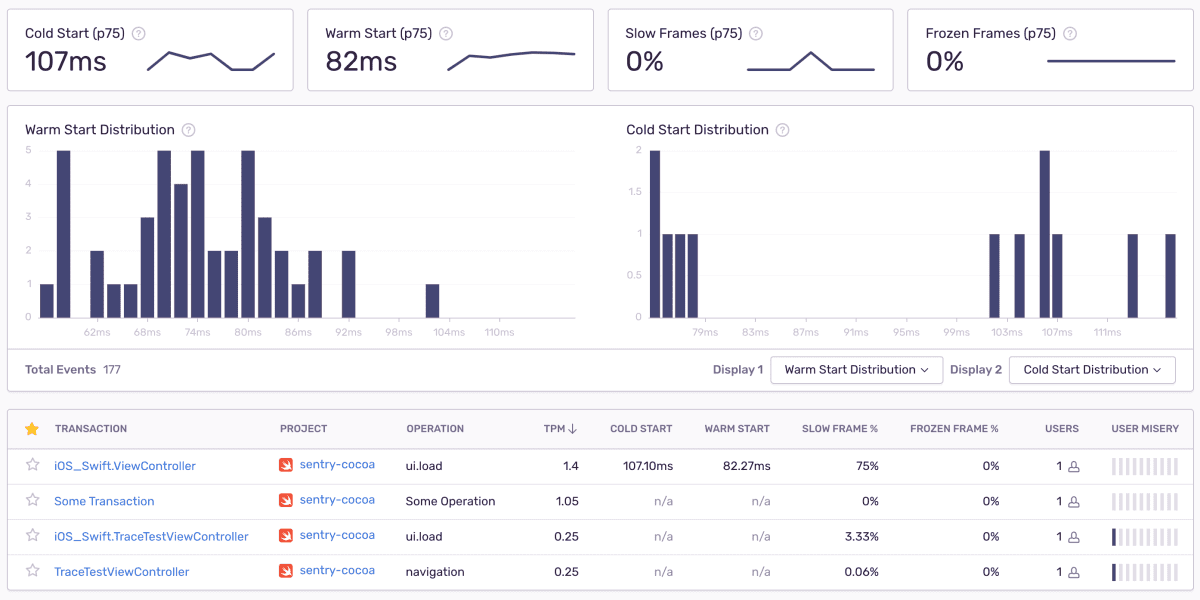
Application start metrics track how long your mobile application takes to launch. For this, Sentry measures cold starts and warm starts. The beginning of the app start is marked by the process start time, while the ending is marked by UIWindowDidBecomeVisibleNotification. The following are generated as a result:
Pre main: From the beginning of the process time to the runtime init.
UIKit and Application Init: From the runtime init to the
didFinishLaunchingNotification.Initial Frame Render: From
didFinishLaunchingNotificationtoUIWindowDidBecomeVisibleNotification.
The below image showcases the performance trace of an iOS application:
You can click on each of the events under ui.rendering to get more details and find out which events or elements are causing performance issues.
Lazy Load and Reuse Your Views
Those who have a lot of views nested within UIScrollView consume more CPU and memory than people whose applications don't have a lot of views. The idea is to duplicate the behaviours of UITableView and UICollectionView.
Instead of creating all of the subViews at once, create them as required and place them in a queue when they're done.
This way, you only need to create views when someone scrolls, which saves memory. The energy efficiency problem that arises while creating views impacts other aspects of your software as well. Assume a user hits a button and wants to display a view. There are two options:
As the screen loads, create and conceal the view, then reveal it when required
Make and display items as required
The first method has the advantage of requiring you to establish a viewpoint from the outset and maintain it until it is no longer required. This option consumes more memory than the second. Because when a user hits a button, your programme merely has to re-enable the view. The second option is the inverse – it uses less memory but runs somewhat slower when the button is pressed.
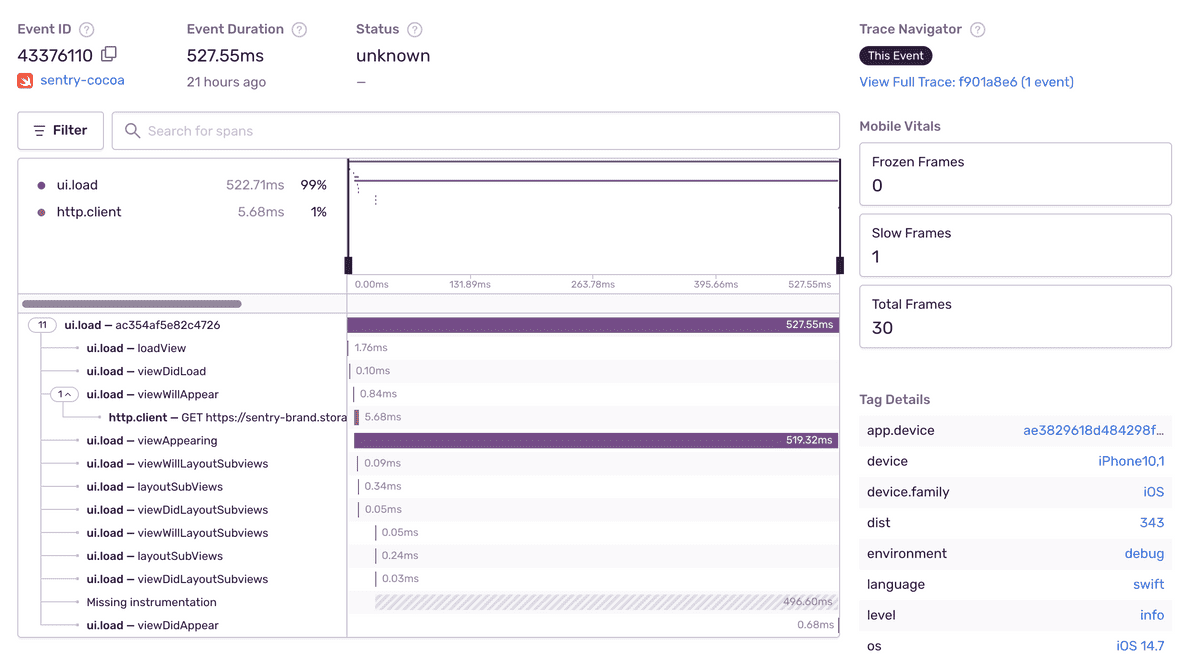
In such scenarios, Mobile Vitals Provides you information on your iOS app, allowing you to prioritize significant problems and quickly resolve them. Sentry detects sluggish frames and frozen frames to track user interface responsiveness. A phone or tablet typically renders 60 fps, which boils down to each frame being rendered at 16.67 ms.
Apple can use a faster frame rate, particularly as 120 fps panels become more common. Sentry detects the frame rate and changes the slow frame calculation for these programmes. In the example below, the transaction detail view shows the sluggish, frozen, and total frames:
Reuse Identifiers to improve performance
Setting the wrong reuse identifier for UITableViewCells, UICollectionViewCells, or even UITableViewHeaderFooterViews is a common application development mistake. The data source should often reuse UITableViewCell instances when allocating cells to rows in a tableView.
Without the reuseIdentifier, each time a table view is presented, a new cell must be set on the UI. This may have a major influence on performance, particularly the app's scrolling experience. In addition to UICollectionView cells and supplemental views, reuseIdentifiers should be used in header and footer views.
If required, this procedure removes cells from the queue or generates new cells with previously registered NIBs or classes. If there are no reusable cells and no classes or NIBs have been set up, this method returns nil.
Sentry allows you to set up alerts with real-time insights into errors, problems or even custom defined criteria that you can specify for your own applications:
New issues emerging
Increasing frequency of issues
Resolved or ignored issues in the past becoming unresolved and resurfacing again
You can also define alerts and receive notifications for a specific failure rate, latency of the action, and so on. You can create and manage alerts from the Alerts page on Sentry dashboard.
By default, Sentry will provide a considerable quantity of data as part of the problem notice. In certain circumstances, this data may be source code or other user data. Enabling the Enhanced Privacy option will allow you to regulate this. To do so, visit your organization’s dashboard, select Settings, and then check the option to allow increased privacy. Email alerts and other elements of the system will begin limiting data to the issue's title and description as soon as you activate this option.
How to Further Improve UI Scroll
If the user experience stutters when scrolling in the complex hierarchy such as Table view, make sure you perform the following to keep the table View scrolling smoothly:
reuseIdentifierin the proper manner when reusing cellsMake all the views opaque, including the cells
Avoid using gradients, zooming, or selecting a backdrop color.
Use asynchronous loading and caching if the data in the cell is retrieved from the Internet.
shadowPathshould be used to draw a shadow, only when necessary.Avoid using subviews as much as possible.
Avoid using
applycellForRowAtIndexPath. If you need to use it, do it just once and save the results in a cache.Provide
userowHeight.sectiona fixed height and avoid requests to the delegate while setting the height.
Caching to the Rescue
On iOS, there are various ways to build a visually appealing UI. Full-size pictures or resizable images may be used, and they can be rendered using CALayer, CoreGraphics, or even OpenGL. Each solution, of course, differs in terms of complexity and performance.
Utilizing pre-rendered graphics saves time by eliminating the need for iOS to create a picture, draw on it, and then display it on the screen The problem is that you must include all relevant photographs in your program bundle, which increases its capacity — which is why using variable-sized images is even better: you can save unnecessary space and avoid developing distinct images for different portions of your application, for example buttons.
Using images, on the other hand, means you lose the ability to change usability of the image, you will have to redo them repeatedly, which costs time and resources and if you want to create animation effects, even if each image represents only a small portion of the changes, you will need a large number of images, which increases the bundle size.
As a general trade-off, balancing performance against managing the growing bundle size is advisable.
One of the most popular methods to load an image from a bundle is imageNamed, the other one is image with content file, which is less common.
When images are loaded, imageNamed saves them in a cache. It searches the system cache for an image object with a specified name and returns it if it is found. Objects that don't have a matching picture in the cache are fetched from the provided document and then cached and returned using this function. imageWithContentsOfFile, on the other hand, just loads pictures.
The question is, how do you choose which one to use?
If you're just going to utilize heavy images once, there's no need to cache them. Instead, use an image with a Content file and save yourself the memory. ImageNamed, on the other hand, is a superior option in situations when images are often re-used such as lists.
How to Display Shadows Efficiently
To cast a shadow on a layer or view, usually developers choose the QuartzCore framework like below example:
#import <QuartzCore/QuartzCore.h>UIView *view = [[UIView alloc] init];view.layer.shadowOffset = CGSizeMake(-1.0f, 1.0f);view.layer.shadowRadius = 5.0f;view.layer.shadowOpacity = 0.6;
This seems a lot easier for the system to represent. Isn't it? Sadly, the above strategy is flawed. So Core Animation must first execute an offscreen pass to identify your view's exact shape, which is resource heavy.
Using shadowPath takes care of the issue:
view.layer.shadowPath = [[UIBezierPath bezierPathWithRect:view.bounds] CGPath];
With shadowPath, iOS no longer has to recalculate how to draw each time. Instead, it utilizes a previously determined route. Problems arise when you have to calculate and update the shadow path manually in certain views, and this is time-consuming.
Be Aware with Memory Warnings
iOS notifies all running applications when the system memory is low. When your app receives a memory warning, it must clear up as much memory as possible. That is in accordance with the guidelines established by the Apple team. The most efficient way to do this is to remove strong references to reusable caches, image objects, and other stuff. UIKit, for the most part, makes it simple to keep track of low memory notifications.
On the other hand, Sentry adds breadcrumbs prior to an issue developing. As is the case with traditional logs, these events may include a plethora of structured data. You can allow the SDK to automatically capture the breadcrumbs for your app such as click and keypress events, or manually add a breadcrumb for specific actions performed using the code below
import Sentry
let breadcrumb = Breadcrumb()
breadcrumb.level = SentryLevel.info
breadcrumb.category = "auth"
breadcrumb.message = "Authenticated user \(user.email)"
SentrySDK.addBreadcrumb(crumb: breadcrumb)
You can refer to this documentation to understand and configure the data and properties of a breadcrumb. After obtaining these alerts from the system, you should remove any unnecessary objects from the memory. Furthermore, it is possible to erase images from an app's image cache that are not currently shown on the screen. If you do not handle memory alerts in this way, the operating system may shut down your app. To free up memory, the object must be able to be recreated. When creating, keep a watch out for emulation-based rendering.
For end-users, the response time is crucial as delays or unresponsiveness due to memory overflow and other things may frustrate the user, resulting in the user abandoning the app altogether.
Sentry Metrics provide you a better understanding of how your users are interacting with your app. You can quantify the health of your app more quickly and discover faults or performance concerns that may be developing, such as out of memory errors (OOMs).
Before your app terminates, the Apple SDK writes a report to disc with data like the stack trace, tags, and breadcrumbs. This is because OOM crashes force the OS to stop your software without notice. It's not easy to get the app's state back after an OOM. So we'd need to routinely store the app state. This would generate a lot of I/O, slowing down the application. OOM occurrences lack context.
Managing -Legacy Projects
Storyboards have replaced XIBs as the main visual design tool in iOS 5. While XIBs might be advantageous in certain situations, they are not always required. You'll have to deal with them unless you're targeting pre-iOS 5 devices or utilizing a custom reusable view.
If you must utilize XIBs, keep them as simple as possible. If a view controller's view hierarchy necessitates the creation of many XIBs, construct one for each XIB. Any images included inside the XIB are also included in the memory load and should be considered. Remove any views that aren't presently being used to conserve memory. Storyboards prevent this from occurring since they only build view controllers when they are absolutely necessary.
When you load a nib file that contains references to an image or sound resource, the nib-loading process loads and caches the actual image or sound file. OS X saves picture and sound resources in temporary caches so that they may be accessed later. On iOS, named caches only store picture resources and no other sorts of data. Depending on your platform, the imageNamed: method of NSImage or UIImage may be used to obtain images.
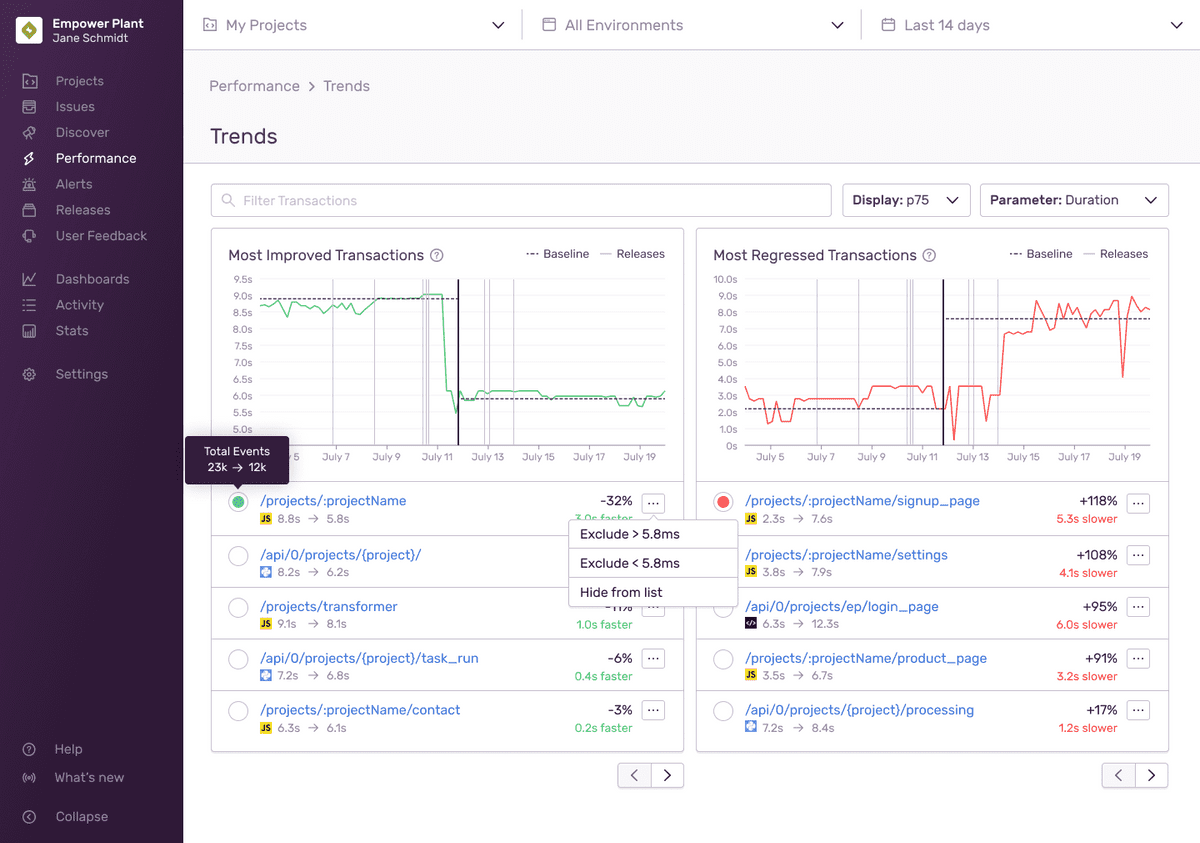
Sentry identifies transactions that have had significant changes in their performance over time with Trends. This view is ideal for providing insights when you have transactions with large counts. You can access the Trends View from the Performance homepage by clicking the tab in the top right corner of the page. Over time, this page highlights deals that have seen notable changes to their profitability.
Conclusion
Despite the importance of application performance, it is often disregarded by developers. As a result, we tend to only use the most powerful devices and the most expensive data plans while developing our applications. As a result, we are blind to the consequences of our underperformance.
In this article, you gained knowledge about improving iOS application performance for UI, animations and more. This article tries to ensure all the UI updates, frontend rendering, animations and how Sentry can help you supercharge your performance improvement journey.
This is the second article in the Performance Series: Improve your iOS Applications. You can read about the first article in the series, which focuses on performance improvements for iOS build processes and build systems. Stay tuned for upcoming articles (update: part 3 and part 4 are published) in the series, which will focus on UI improvements, code improvements, animations, visual experience best practices and much more.

