Debugging Python Errors
Debugging Python Errors

One of Sentry’s more powerful features comes with languages like Python. In Python, PHP, and the JVM, we’re able to introspect more deeply into the runtime and give you additional data about each frame in your call stack. At a high level, this lets you know things like calling arguments to your functions, allowing you to more easily reproduce and understand an error. Let’s dive into what this looks like, and how it works under the hood.
We’ll start with what a Python error might typically look like in your terminal, or in a standard logging system:
TypeError: expected string or buffer
File "sentry/stacktraces.py", line 309, in process_single_stacktrace
processable_frame, processing_task)
File "sentry/lang/native/plugin.py", line 196, in process_frame
in_app = (in_app and not self.sym.is_internal_function(raw_frame.get('function')))
File "sentry/lang/native/symbolizer.py", line 278, in is_internal_function
return _internal_function_re.search(function) is not NoneWhile this gives us an idea of the type and location of the error, it unfortunately doesn’t help us understand what is truly causing it. It’s possible that it’s passing an integer or a NoneType, but, realistically, it could be any number of things. Guessing at it will only get us so far, and we really need to know what function actually is.
An easy and often very accessible option to do this would be to add some logging. There’s a few different entry points where we could put logging, which makes it easier to implement. It also lets us ensure we specifically get the answer we want. For example, we want to figure out what the type of function is:
import logging
# ...
logging.debug("function is of type %s", type(function))
Another benefit of logging like this is that it could carry over to production. The consequence is generally you’re not recording DEBUG level log statements in production as the volume can be significant and not very useful. It also often requires you to plan ahead to ensure you’re logging the various failure cases that could happen and the appropriate context with each.
For the sake of this tutorial, let’s assume we can’t do this in production, didn’t plan ahead for it, and, instead, are trying to debug and reproduce this in development.
The Python Debugger
The Python Debugger (PDB) is a tool that allows you to step through your call stack using breakpoints. The tool itself is inspired by GNU’s Debugger (GDB) and, while powerful, often can be overwhelming if you’re not familiar with it. It’s definitely an experience that will get easier with repetition, and we’re only going to go into a few high level concepts with it for our example.
So the first thing we’d want to do is instrument our code to add a breakpoint. In our example above, we could actually instrument symbolizer.py ourselves. That’s not always the case, as sometimes the exception happens in third-party code. No matter where you instrument it, you’ll still be able to jump up and down the stack. Let’s start by changing that code:
def is_internal_function(self, function):
    # add a breakpoint for PDB
    try:
        return _internal_function_re.search(function) is not None
    except Exception:
        import pdb; pdb.set_trace()
        raise
We’re limiting this to the exception, as it's common you’ll have code that runs successfully most of the time, sometimes in a loop, and you wouldn’t want to pause execution on every single iteration.
Once we’ve hit this breakpoint (which is what set_trace() is registering), we’ll be dropped into a special shell-like environment:
# ...
(Pdb)
This is the PDB console, and it works similar to the Python shell. In addition to being able to run most Python code, we’re also executing under a specific context within our call stack. That location is the entry point. Rather, it’s where you called set_trace(). In the above example, we’re right where we need to be, so we can easily grab the type of function:
(Pdb) type(function)
<type 'NoneType'>
Of course, we could also simply grab all locally scoped variables using one of Python’s built ins:
(Pdb) locals()
{..., 'function': None, ...}
In some cases we may have to navigate up and down the stack to get to the frame where the function is executing. For example, if our set_trace() instrumentation had dropped us higher up in the stack, potentially at the top frame, we would use down to jump into the inner frames until we hit a location that had the information needed:
(Pdb) down
-> in_app = (in_app and not self.sym.is_internal_function(raw_frame.get('function')))
(Pdb) down
-> return _internal_function_re.search(function) is not None
(Pdb) type(function)
<type 'NoneType'>
So we’ve identified the problem: function is a NoneType. While that doesn’t really tell us why it’s that way, it at least gives us valuable information to speed up our test cases.
Python Debugging in Production
So PDB works great in development, but what about production? Let’s look a bit more deeply at what Python gives us to answer that question.
The great thing about the CPython runtime — that’s the standard runtime most people use — is it allows easy access to the current call stack. While some other runtimes (like PyPy) will provide similar information, it’s not guaranteed. When you hit an exception the stack is exposed via sys.exc_info(). Let’s look at what that gives us for a typical exception:
>>> try:
...   1 / 0
... except:
...   import sys; sys.exc_info()
...
(<type 'exceptions.ZeroDivisionError'>,
    ZeroDivisionError('integer division or modulo by zero',),
    <traceback object at 0x105da1a28>)
We’re going to avoid going too deep into this, but we’ve got a tuple of three pieces of information: the class of the exception, the actual instance of the exception, and a traceback object. The bit we care about here is the traceback object. Of note, you can also grab this information outside of exceptions using the traceback module. There’s some documentation on using these structures, but let’s just dive in ourselves to try and understand them. Within the traceback object we’ve got a bunch of information available to us, though it’s going to take a bit of work — and magic — to access:
>>> exc_type, exc_value, tb = exc_info
>>> tb.tb_frame
<frame object at 0x105dc0e10>
Once we’ve got a frame, CPython exposes ways to get stack locals — that is all scoped variables to that executing frame. For example, look at the following code:
def foo(bar=None):
    foo = "bar"
    1 / 0
Let’s generate an exception with that code:
try:
    foo()
except:
    exc_type, exc_value, tb = sys.exc_info()
And finally, let’s access the locals via f_locals on the <frame> object:
>>> from pprint import pprint
>>> pprint(tb.tb_frame.f_locals)
{'__builtins__': <module '__builtin__' (built-in)>,
    '__doc__': None,
    '__name__': '__main__',
    '__package__': None,
    'exc_info': (<type 'exceptions.ZeroDivisionError'>,
                ZeroDivisionError('integer division or modulo by zero',),
                <traceback object at 0x105cd4fc8>),
    'foo': <function foo at 0x105cf50c8>,
    'history': '/Users/dcramer/.pythonhist',
    'os': <module 'os' from 'lib/python2.7/os.py'>,
    'pprint': <function pprint at 0x105cf52a8>,
    'print_function': _Feature((2, 6, 0, 'alpha', 2), (3, 0, 0, 'alpha', 0), 65536),
    'readline': <module 'readline' from 'lib/python2.7/lib-dynload/readline.so'>,
    'stack': [],
    'sys': <module 'sys' (built-in)>,
    'tb': <traceback object at 0x105da1a28>,
    'tb_next': None,
    'write_history': <function write_history at 0x105cf2c80>}
What we see above isn’t actually that useful. The reason being is that we’re one level up in our scope, so we’re seeing foo defined, but nothing actually relevant to the function call itself. This won’t always be true, but in our trivial example it is. To find the information we’re looking for, we’ll need to go one level deeper:
>>> inner_frame = tb.tb_next.tb_frame
>>> pprint(inner_frame.f_locals)
{'bar': None, 'foo': 'bar'}
You can quickly understand how this might be useful when we go back to our original TypeError. In that case, with the above introspection, we find out that function, which is expected to be a string, is actually set to a NoneType. We know that because Sentry has captured this error for us, and automatically extracts stack locals for every frame:
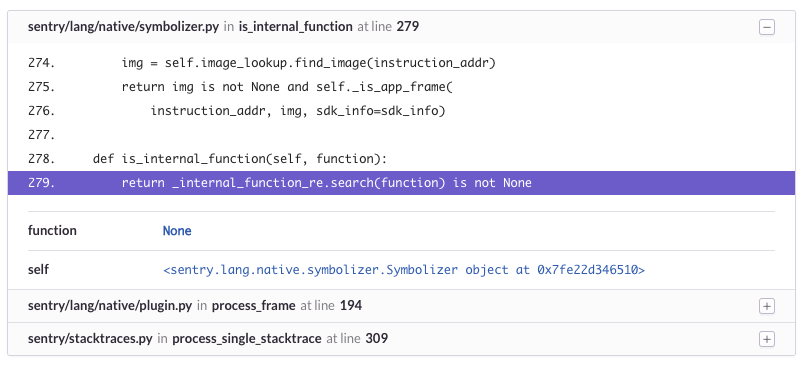
This was one of the first features we built in Sentry and, to this day, it remains as one of the most valuable debugging components we can provide. While we’re not able to always give you the details needed to reproduce an exception, in our experience it’s very rare that we actually need to manually instrument something to understand the context and, ultimately, resolve the issue.
If you’re curious about the full implementation, which also utilizes other various components form Python’s traceback structure, you can always take a look at our Python SDK’s source code on GitHub. In PHP and the JVM, the approach is slightly different due to the runtimes and, if you’re interested, you’ll also find those repositories on Sentry's GitHub. If you’re using Sentry, we’ll generally automatically instrument things for you, though the JVM requires a little bit of configuration (docs coming soon).