In order for users to get the most out of the data being sent to Sentry, it’s important that we make it easy to find that data.
Our team works on features to help users browse their data to find a particular event using search queries and filters.
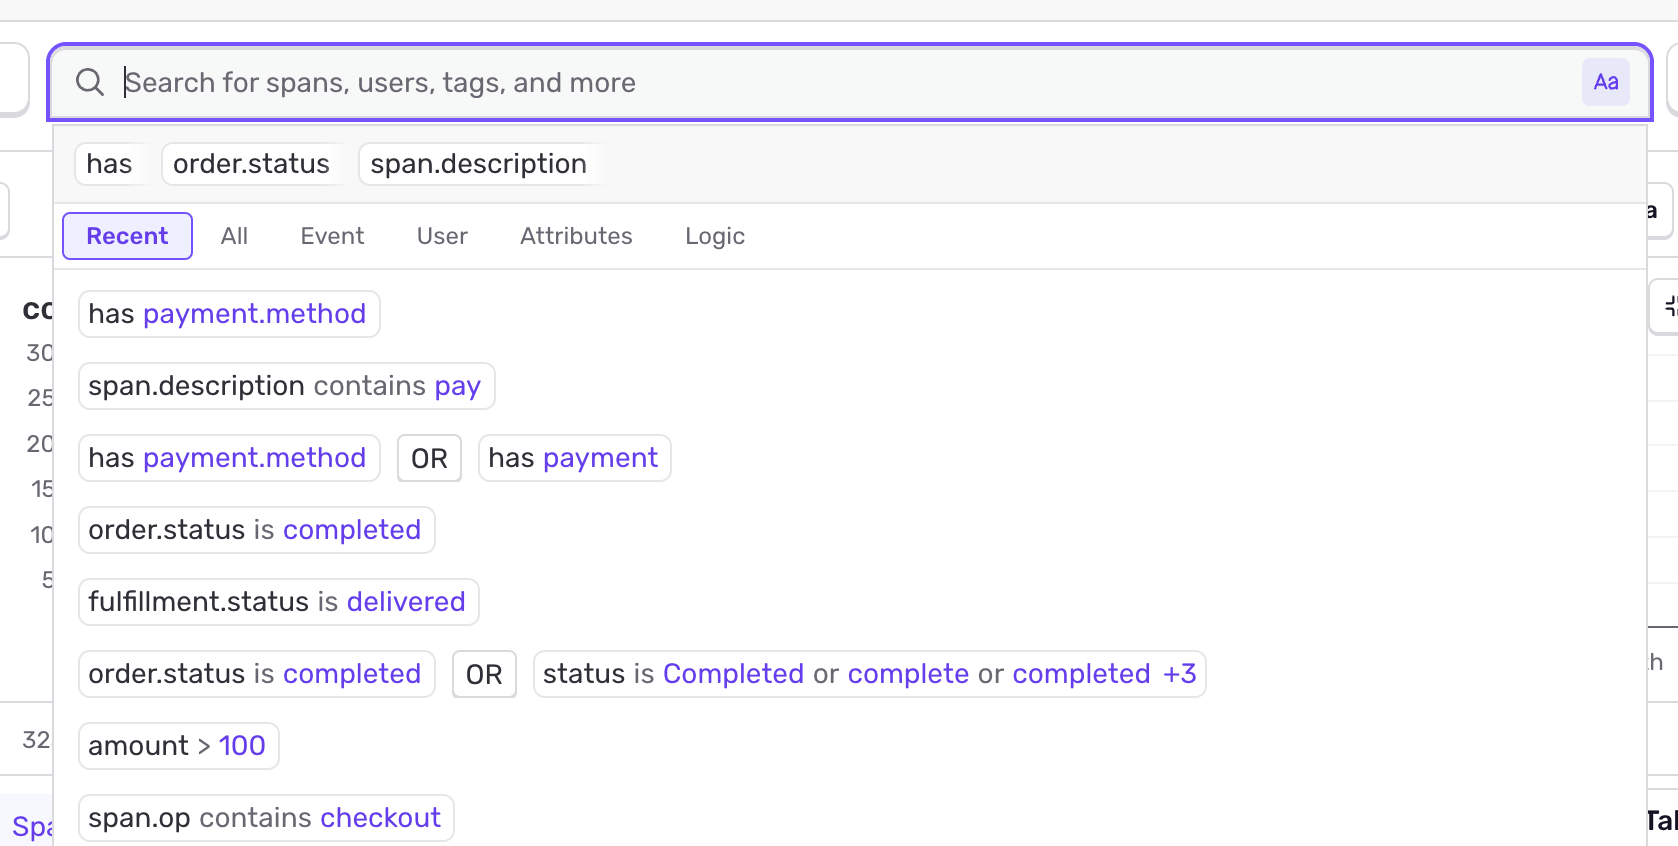
The search bar enables users to find their data by specifying search terms.
Searching uses the Sentry Search Syntax, which can be barrier for users. Instead, some prefer to specify their search terms using natural language as they do with other tools these days. We built the Search Query Assistant to convert natural language prompts into Sentry Syntax search terms.
Since its output is non-deterministic, we use evals to build and measure the responses’ performance.
This requires two parts: writing evals for the core user scenarios, and then running them to see how the agent does in producing the correct query.
When the agent consistently produces the query we expected, great! Move on to the next scenario.
When the query is wrong, it’s time to debug what the agent saw, what it did, and how we can steer it towards the correct answer.
Debugging a failing eval
Sometimes, it’s possible to reproduce and debug the eval locally. This works when it doesn’t rely on particular data being present, or when mock tool calls are sufficient to diagnose and fix the issue.
In that case, simple tools are enough to look at the results. This could be looking at JSON outputs from the LLM generation or tool calls.
Sometimes, though, the behavior is more complicated. It’s based on certain data coming back from tool calls, different versions of the LLM model being used or even due to infrastructure errors.
For those cases, using Sentry’s AI Conversation view has been a valuable tool to help debug those situations.
A real query generation bug
While doing some end to end testing, we noticed that queries were returning no results when the field being specified was a custom numerical attribute.
For example, a shopping service could be sending events with a custom attribute for counting how many items are in a cart during purchase. The user might want to see all purchase events where that number is greater than 10. But when they used the search assistant, it returned no events.
Finding the AI Conversation
If we were debugging an error in an API endpoint, we would start by going to Sentry to find the event and look at the captured data.
Even though this is an LLM generated error, we were able to follow the same pattern.
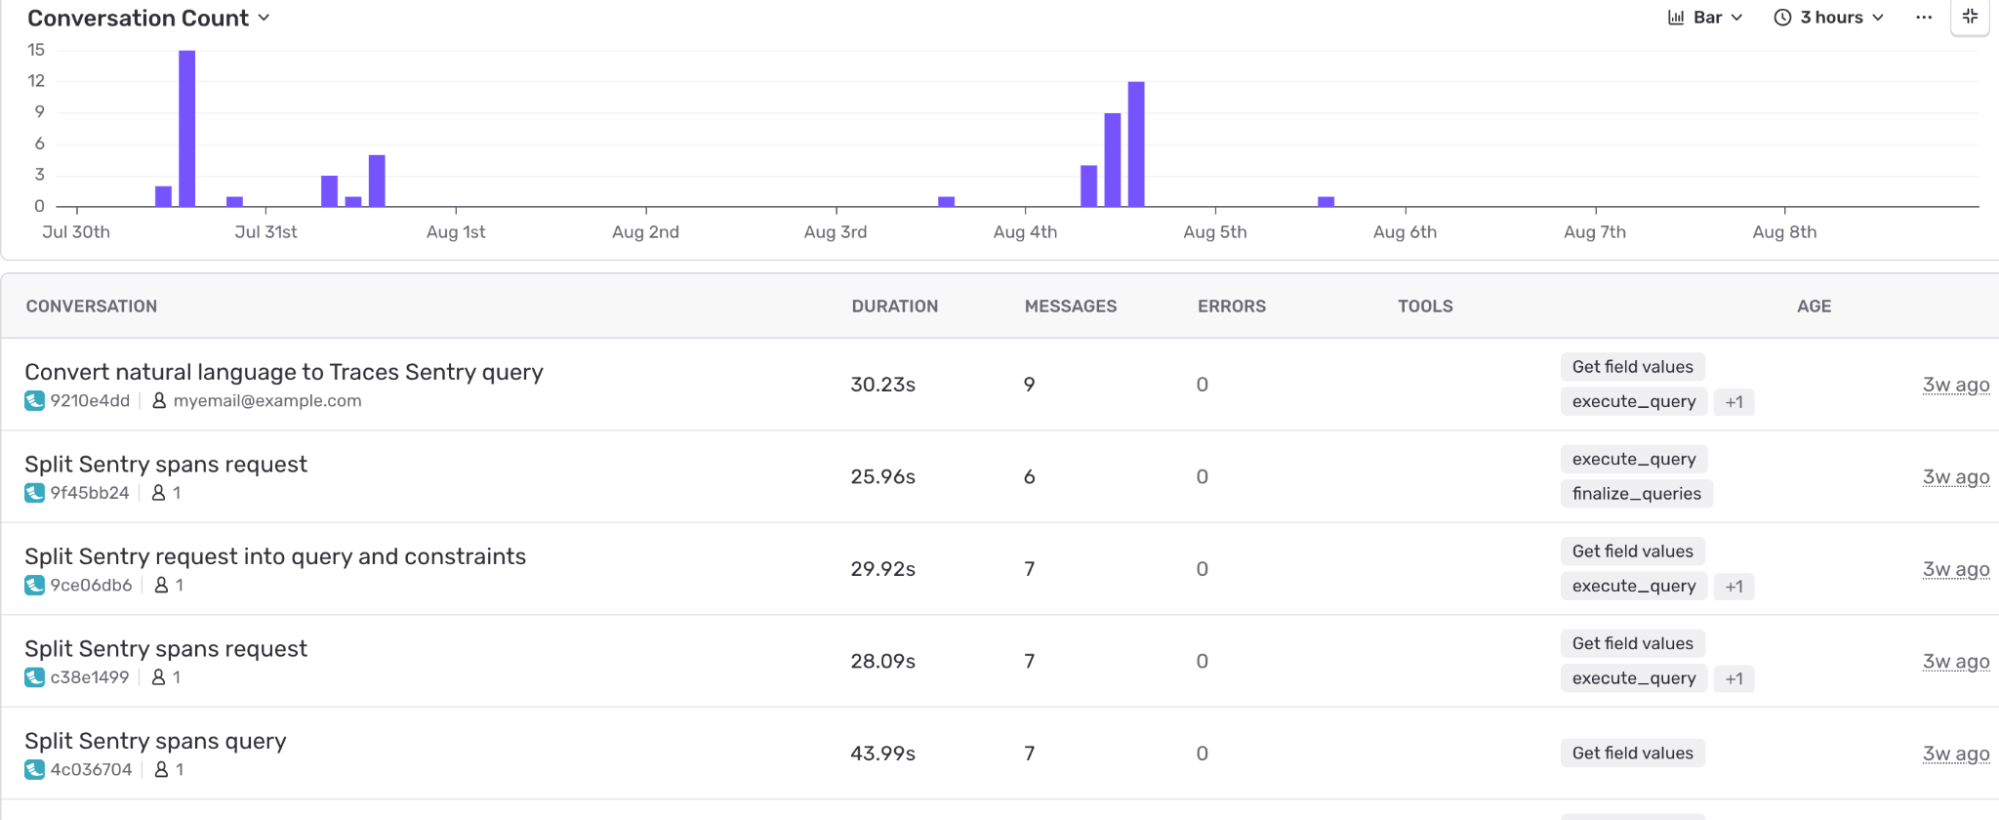
In this case, we navigated to the Agents view and used the filters to find the interaction. Here we could filter on the time range, agent being used (in this case it was for traces) and our own email to find the trace.
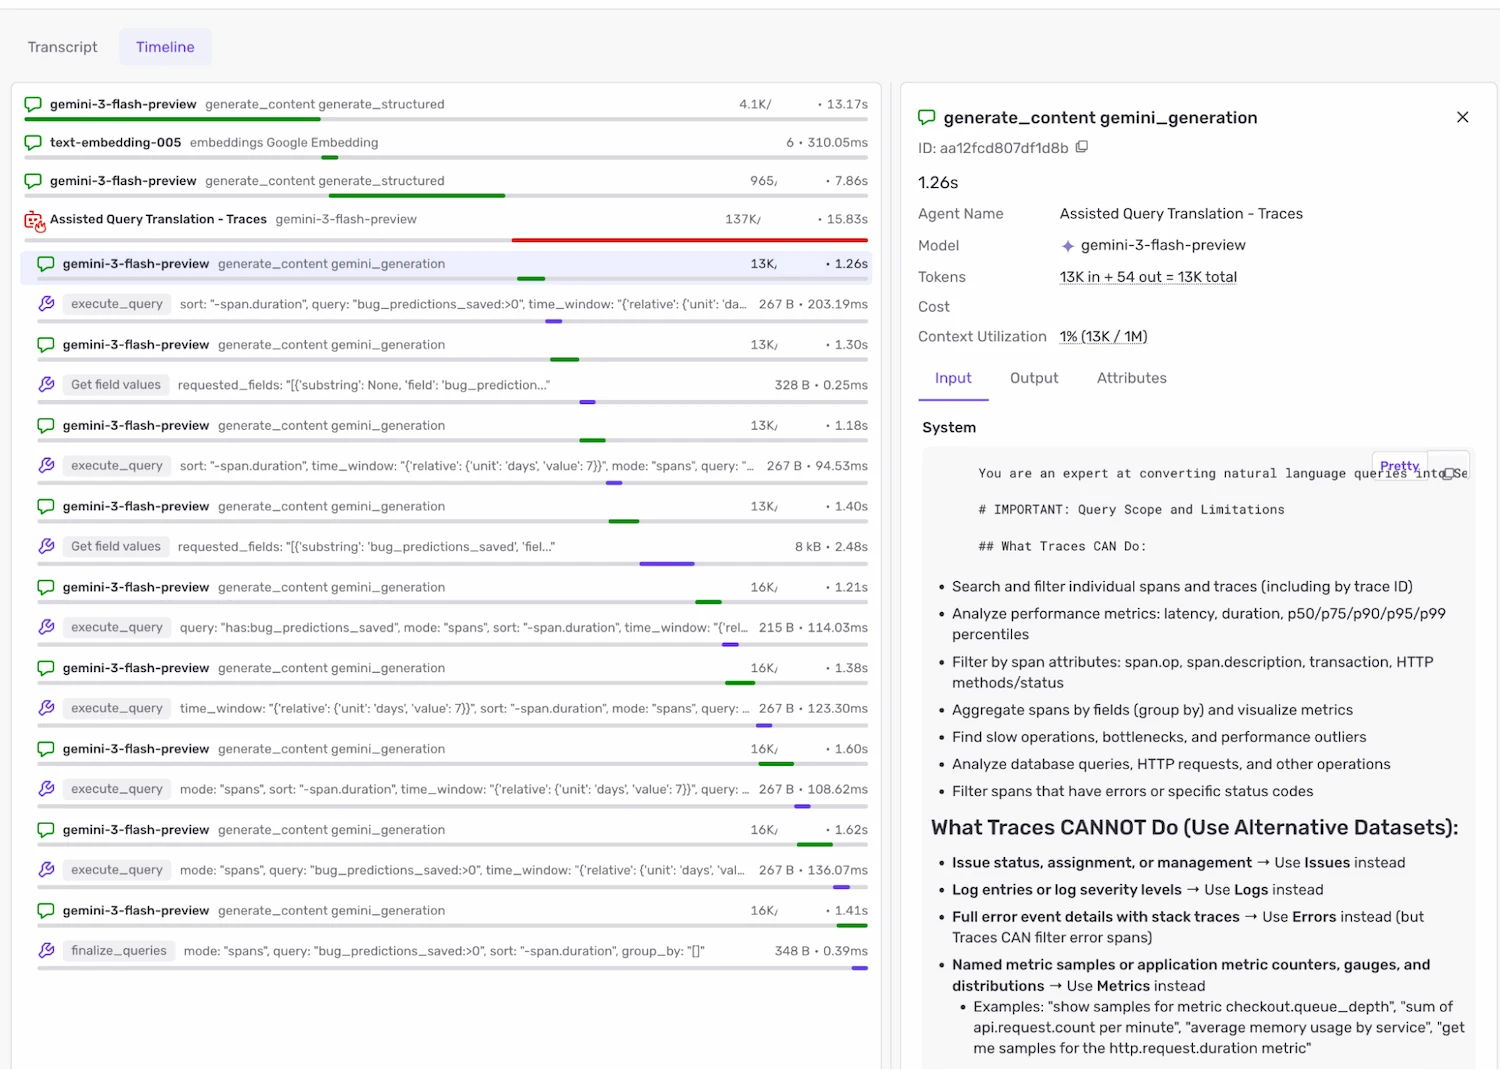
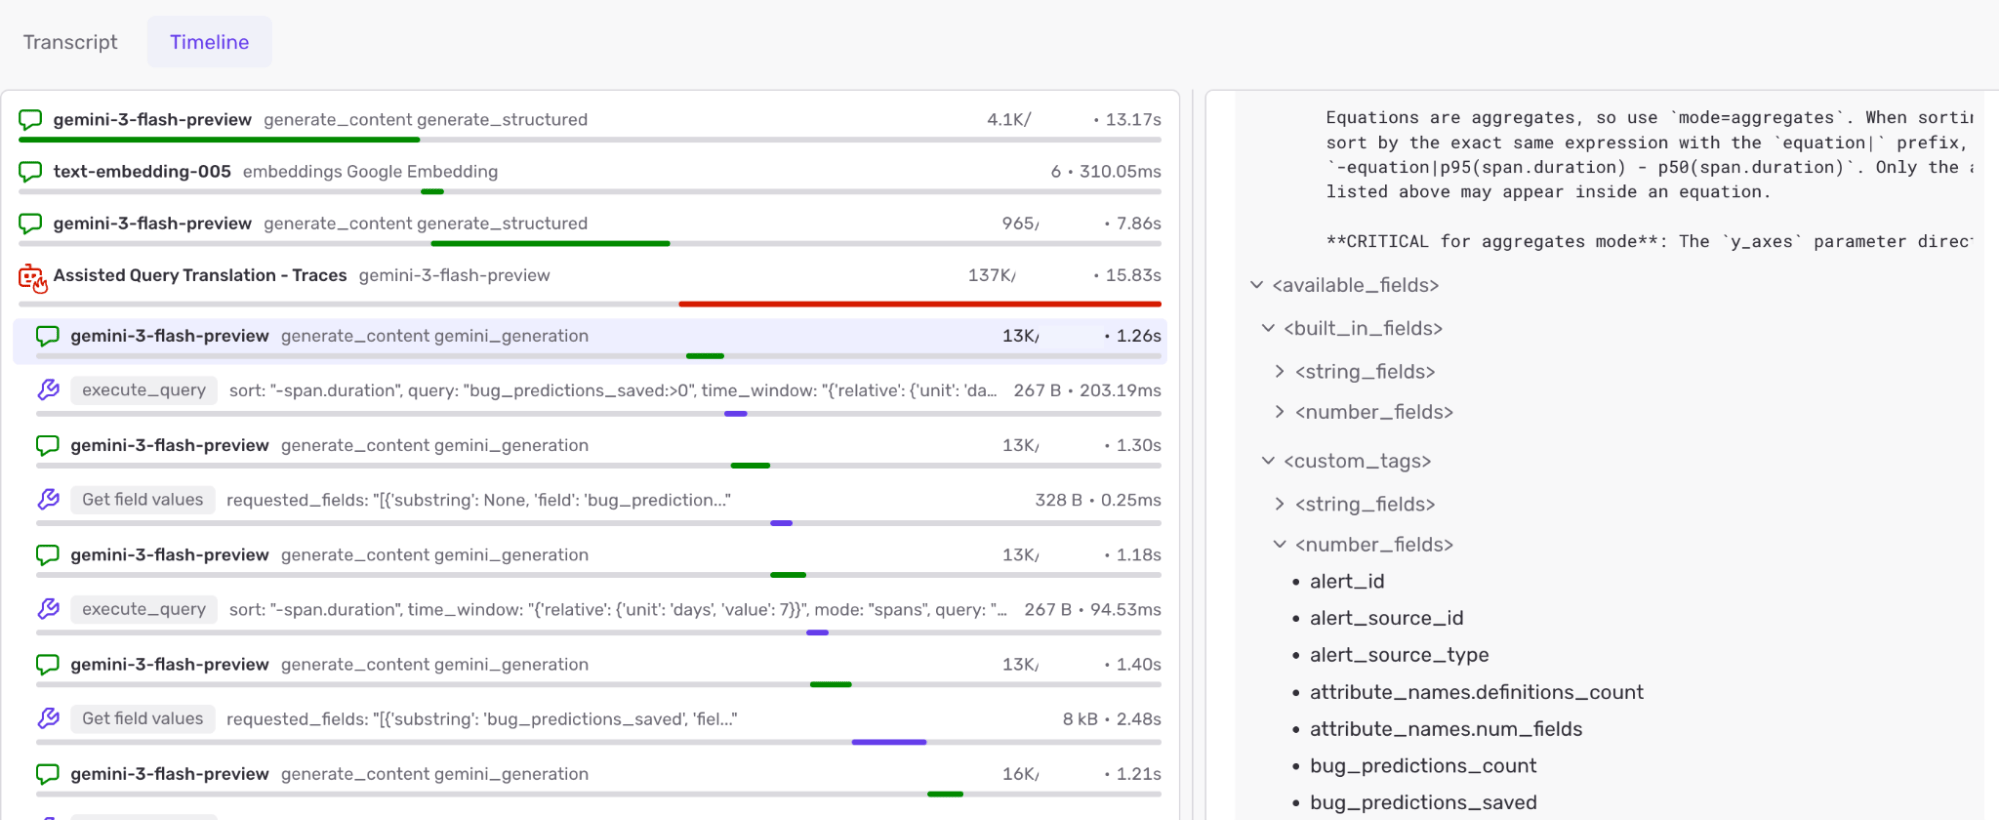
From there, we could look at the timeline of the interaction. Much easier than looking at a JSON blob.
From there, we could see the system prompt, LLM generation and tool calls that were made in order to generate that (incorrect) response.
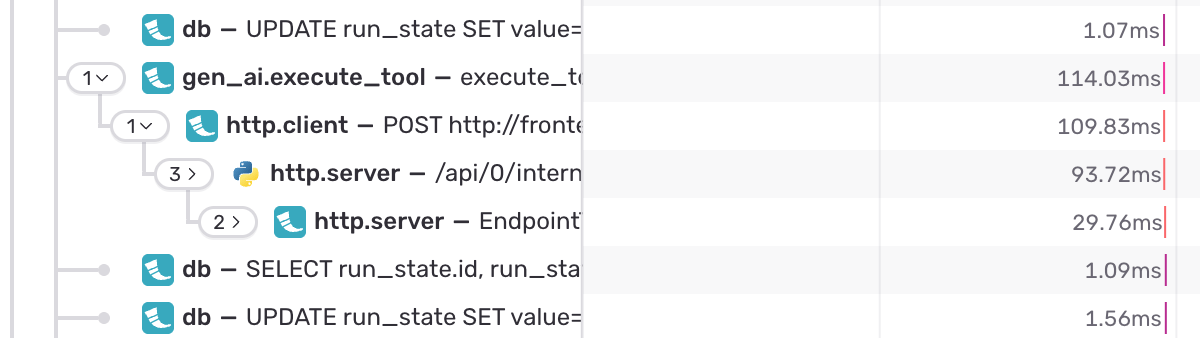
It’s often important to know why a tool call returned particular data. From this view, we can follow the link to the trace, which shows us the backend API call the agent made, the same way we would investigate a non-AI error like a front-end bug.
Looking at the timeline and trace, we found the root cause. It was due to how we were using the results of the tool call (from our own API endpoint) in order to generate the system prompt.
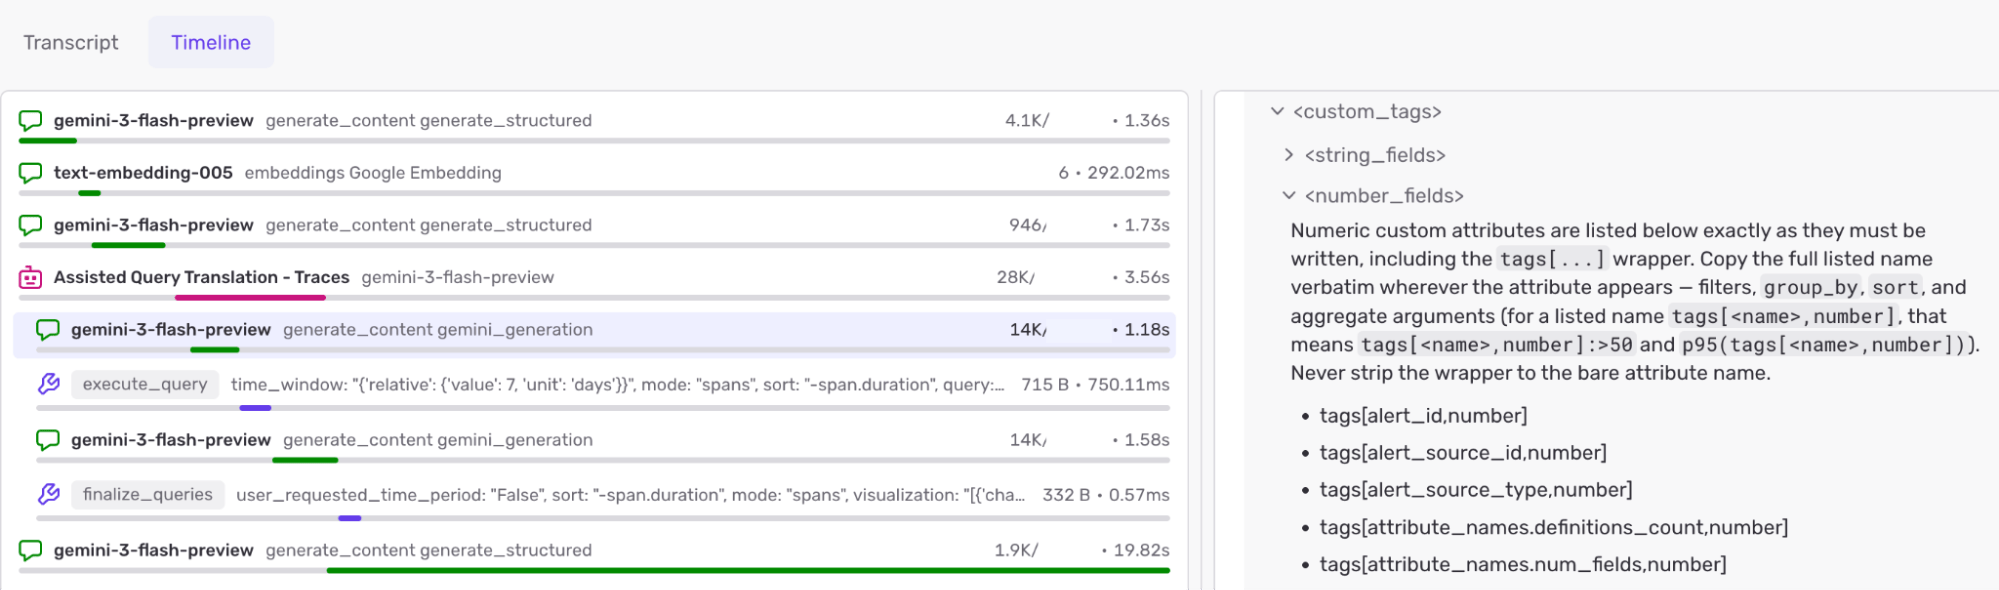
The prompt showed the available fields using the name by itself bug__predictions_count instead of the form tags[bug_predictions_count, number] required in Sentry Search Syntax.
This gave us enough information to make a new eval scenario to reproduce and fix the issue.
Verifying in production
While we could see the local eval passing with our fix, it’s satisfying to see it working in production too.
After it was deployed, we made the same query and saw the correct data being returned.
We could then go back to the AI Conversation view, find the trace, and confirm that the system prompt now had the corrected information in it. We could also see the parameter passed into the API call, returning the correct data.
Now part of local dev too
It’s proven to be so useful that we’ve instrumented our local eval runs to send the data to Sentry too. That means we can iterate on the eval locally and see the results in Sentry before we even need to open a pull request.
Familiar tools reduce friction
By having the AI conversation traces inside Sentry alongside our other event data, we could
leverage familiar tools for finding the relevant conversation trace
avoid having to copy / paste IDs or data between tools
jump directly to the related tool calls the agent made to our own APIs to generate a response
Overall, having these agent traces alongside our other data has made debugging issues like this a lot easier. It’s now the first place we go when digging into a query response that needs improvement.
If you’re building your own AI agents, check out Sentry’s agent tracing docs to see how to get this same visibility into your own traces.
The back/forward cache is one of the most impactful performance features on the web and one of the least observable, because success looks like silence. Here's how we made it measurable.
How we built zero-config Agent Tracing for Laravel AI during Agent Hackweek, from AI-generated defensive code to matching LLM calls with HTTP requests.