3 Ways to Improve JavaScript Applications
3 Ways to Improve JavaScript Applications
In January we brought Release Health to JavaScript. This month we've been thinking about the overall experience for JavaScript developers, some could call it JavaScript Jebruary.
Think back to your last frustrating experience. It was probably caused by slow page loads or getting dizzy from staring at the ever-ending spinner.
One survey showed that the average desktop load time on a webpage was 10.3 seconds and on mobile, it was 27.3 seconds. These load times are just long enough for your customer to swipe to a competitor.
Does it really work, if it’s too slow?
So we introduced performance monitoring. Performance makes it simple to troubleshoot any slowness your customers are experiencing. Our performance offering supports the most widely used JavaScript libraries. Now developers can see which part of the application is causing the bottleneck.
Additionally, we added support for Google Web Vitals to help you understand how your users are actually experiencing your site. We give you real measurements vs the synthetic lab data that others provide. We measure things like First Paint, First Contentful Paint and Largest Contentful Paint, contextualized with variable network speed, browser, device, region, and so forth. We also provide a metric called user misery, which tells you the number of unique users who are frustrated based on the Apdex threshold level.
Release Health - so you can rest easy
Ask a developer what they are most terrified of? They’ll probably say a lot, but PagerDuty rotation is definitely on the list. Why? No one wants to be woken up in the middle of the night so that they can deal with a production issue. Release Health for JavaScript gets ahead of the panic and answers “did anything break?” immediately.
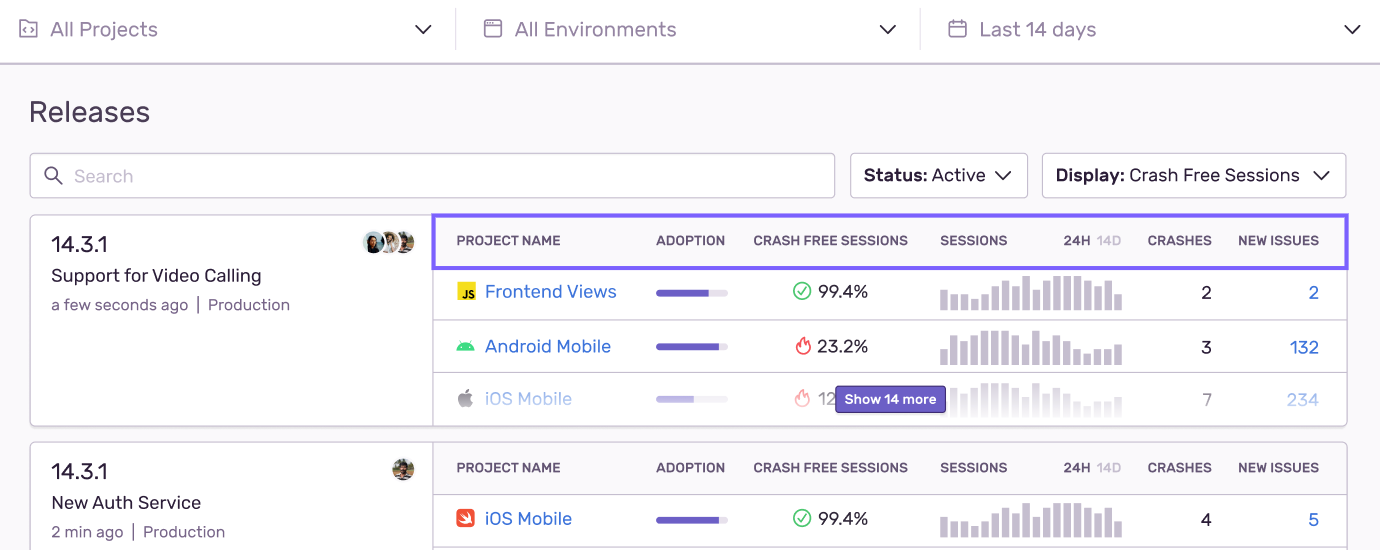
Release Health provides an early warning system to let dev teams know how a release is performing the moment changes are pushed to production. Sentry reports on crash-free sessions, crash-free users, version adoption, and new issues introduced in the release. That way, you can use production data to determine whether to roll back the release immediately or deal with minor issues in the following sprint. Either way, the unexpected won’t jolt you awake and you can rest easy knowing the only thing waiting for you in the morning is 2-day old coffee — you should really make a new pot. While that’s brewing, check out this handy video on getting started with Release Health.
Continuous Improvement with Discover
Finally, how can developers use Sentry to maintain or improve the quality of their code? Our insights tool, Discover lets you easily query across all your projects to track release trends, errors by any category, or even performance event data over time. There are tons of other use cases, but we’ll let you discover those yourself. Curious about how others are using Discover? Read about how our friends at Eventbrite are using it to achieve continuous delivery or watch a recap of our February workshop with guest, Vincent Budrovich, Sr. Software Engineer at Eventbrite. Vincent outlines how his team uses Release Health to support thousands of creators listing digital events on their platform. It’s entertaining. A little WandaVision mixed with a Sentry Release Health workshop sounds like a fantastic evening.
JavaScript isn’t the only language we’re investing in. Learn our best JavaScript debugging practices here.
Try Sentry for free or write to sales@sentry.io to get started.


