New Ways to Uncover Trends with Discover

While powerful, our first iteration of Discover had some user experience complexities that made it less user-friendly than other potential search mechanisms. We also heard from you that our Events feature was useful for identifying individual events, but finding common patterns within those events was extremely difficult — keyword, "was".
I want to share some of the features and the top 5 use cases that you can do with the refreshed Discover:
View a dashboard visualization of your saved queries: instead of seeing saved queries in a list from our original Discover, you can save and visualize searches to see your entire system at at a glance and quickly identify unexpected spikes or problems to drill into.
Roll the total number of events up to one value, regardless of how the data is sliced. Now… I realize that sounds pretty basic, but it’s something that we’ve never been able to do before, as this is the first feature that’s powered by Snuba, our new search infrastructure. Now, you can build exact, customized queries and see accurate data reflected based on your specific query conditions.
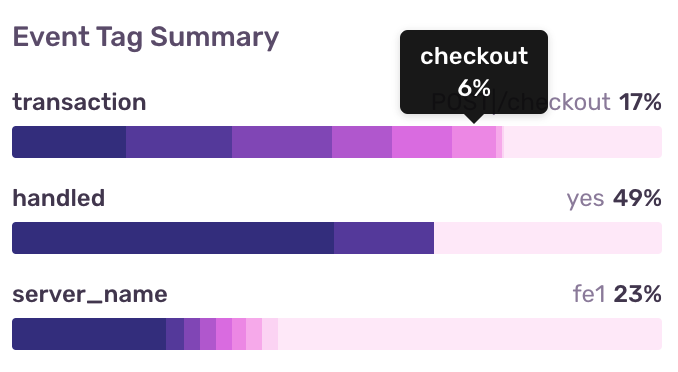
Get a summary of your most frequent tags. This will help you visualize and investigate commonalities and trends for any query you build. We’ve replicated the functionality that was on the Issues detail page and scaled it up to reflect across any combination of errors. You can also interact with the tags to add them as a filter to your query.
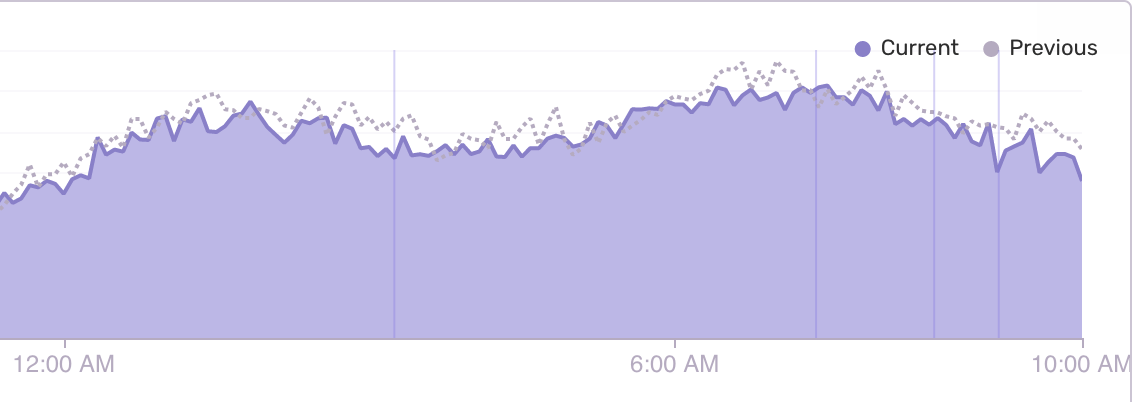
Analyze your data over time and see if your data is relatively improving or getting worse. One of the biggest complaints we hear from users is that they aren’t able to understand trends to see if the investments they’re making are making a material improvement in their application health. Now, you can visualize and get a high-level understanding in one glance.
Drill into data by clicking on aggregates and groups. Along with being able to drill in and zoom in on time slices in the graph, you can now drill into data in the table as well. If there’s a specific group or aggregate that you want to focus on, you can click on the count() in a given row and expand that group to view them in the table.
In the coming months we'll release more updates to Discover that will also help you analyze performance and tracing issues.
Want early access to our latest updates? Get in line.
Discover is available on our Business Plan. Try it for free or write to sales@sentry.io to get started.


