Your App Might Be Down; Let's Fix It – Introducing Sentry Uptime Monitoring
Your App Might Be Down; Let's Fix It – Introducing Sentry Uptime MonitoringEven at Sentry, we're not immune to downtime. In a moment of "oh-the-irony," we once took down our own application with a bad migration. We were adding a field to a critical database table, and the migration locked it completely. Since this table was essential to Sentry’s operation, the entire app went down. The website wouldn’t load, ingestion paused—everything ground to a halt.
We caught it quickly and killed the offending query, but if we'd had uptime monitoring on key pages, we might have spotted the issue even sooner. That’s exactly why we built Uptime Monitoring.
Every second a developer spends scrambling to diagnose an outage is a second users spend refreshing pages, getting frustrated, or leaving. And yet, the usual process—getting alerted in one tool, digging through logs in another, manually piecing together what happened—is slow and painful.
We saw firsthand how fragmented troubleshooting delays a fix. So we built a way to catch outages the moment they happen and get the context to fix them, all in one place. Sentry’s Uptime Monitoring doesn’t just tell you something’s down—it connects you to the root cause, whether it’s bad code, a failing API, or something else entirely.
Sentry’s Uptime Monitoring is now available to all. Every plan includes one free monitor. Create yours to catch downtime before your users do.
Sentry’s Uptime Monitoring
Sentry keeps track of your site’s availability and alerts you when downtime is detected.
We proactively monitor your web services by performing health checks on configured URLs through HTTP requests every 60 seconds. Whether it's a timeout, DNS resolution problem, or a bad response, if an issue is detected, you'll be notified immediately.
Since our beta release at the end of September, nearly 100,000 active uptime alerts have been created. We've also added several highly requested features to make your life easier:
Check History: Wish you had proof that your site was up before everything went sideways? Now you do. Check history lets you review past uptime checks, track performance trends, and connect the dots between downtime and other issues. Check it out here.
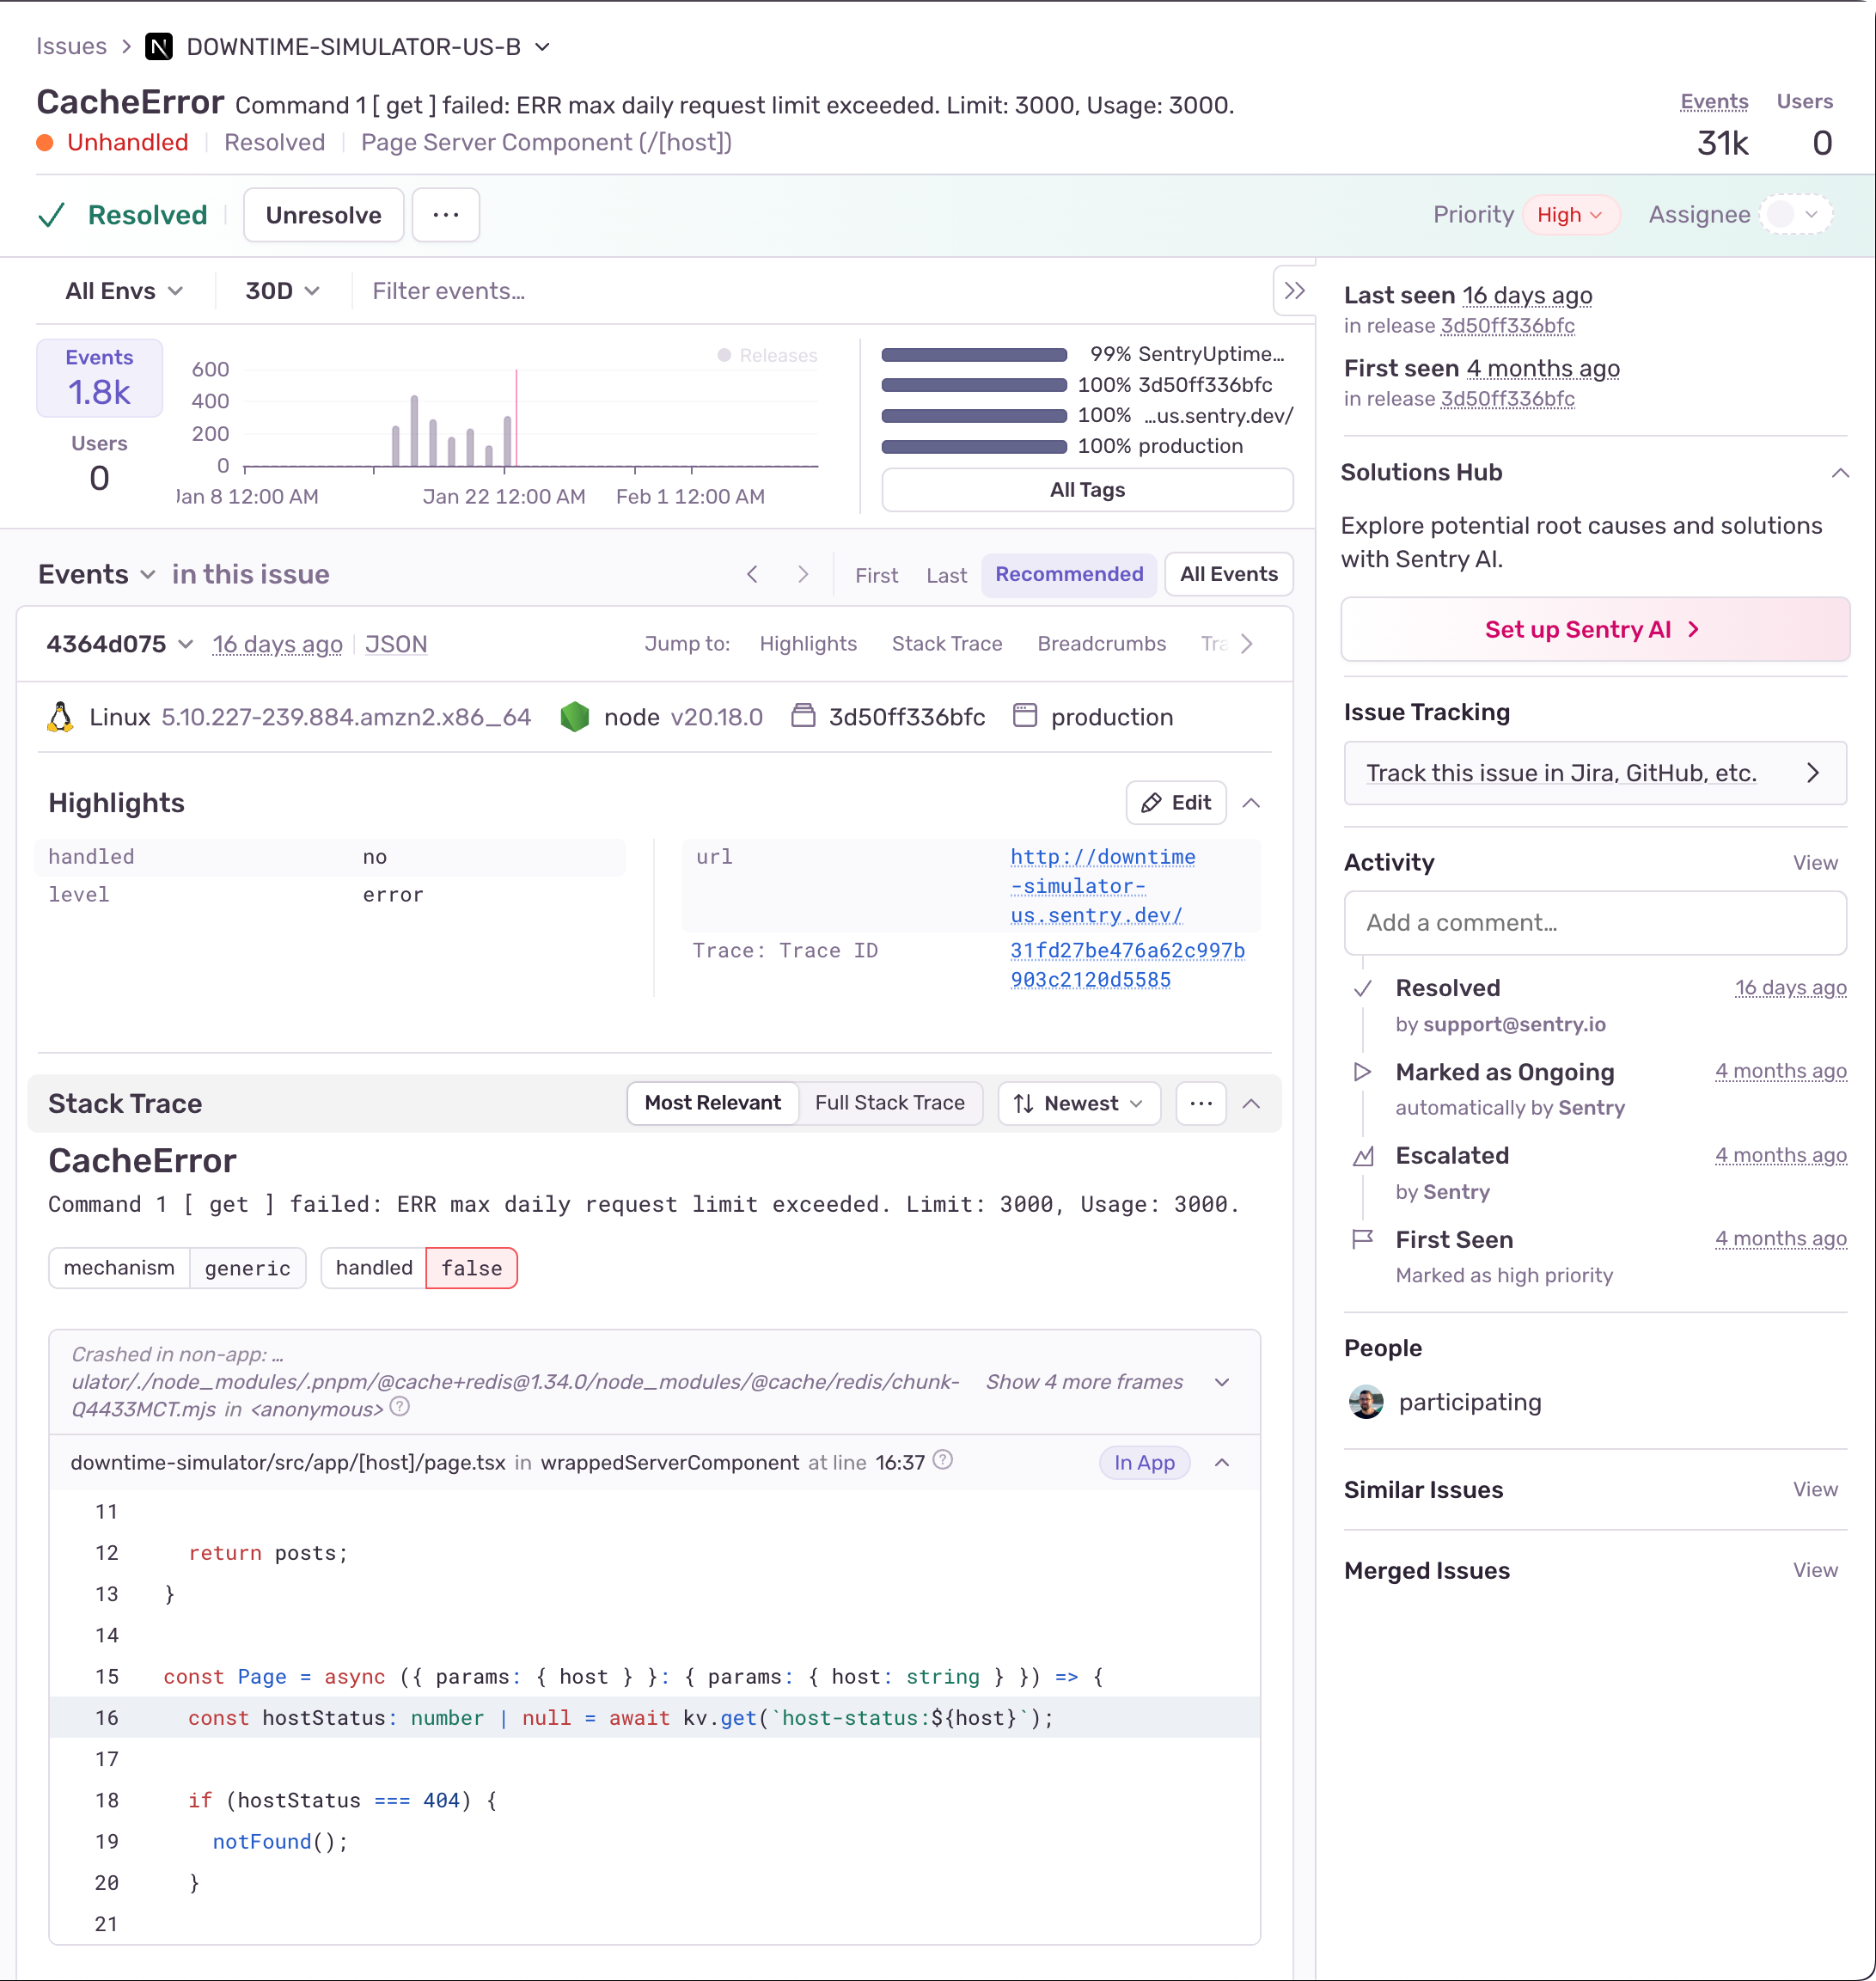
Improved Uptime Issue Details UX: We've overhauled the issue details page to give you more context when investigating incidents. Now, you can access a check history timeline, a quick view of all uptime checks, and a trace view of related requests.
Distributed Tracing Support: When an uptime check fails, you don’t want to play detective. If your backend service is instrumented with a Sentry SDK, we’ll automatically link the request’s trace to the uptime check—so you can jump straight to the relevant issues or spans instead of piecing things together.
Geographically Distributed Checks: Nothing like a false alarm at 3 AM to really make your day. To reduce both missed downtimes and unnecessary alerts, we now run uptime checks from multiple locations. A downtime issue is only created after three consecutive failures across different regions—so when you get a downtime alert, you’ll actually care.
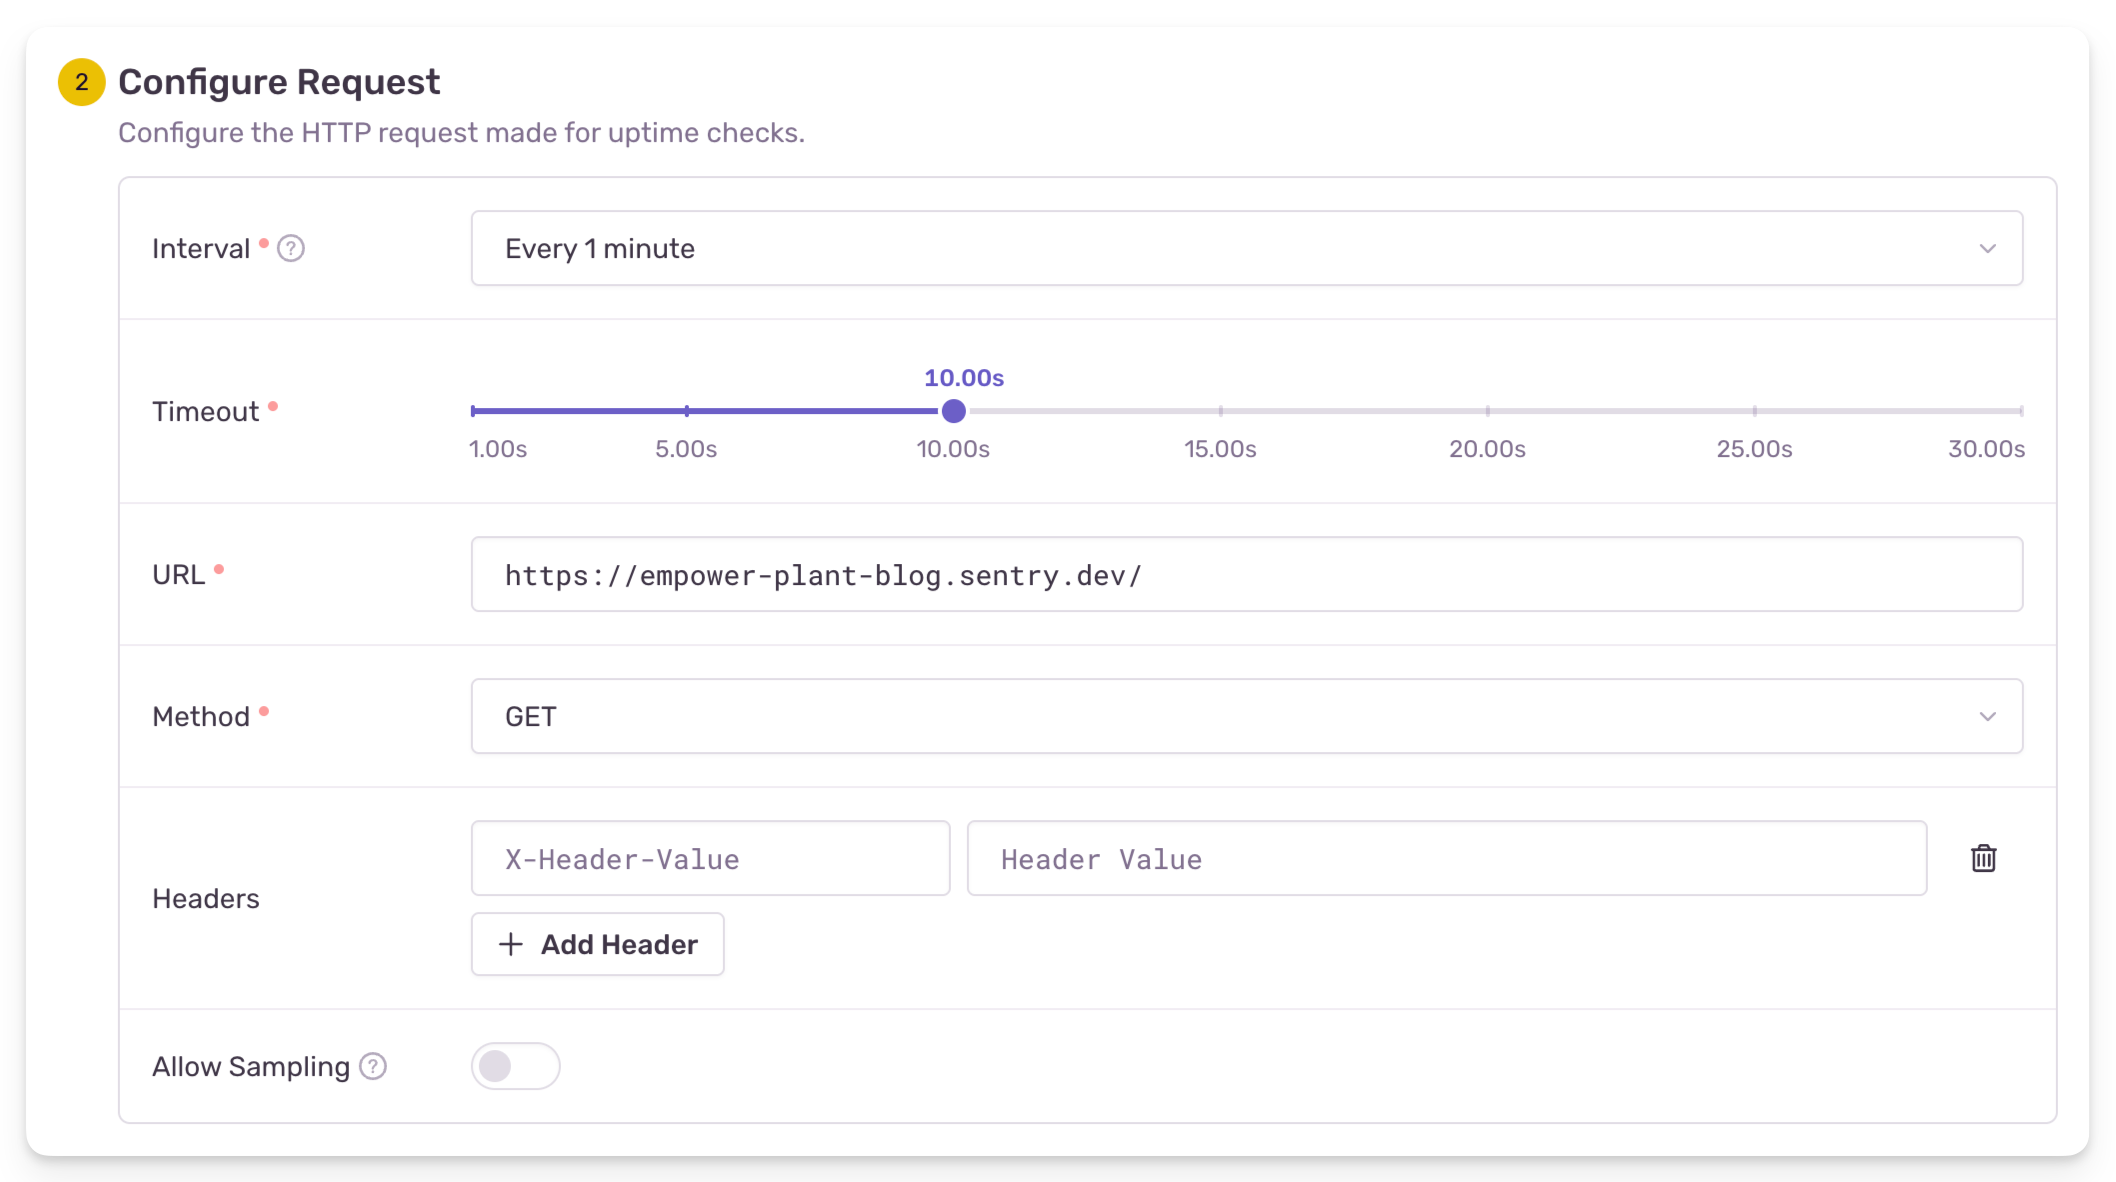
Additional Monitor Settings: Not all services are created equal, and neither are their monitoring needs. You can now customize interval and timeout settings to match what actually makes sense for each part of your stack.
Common downtime causes — and how Uptime Monitoring can help
Pushing Broken Code
We've all done it—pushed a change that seemed harmless, only to bring an entire system dangerously close to failure. For this team it meant narrowly avoiding disaster after a simple type error in an asynchronous job crashed the delivery system for incoming purchases. Instead of just failing that one job, the crash blocked the entire queue, preventing all subsequent jobs from running.
Then there’s the classic JavaScript mistake: updating one page and accidentally breaking the entire site. One developer learned this the hard way—everything looked fine in testing, but a small oversight caused chaos. The code ran on every page, assuming a specific element always existed. Without a null check, any page missing that element instantly broke.
Somehow, this passed PR review and internal testing because, of course, only the updated page was tested. The issue wasn’t caught until late Friday afternoon—just before a major online sale. Cue a frantic scramble to debug, a long night of fixing, and the realization that one missing if statement had just ruined everyone’s weekend.
These things happen, but with uptime monitoring, you can catch them faster—so the fallout is less painful.
Issues with dependencies, like 3rd party APIs
Nothing like building an entire application around an external API, only to have it go down at the worst moment. Or worse—getting rate-limited because you forgot you were still on the free plan. Suddenly, your entire app is frozen because it was relying on something out of your control.
Ironically, this happened to our downtime simulator—a small application we've built to help us simulate downtime. While testing our Uptime Monitoring feature the other day using the simulator, we ran into unexpected 500 errors. By examining the connected issues and context and following the request via the trace view, we discovered that our hosting provider was rate-limiting our Redis usage due to being on the free plan. 🤦♀️
Monitoring external dependencies and understanding how rate limits can impact application performance are a good way to avoid impact.
Infrastructure issues or DDoS attacks
Infrastructure issues or DDoS attacks
Sometimes, it’s not your code or your dependencies—it’s just someone flooding your servers with malicious traffic. Maybe you’re the target of a botnet, or maybe an army of scrapers decided today was the day to hammer your endpoints. Either way, your site has slowed to a crawl, and users are bouncing.
Sentry doesn’t just tell you your site is down—it connects the dots. If you were facing a DDoS attack, Sentry would surface the spike in usage, flag related issues, and provide the context needed to understand what exactly happened.
One of our customers recently shared how they spotted and stopped spammers in under 10 minutes.
After getting tagged in Slack for a spike in errors, an engineer initially suspected an issue with how start_time was handled. But after checking the Sentry JSON, they confirmed the code correctly accounted for None values. Reviewing related events, they noticed multiple session end events for the same user ID—each with a different session ID and no answered questions. All signs pointed to bot activity.
Within nine minutes, Sentry provided the context needed to quickly debug the issue, confirm the botting, and take action before it could impact the system broadly.
Get Started with Uptime Monitoring
Get Started with Uptime Monitoring
Uptime Monitoring is available automatically - no set up required— for the most frequently encountered hostname in your error data, ensuring continuous monitoring of your most critical services.
You can also create custom uptime monitoring alerts for specific URLs, with full control over request details like HTTP method, headers, and body parameters. Check the latest uptime status (“Up” or “Down”) in the "Alert Rules" tab, customize alerts to match expected response codes, and get notified instantly via Slack if downtime is detected.
To create a custom alert:
Go to Alerts and click Create Alert Rule.
Select Uptime Monitor to create an uptime alert.
Configure the alert by specifying the URL and request method for regular uptime checks.
Every plan includes 1 free monitor, and additional monitors are $1 each per month.
Give it a try, and let us know how it goes. You can share your feedback on GitHub or jump into the discussion on Discord.
Not an existing Sentry customer? Sign up free or request a demo to get started.


