Unity Debugging: Tips and Tricks
Unity Debugging: Tips and TricksDebugging in Unity
Debugging is a frequently performed task not just for general software developers but also for game developers. During a debugging process of a game, most issues can be identified by simulating a code walkthrough.
However, reading a codebase line by line and identifying logical errors is cumbersome. Moreover, when it comes to Unity application development, this becomes further complex because most of your code blocks are attached to game objects, and those trigger various game actions. Therefore, you'll have to find a systematic way to debug and carry out fixes faster and easier. Fortunately, Unity has provided many helpful debugging tools that make debugging a piece of cake! Apart from that, you're free to utilize the comprehensive debugging tools offered by Visual Studio.
This article provides an in-depth walkthrough of effectively debugging your Unity applications using in-built tools. Apart from that, we will look at the importance of distributed tracing and how it helps to debug Unity applications effectively.
Using Logs for Debugging
Using log messages for debugging is a fundamental technique for understanding how your functionalities work. You can debug anything and everything that you want. There is for it. In fact, debugging will help identify critical bugs and help solve problems faster.
What kind of data should you log?
Developers can log any information they require. Still, it is good practice to review what you want to log without exposing security vulnerabilities and breaching data privacy standards. Below are some factors you should consider while creating logs in Unity.
Use structured logging: Always try to log an object or a map rather than logging a string. This helps in filtering (with tools such as Elastisearch).
Filter out sensitive data: Do not log a password or anything that might breach user privacy.
Create meaningful messages: Your log message may entail the "What," "When," "Where," "Why," and "Who" aspects. For example, include the non-sensitive log data, a timestamp, the invocation context, and the executor user (user-id).
Using the Debugger in Unity to create log messages
Unity provides a Debug class that exposes a vast set of methods that help provide debug statements in the code. All these statements can be observed in the "Unity Debug Console."
The simplest method offered by Unity is Debug.Log(message:object). The method accepts a variable of type object or is a subclass of "object." It allows you to parse debugging messages and data being processed.
Add the below code block to your DebugScript.cs using Visual Studio editor:
using System.Collections;
using System.Collections.Generic;
using UnityEngine;
public class DebugScript : MonoBehaviour
{
// Start is called before the first frame updatevoid Start()
{
string debugMessage = "This is a sample debugging message";
Debug.Log(debugMessage); // this will print the message in the debugging console.
}
// Update is called once per frame
void Update()
{
}
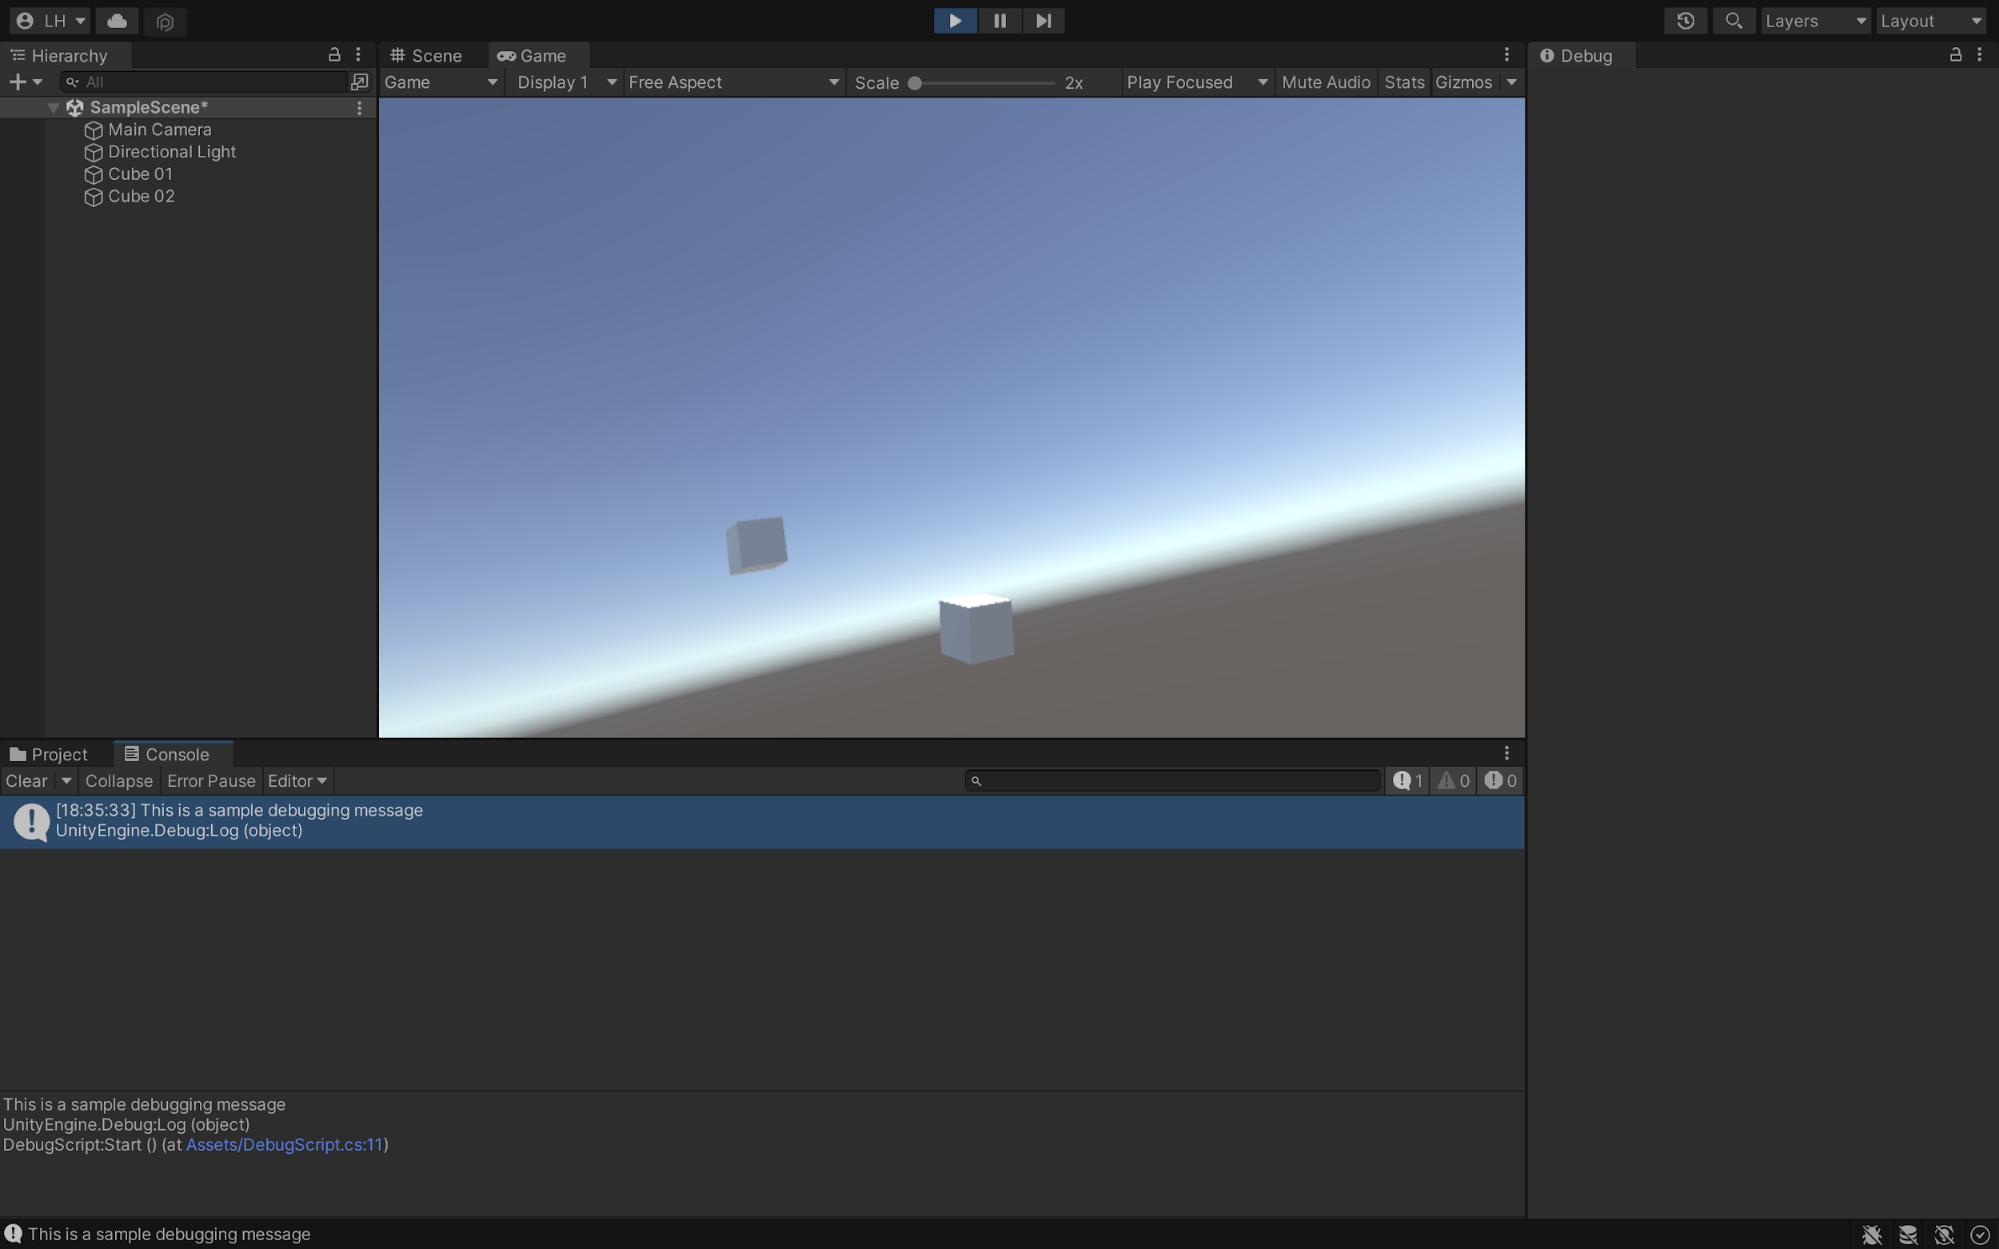
}Afterward, attach the script to a GameObject (I have attached it to the Main Camera). Later, run the game and observe the console. You will see the message as shown below.
Adding Logs with Severity Levels
Unity allows developers to add debug logs based on the priority. For example, you could log an error log or warning log by using methods such as Debug.LogWarning() or Debug.LogError().
Ultimately, this allows developers to add logs with different severity levels so that when they inspect the logs later on in the future, they can easily identify the important logs based on the severity used.
A sample image of the logs with different severity types is shown below:
Logging with Contexts
One issue in debugging games is that it's hard to determine the GameObject that made the call in the editor. However, the Debug.Log() accepts a second optional parameter that accepts a context.
Now, if this context is a GameObject or a Component object, Unity will momentarily highlight the object in the window when you click the log message in the console. This is extremely helpful if you have many instances of one GameObject in a Scene as it can help identify which instance called the method and print the message.
The snippet shown below highlights how you can use the context snippet for efficient debugging.
using System.Collections;
using System.Collections.Generic;
using UnityEngine;

// Create three cubes. Place them around the world origin.
// If a cube is clicked use Debug.Log to announce it. Use
// Debug.Log with two arguments. Argument two allows the
// cube to be automatically selected in the hierarchy when
// the console message is clicked.
public class Example : MonoBehaviour
{
    private GameObject[] cubes;

    void Awake()
    {
        // Create three cubes and place them close to the world space center.
        cubes = new GameObject[3];
        float f = 25.0f;
        float p = -2.0f;
        float[] z = new float[] {0.5f, 0.0f, 0.5f};

        for (int i = 0; i < 3; i++)
        {
            // Position and rotate each cube.
            cubes[i] = GameObject.CreatePrimitive(PrimitiveType.Cube);
            cubes[i].name = "Cube" + (i + 1).ToString();
            cubes[i].transform.Rotate(0.0f, f, 0.0f);
            cubes[i].transform.position = new Vector3(p, 0.0f, z[i]);
            f -= 25.0f;
            p = p + 2.0f;
        }

        // Position and rotate the camera to view all three cubes.Camera.main.transform.position = new Vector3(3.0f, 1.5f, 3.0f);
        Camera.main.transform.localEulerAngles = new Vector3(25.0f, -140.0f, 0.0f);
    }

    void Update()
    {
        // Process a mouse button click.if (Input.GetMouseButtonDown(0))
        {
            var ray = Camera.main.ScreenPointToRay(Input.mousePosition);
            RaycastHit hit;

            if (Physics.Raycast(ray, out hit))
            {
                // Visit each cube and determine if it has been clicked.for (int i = 0; i < 3; i++)
                {
                    if (hit.collider.gameObject == cubes[i])
                    {
                        // This cube was clicked.
                        Debug.Log("Hit " + cubes[i].name, cubes[i]);
                    }
                }
            }
        }
    }
}

The use of `Debug.Log()` does help find errors quickly. However, developers capture these logs as breadcrumbs (message + error metadata) using third-party error monitoring tools such as [Sentry](https://sentry.io) that can present these logs in a more readable manner that can further enhance debugging capabilities.

## Using Breakpoints for Debugging

### Creating Programmatic Break Points

Debugging applications in Unity is not just about logging messages. It's about understanding the behaviour of the code, along with the data that flows through it.

The `Debug` class offers a method: `Debug.Break()` that helps developers to programmatically pause a game. This is useful if the user cannot manually stop the game. Users can place the method `Debug.Break()` at any place in the C# script, and once it gets paused, developers can examine the variables and find bugs at certain areas of the game quicker.

```postgres
using System.Collections;
using System.Collections.Generic;
using UnityEngine;

public class DebugScript : MonoBehaviour
{

    void Start()
    {
       // pause the code.
        Debug.Break();
        string debugMessage = "This is a sample debugging message";

        Debug.Log(debugMessage);
    }

    // Update is called once per frame
    void Update()
    {

    }
}
Debugging in an IDE
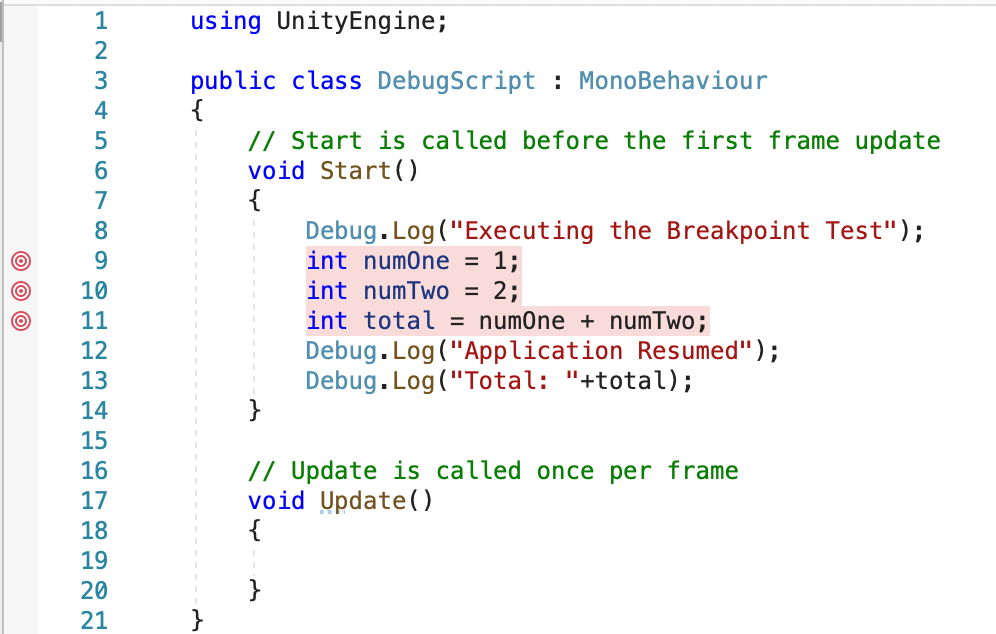
To create breakpoints in Unity, navigate to the script in Visual Studio and place breakpoints the way you'd normally on a code line.
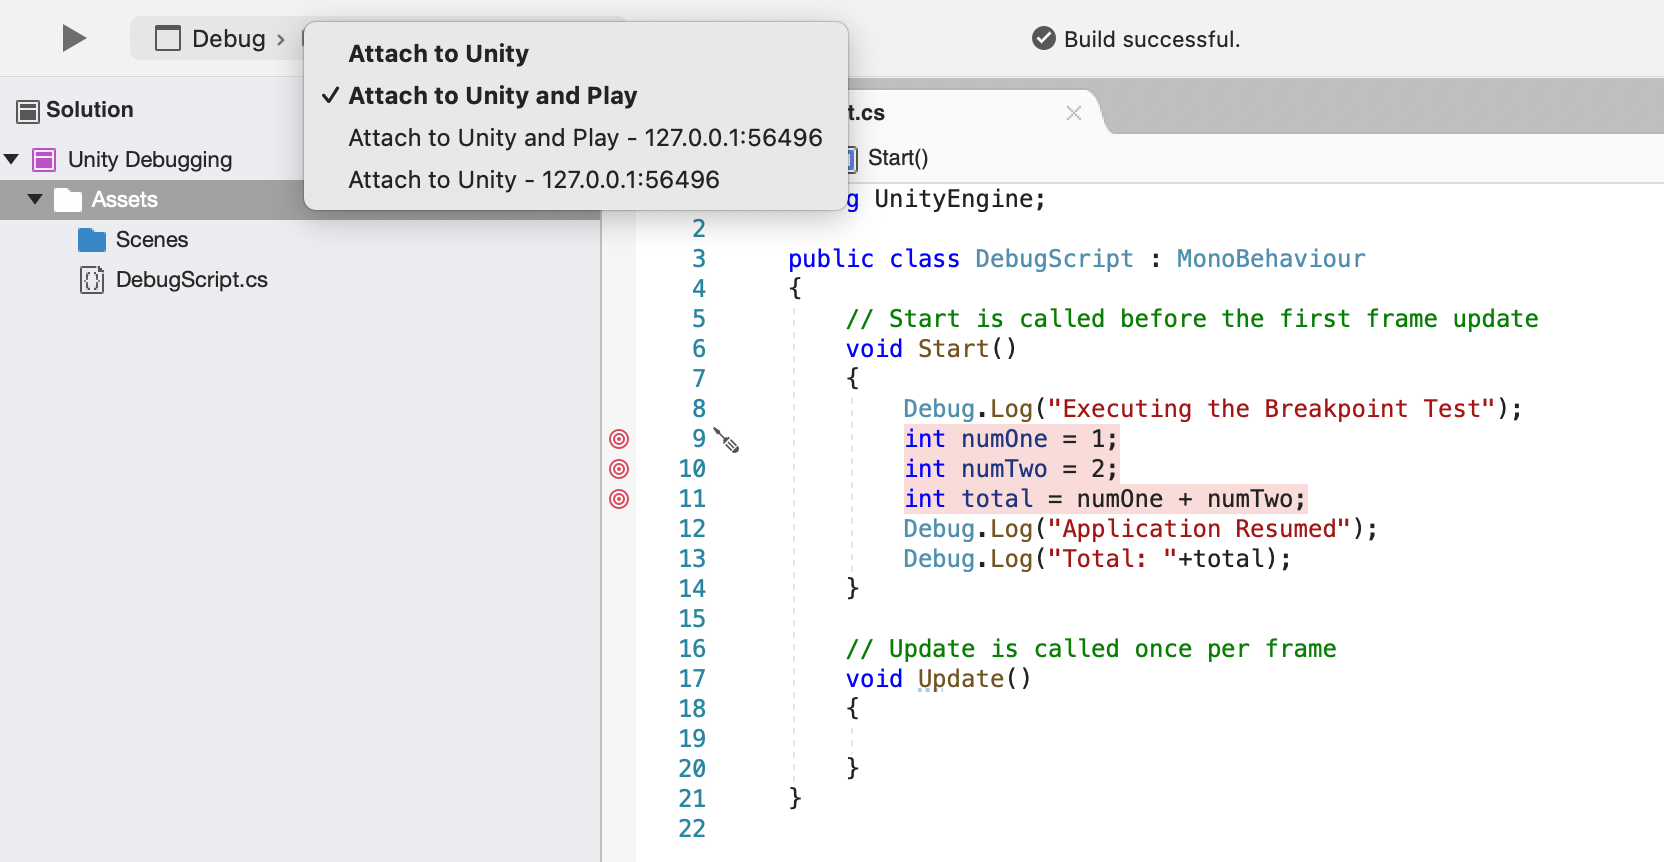
Afterward, you will need to attach the Visual Studio debugger to Unity. To do so, select the "Attach to Unity and Play" debugging option available in Visual Studio, as shown below.
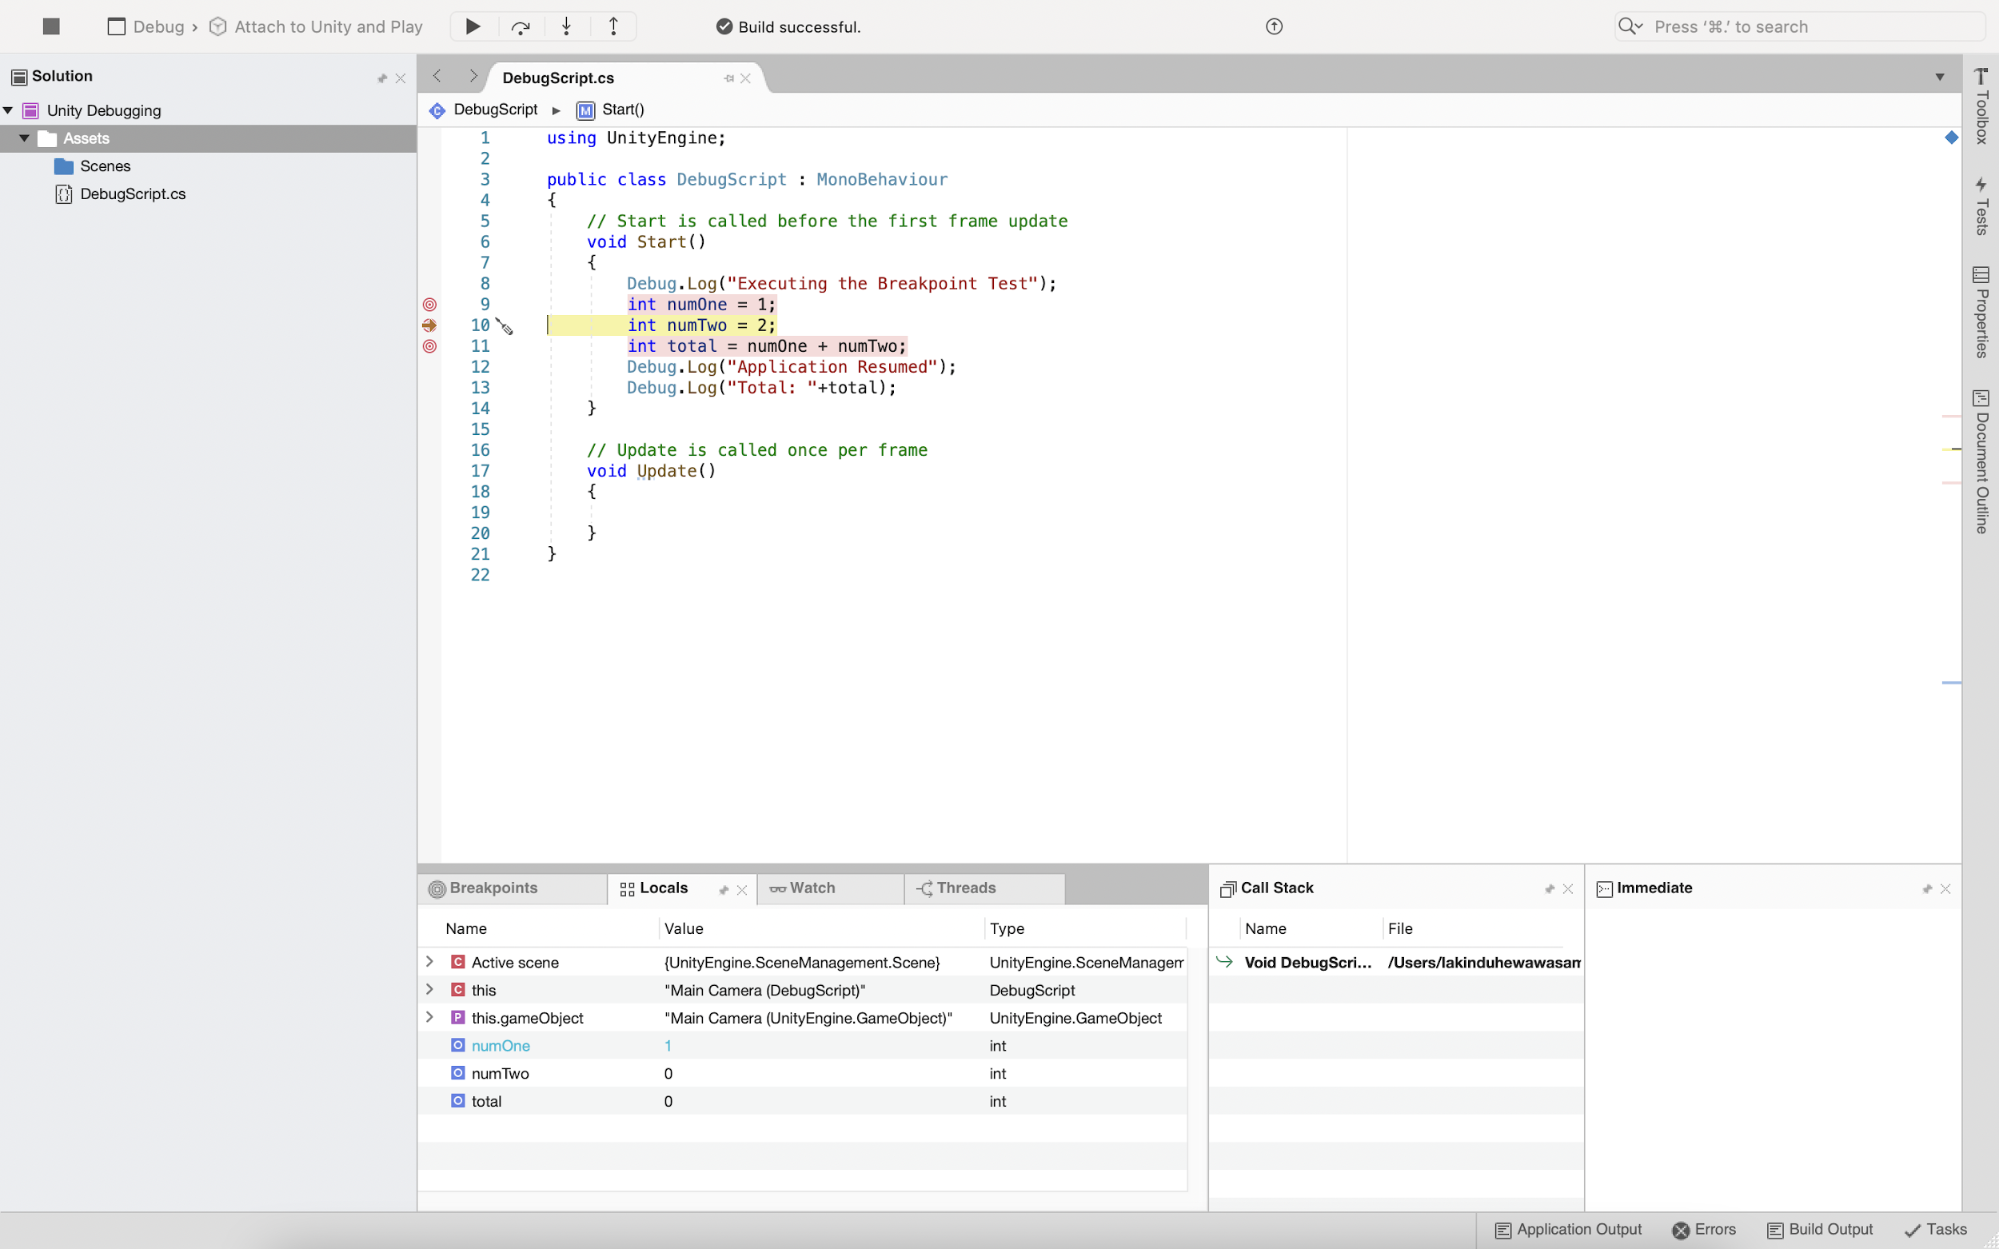
Next, click on the "Play" icon on Visual Studio. It will automatically start the game with debugger options on Visual Studio, and the breakpoints we set will get hit and pause the execution.
You can proceed to the next breakpoint or skip breakpoints as usual.
Distributed Tracing and Alerts
A log may not provide you with all the necessary information in these cases. Instead, you will require a holistic view of your game, which successfully maps the event flow from the client to your backend. In technical terms, you'd need to track application requests that flow from the client to the backend and the database. This is known as "Distributed Tracing."
Distributed Tracing helps developers actively debug an application and identify the exact cause of the error, along with the precise location that triggers the error, while providing an event flow of the data that gets passed through each service.
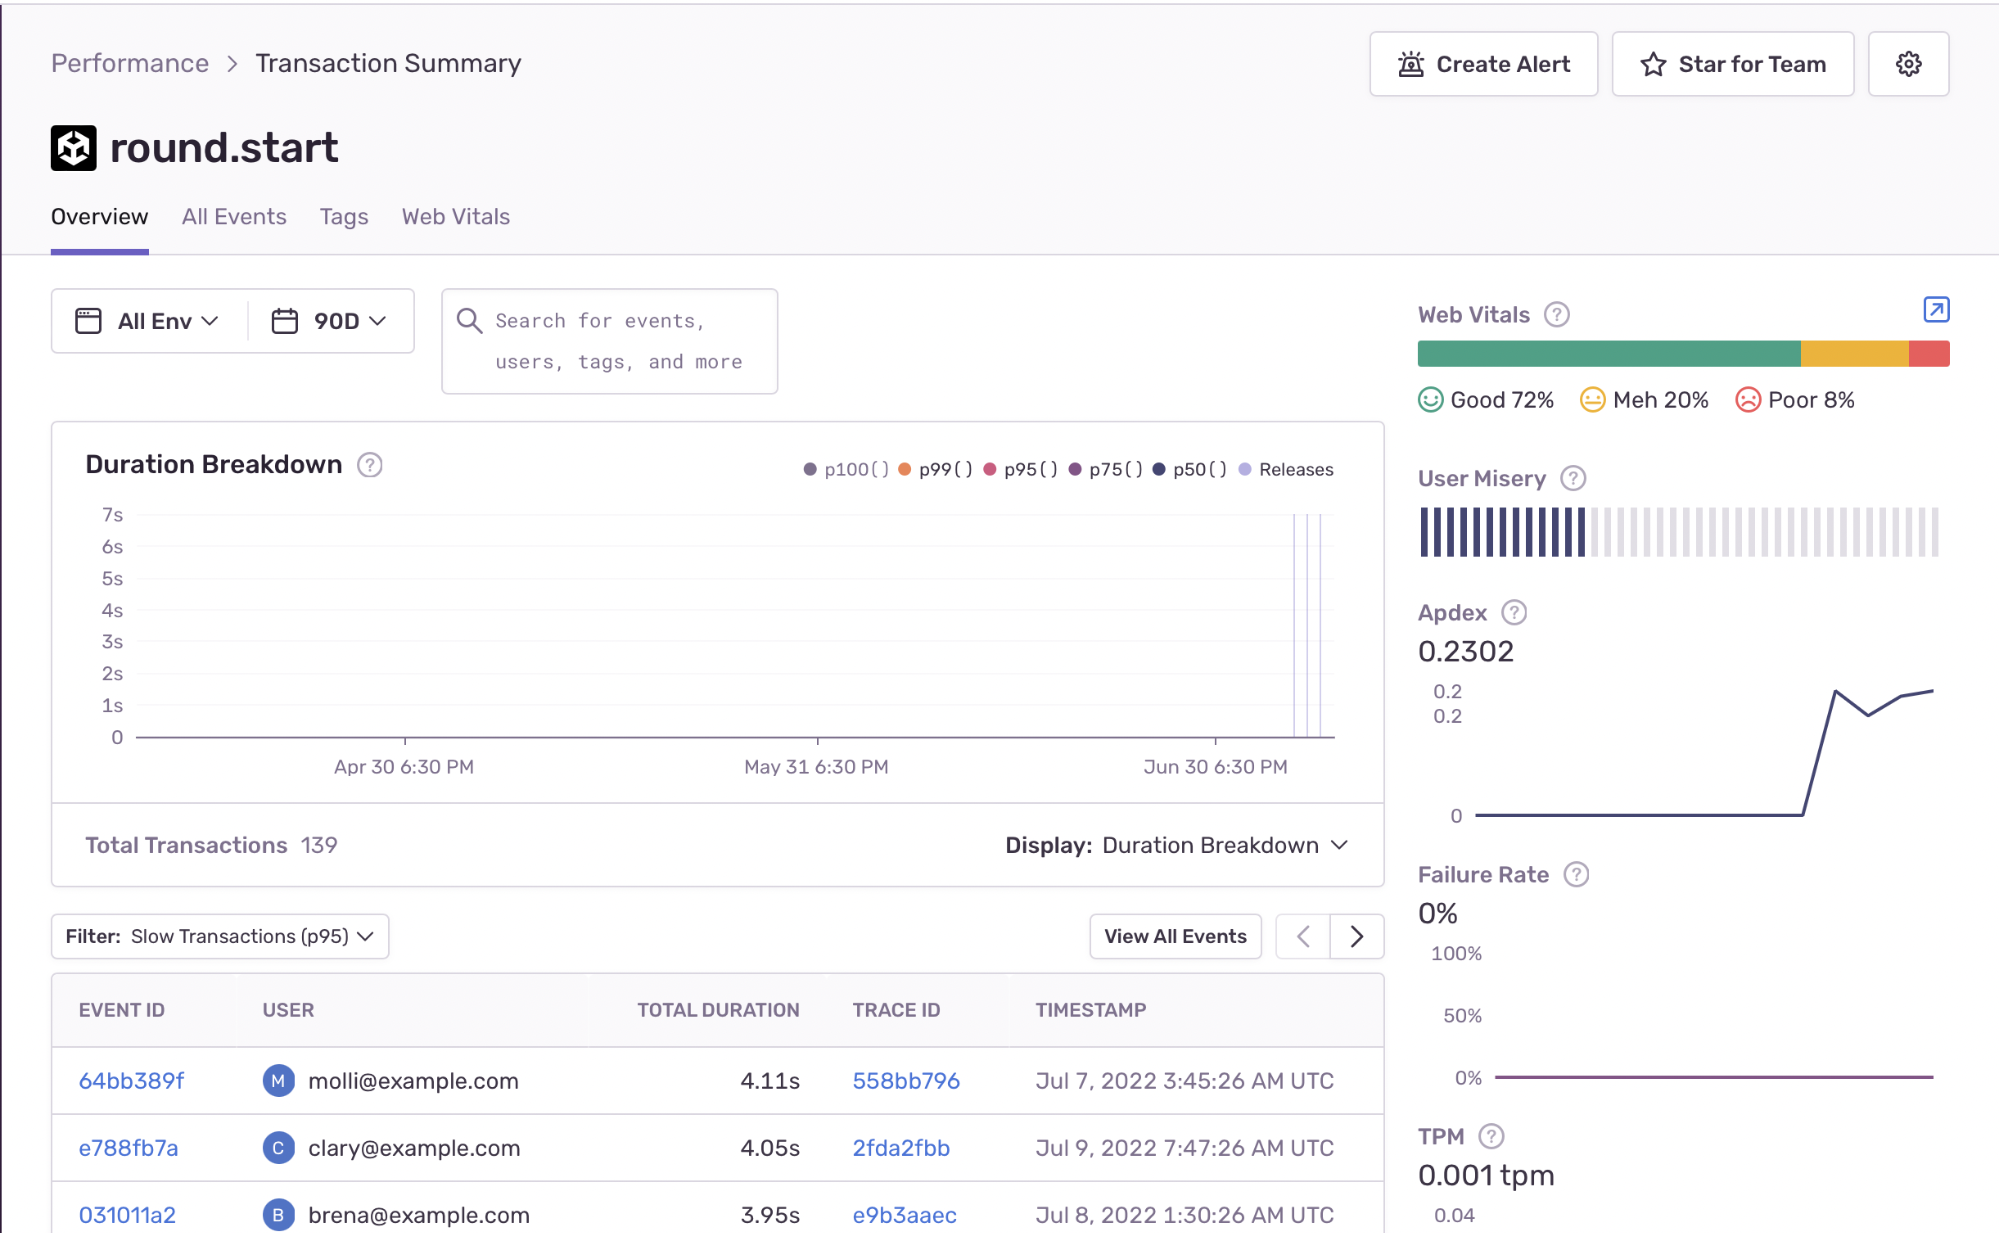
Sentry is a platform that allows users to trace Unity applications and enhance monitoring and debugging capabilities. In addition, Sentry provides performance monitoring that automatically tracks the game's performance. Apart from that, it supports automatic error capturing. It ensures that users can have a single dashboard to enforce their games' observability effectively.
To get started, you'll have to create an account and configure a project on Sentry. Afterward, install the Sentry SDK for your Unity application via the Unity Package Manager using the git URL below.
https://github.com/getsentry/unity.git#0.20.1Finally, refer to the Unity guides on Sentry to enable the required services for your Unity Application.
Afterward, you'll be able to see Sentry tracing your application, as shown below.
This will help developers identify the percentile latency, and more.
Apart from tracing, Sentry allows users to configure alerts for errors occurring in a Sentry project, thus, ensuring that you're kept informed on your application health at all times.
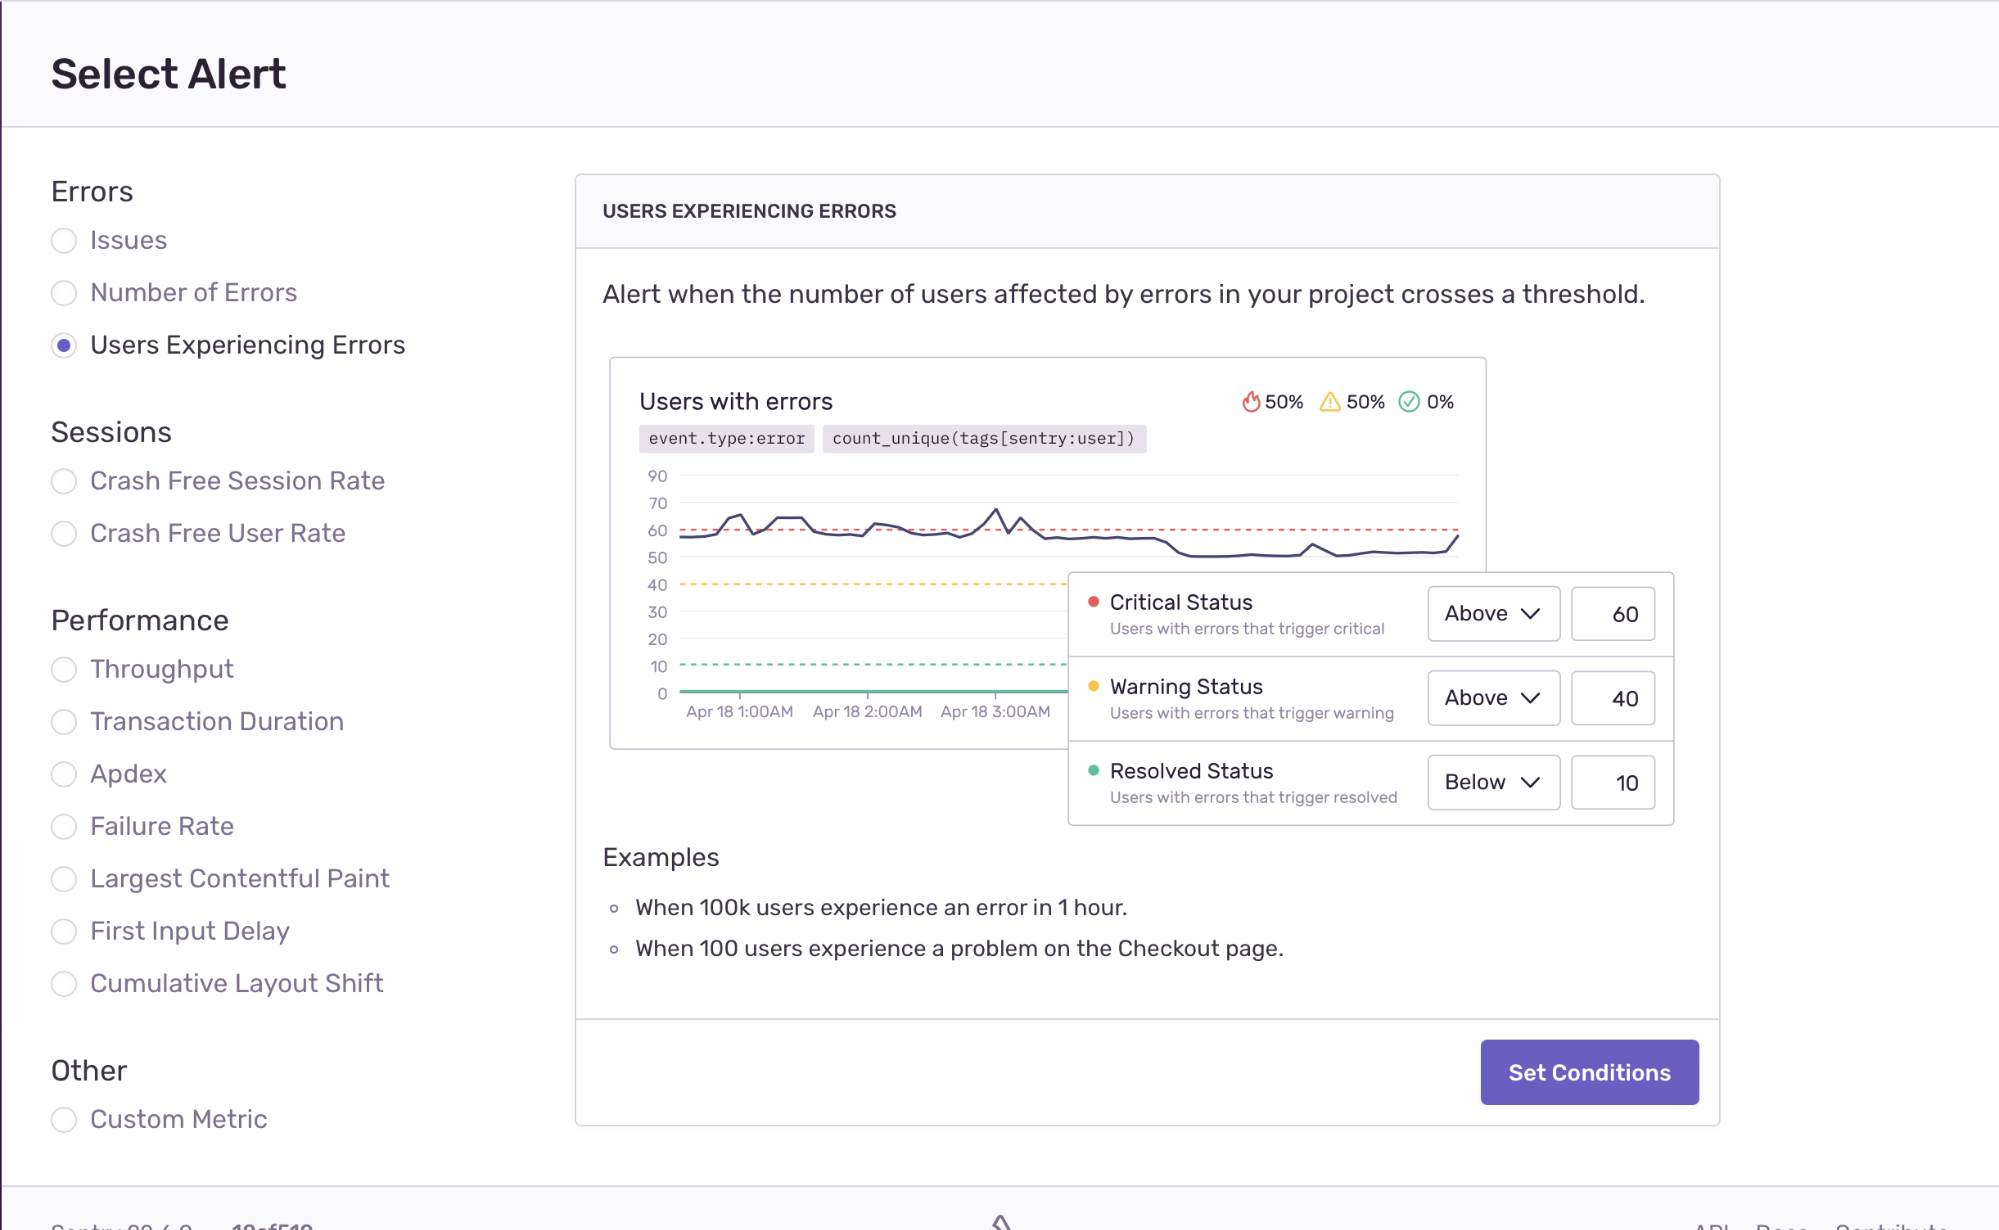
To create an alert, navigate to a project and click "Create Alert." You will see the figure shown below.
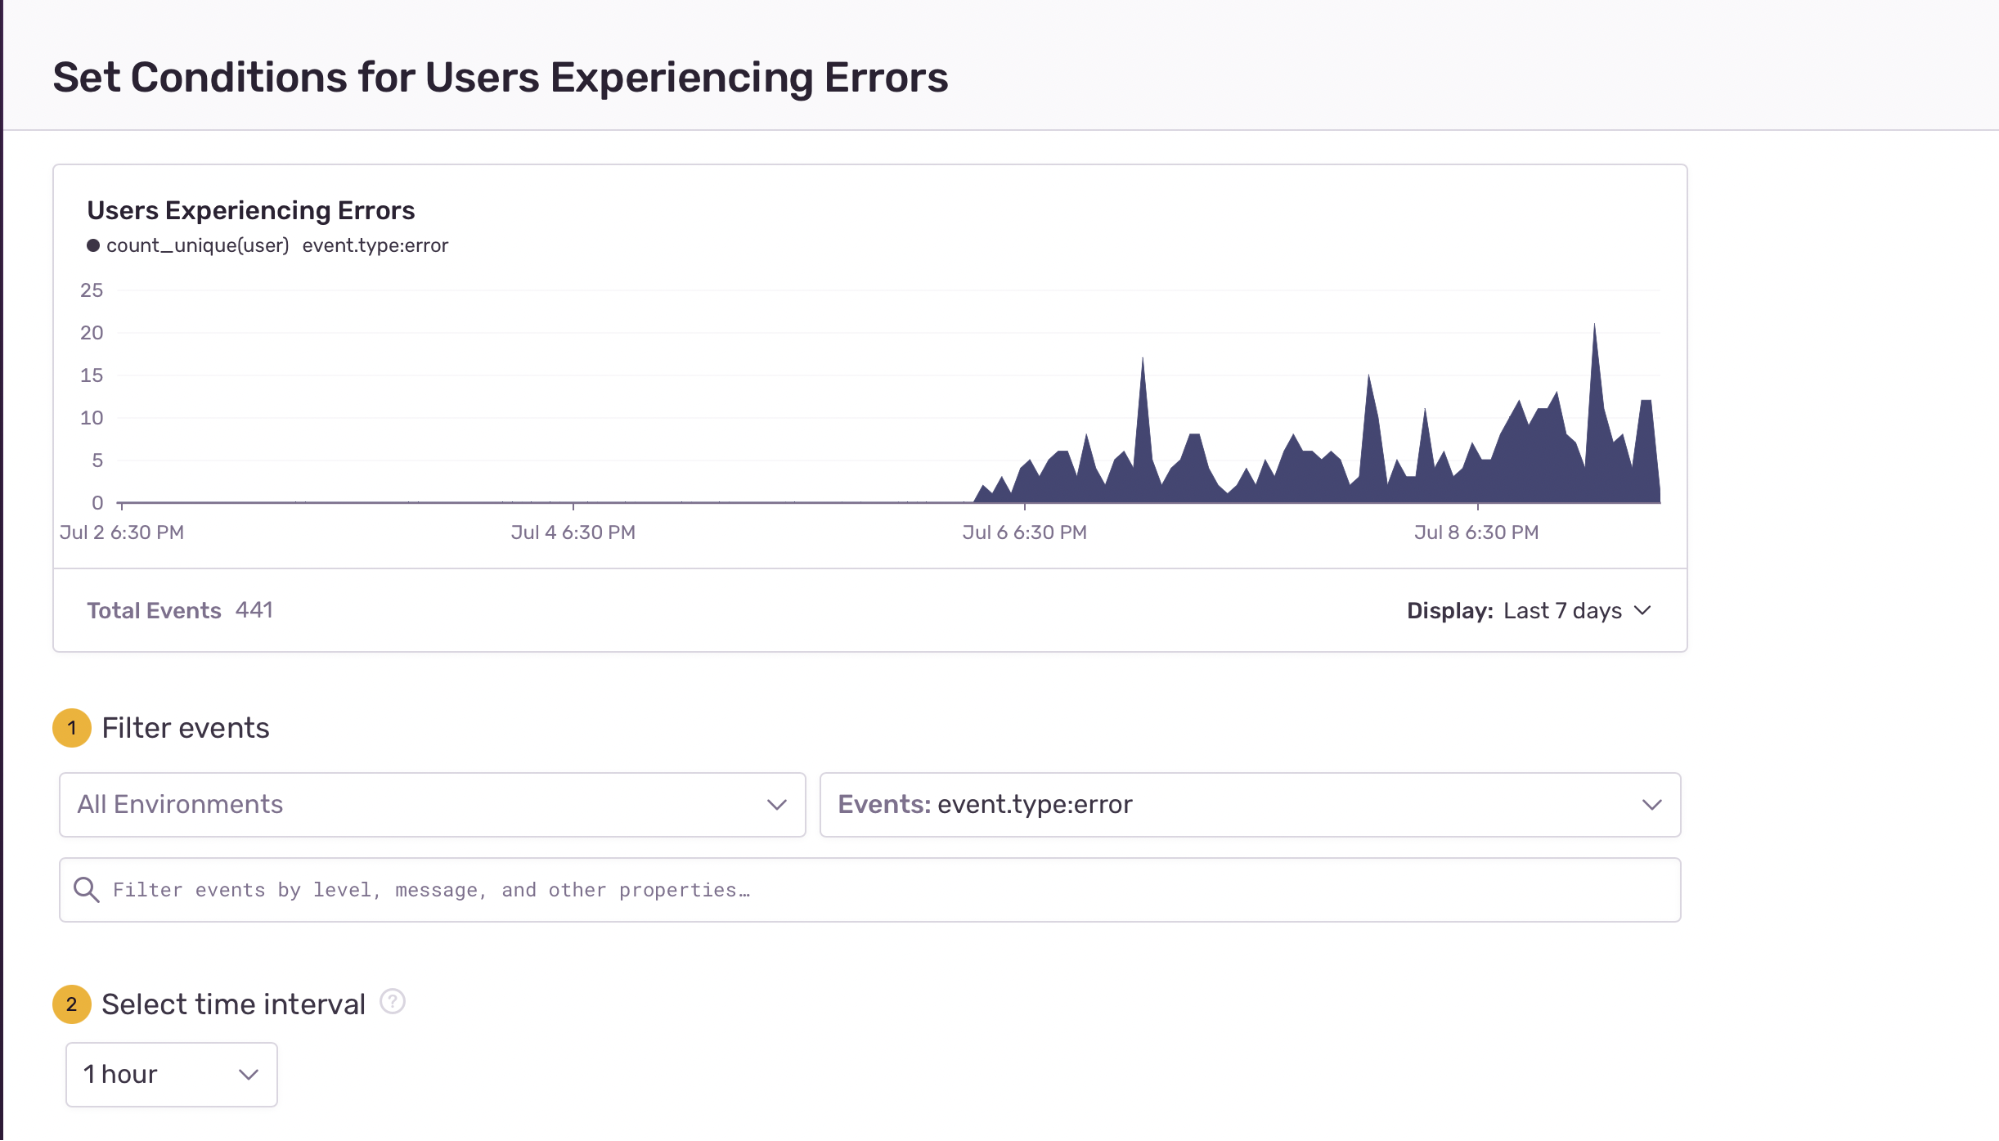
Afterward, provide the error type. You can proceed with "Issues," "Number of Error," or "Users Experiencing Errors" based on the requirement. After specifying the error, click "Set Conditions."
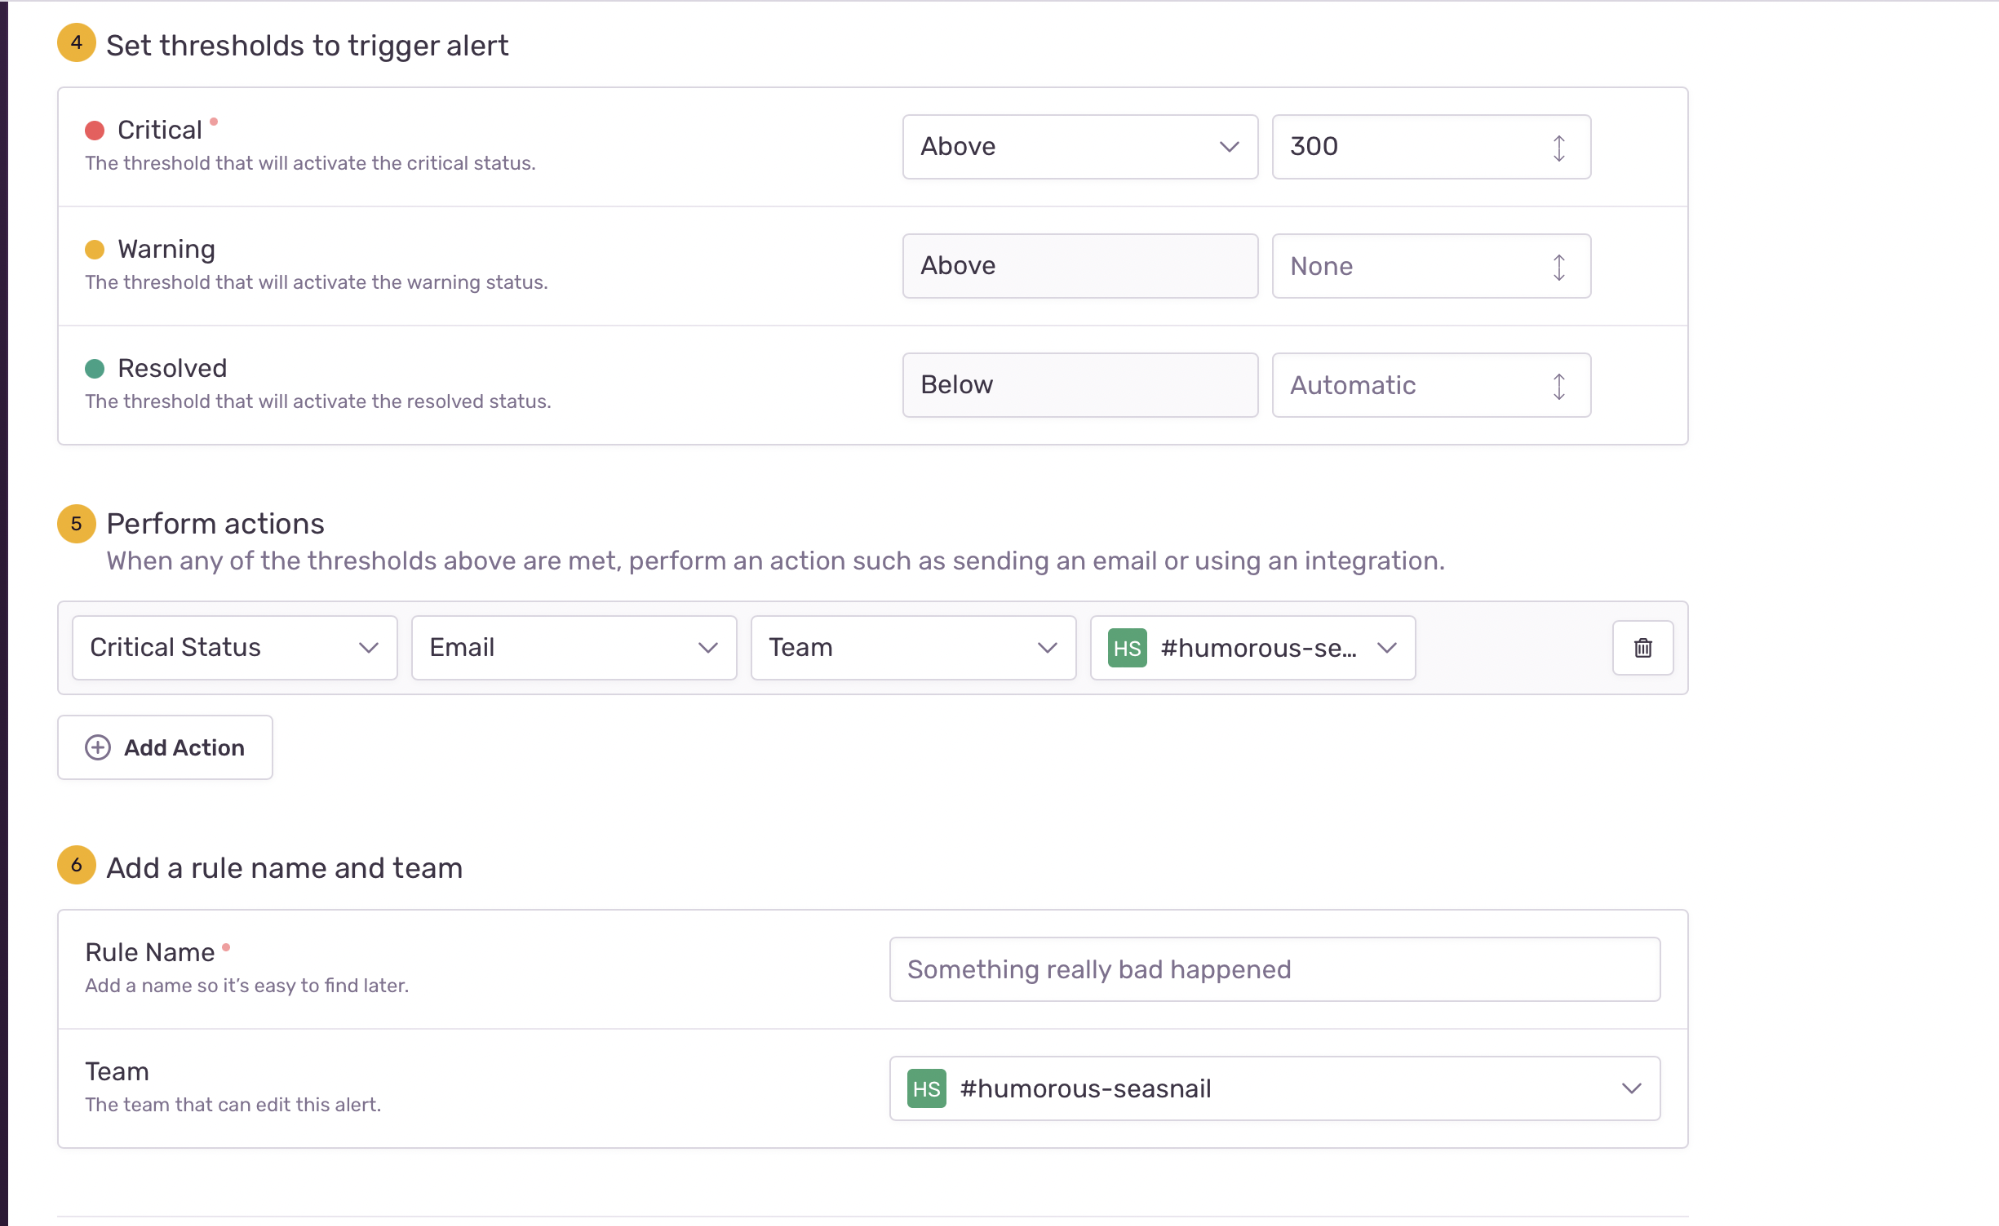
Hereafter, define the conditions that must be met to trigger alerts.
"Perform Actions" allows developers to configure the callback for the alert. For example, you can choose to send an email depending on the trigger stats (Critical, Warning, Resolved).
Finally, click "Save Rule" upon verification, and Sentry will start alerting your team based on the conditions you've specified.
This helps enforce observability which allows developers to debug their Unity applications actively.
Releases
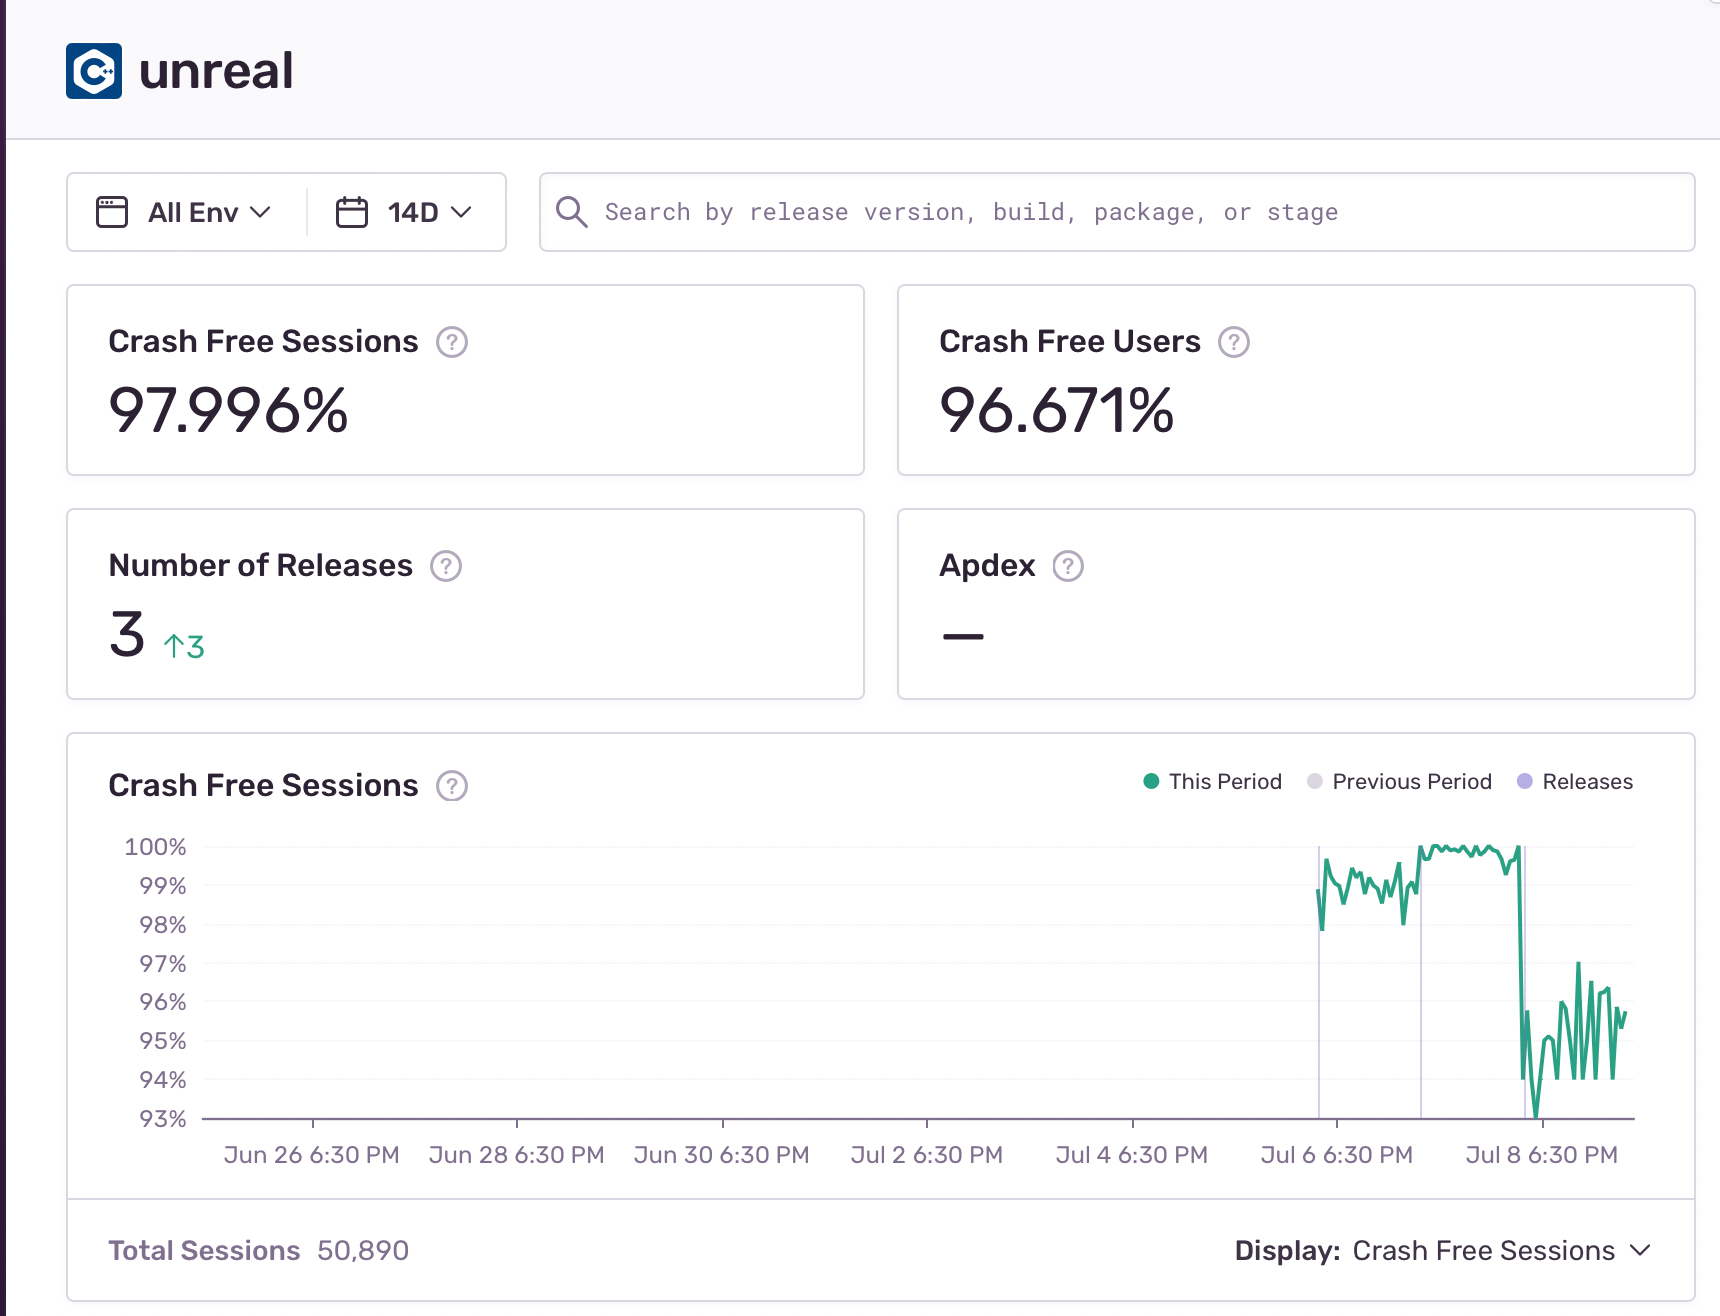
Releases play a crucial role in feature iteration and help identify new bugs for existing features. Sentry does this elegantly via the use of "Releases."
For example, Sentry records the percentage of crash-free users and the crash-free sessions across releases. Combining this with Sentry tracing allows developers to find out the exact cause of the error, bug, or bottleneck and fix it before the users start to report it. The figure shown below illustrates how Sentry provides Release metrics.
Conclusion
The chances that your Unity project runs error-free the first time rarely occur. Therefore, learning to debug your Unity applications effectively will help identify edge cases and bugs and quickly fix them before the end-user notice an issue.
This article explored multiple techniques that you can consider to debug Unity applications. Adopting the techniques discussed here will help make your Unity games more performant and error-free.

