Introducing AI Agent Monitoring
Introducing AI Agent Monitoring
AI is changing how we build software — but debugging code still comes down to having context.
One minute the model’s performance is cruising. The next, you’re hit with a KeyError from a tool you forgot existed, triggered by a model that silently timed out, and a retrieval call that returns... nothing, or 11 “Let me try this a different way" messages before failure.
You’re stitching together LLM calls, agents, vector stores, and custom logic. Then hoping it holds up in prod. Sometimes it does.
When it doesn’t, you need visibility beyond model calls and logs. Debugging in AI is just different.
As the way developers build with AI evolves, the expectations for LLM Monitoring have changed also. Today we’re launching a major upgrade to Sentry Agent Monitoring — built for how AI systems actually break. It brings tracing, tool visibility, model performance, and deep context into one unified experience — so you can quickly understand what broke, where, and why.
Agent Monitoring, with full-stack context
This isn’t just a stream of logs — because you’re not just making an API call. You’re orchestrating combinations of language models, retrieval pipelines, tool calls, and business logic. When something breaks, you need to understand the flow of what happened end to end, across both AI and non-AI components.
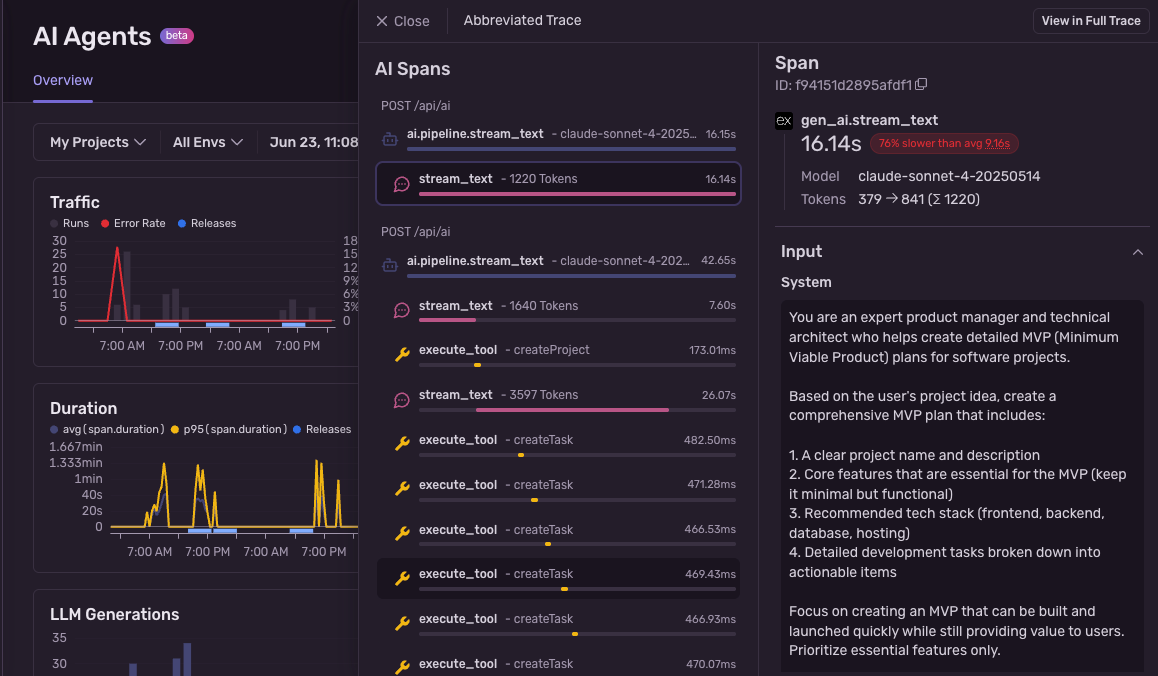
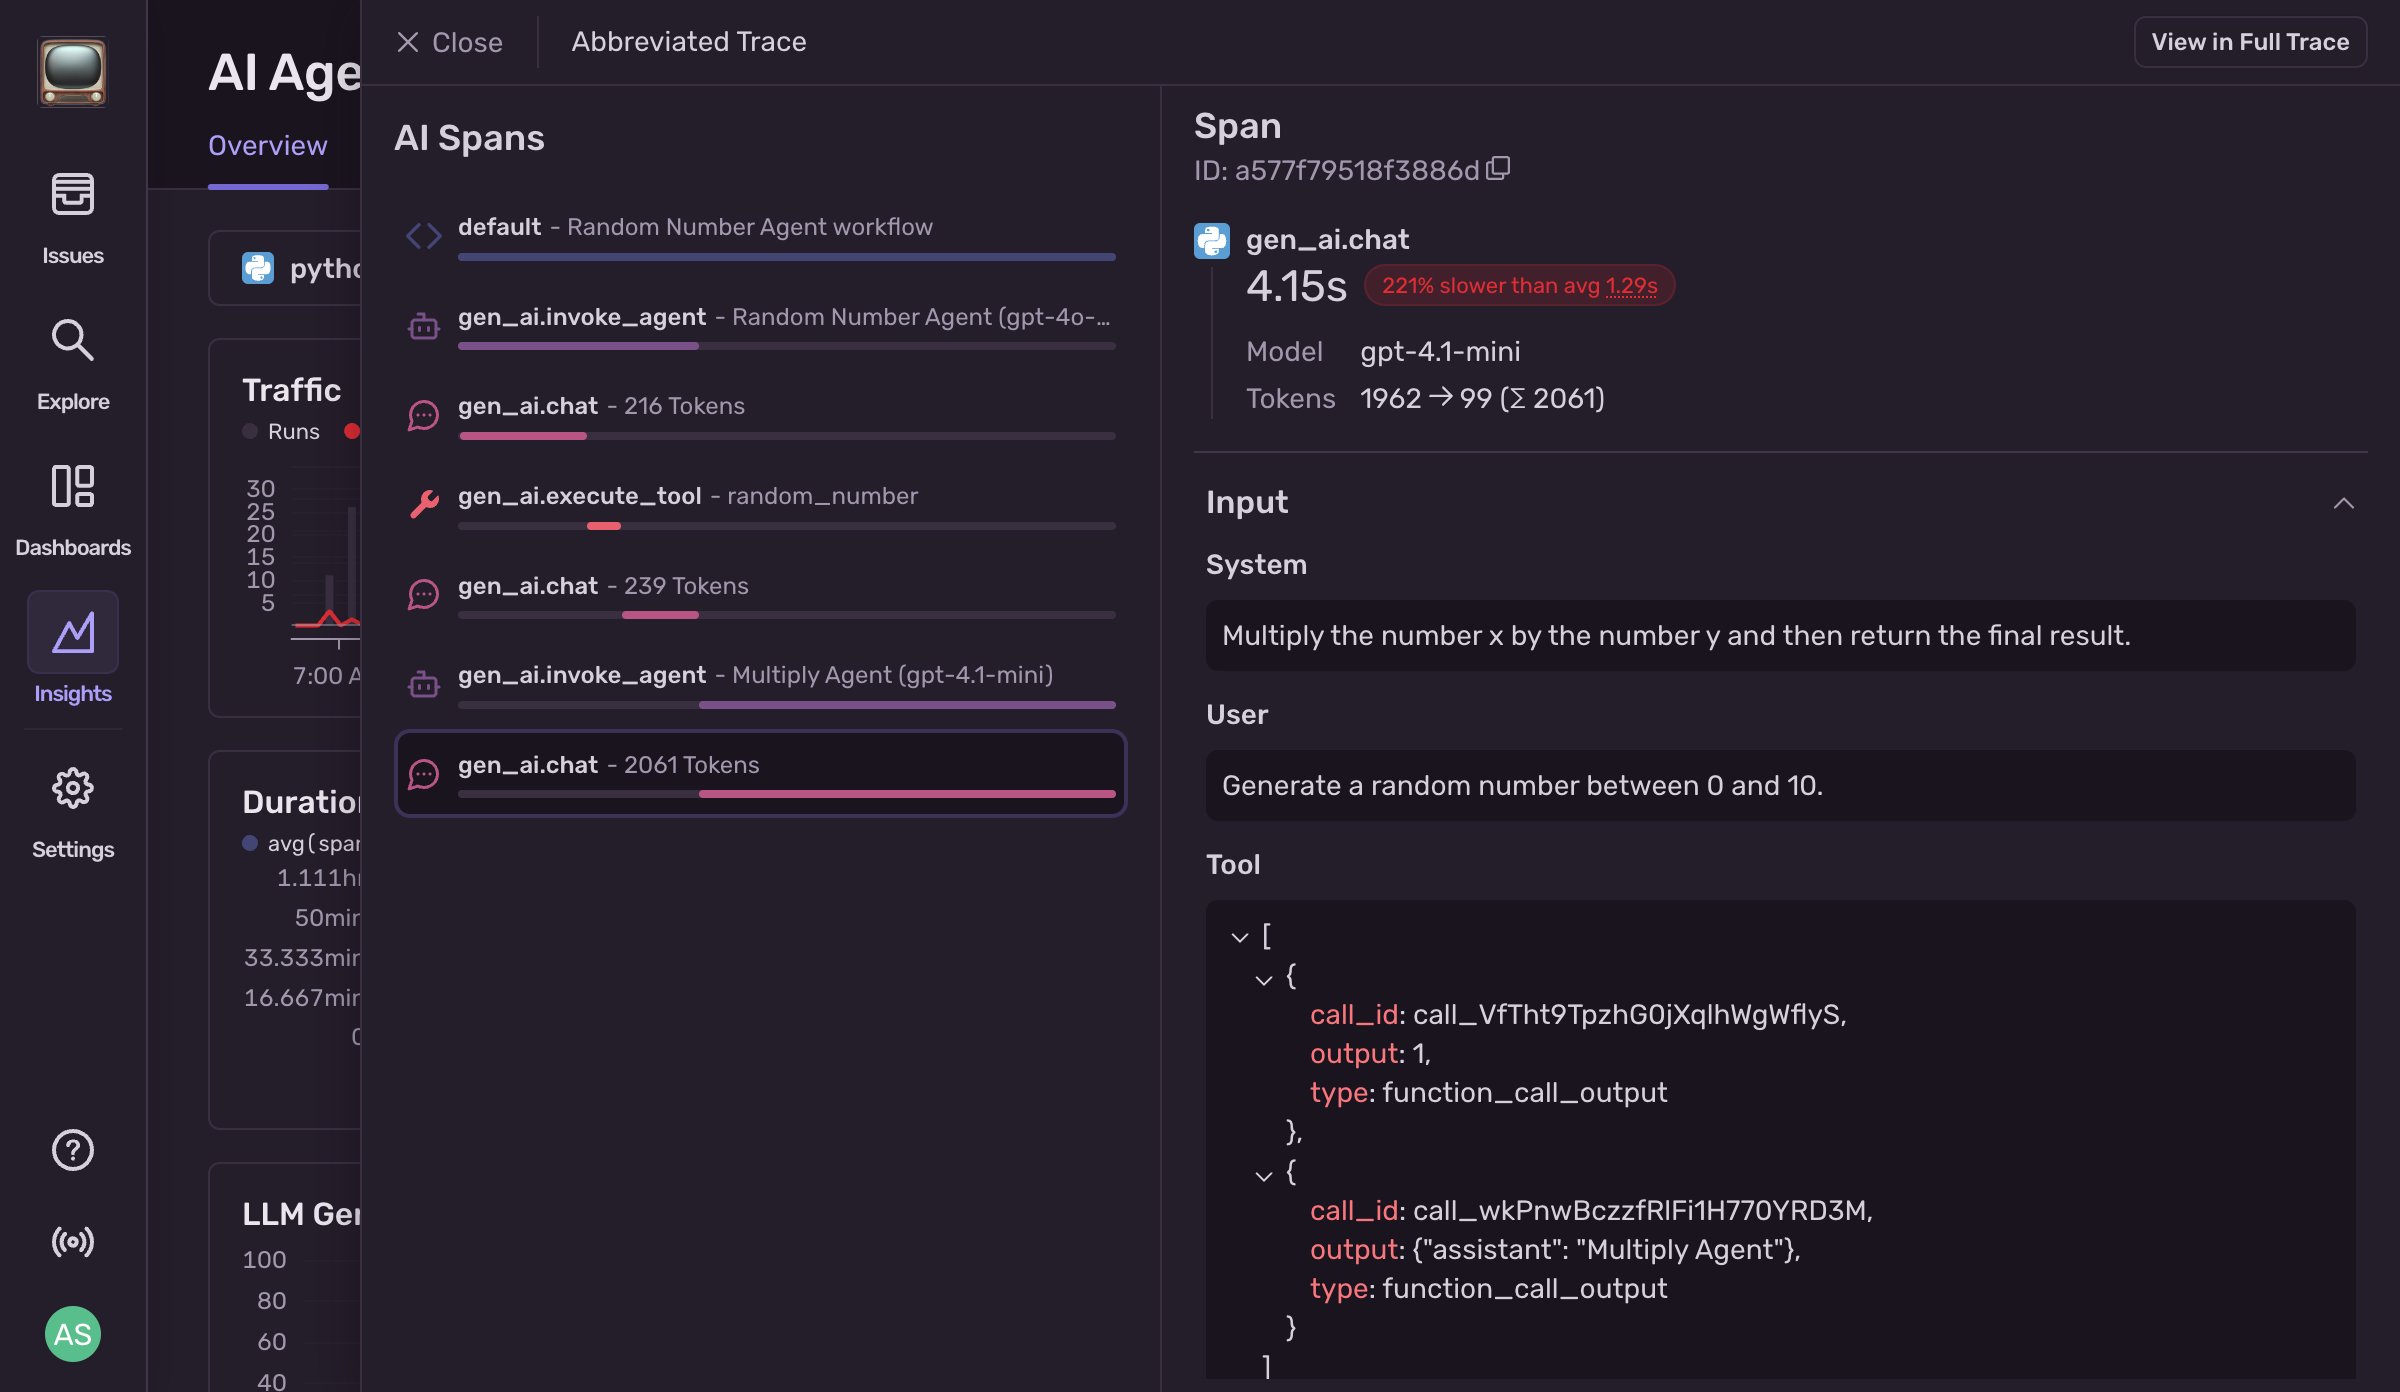
With Agent Monitoring, you get a complete, interactive trace of every agent run:
Full execution breakdowns: from the System prompts, across user input, model generation, tool usage, and final output — making it easy to see what actually happened at each step, not just where it ended up.
Model performance details: token usage, latency, error rate — all filterable by model name and version — to surface slow, costly, or silently failing calls before they hit production users.
Tool analytics: usage volume, durations, and failure patterns — helping you identify bottlenecks, debug tool errors, and understand where the heavy lifting is really happening.
Error tagging and grouping: automatically groups similar failures across runs — reducing noise and letting you focus on fixing what matters most.
You can explore traffic, inspect individual traces, filter by model or tool, and immediately see what failed, where, and for which users.
We care a lot about giving developers “context” when it comes to debugging; and that's so much more important in AI. That’s what makes our approach to LLM monitoring different: Sentry’s tracing connects this AI-specific data to your entire application stack and Sentry’s debugging context.
You’ll see your OpenAI run right alongside a replay of a user engaging with your frontend, backend API spans, and full-stack performance metrics. Everything in one place, from model call to user impact. From how your system sees it, to how your systems process it.
What can you do with it?
Agent monitoring is like having a black box recorder for your AI features — except it doesn’t just tell you that something failed, it shows you why, for who, and in which release. It catches dropped prompts, missing variables, and brittle tool calls before they quietly fail in production. And when something does break, Sentry gives you the whole story: what input triggered it, where in the flow it failed, what the model or tool returned — and which version of your prompt or code was running when it happened.
It works with Vercel’s AI SDK and OpenAI Agents for Python – with more support coming soon. You’ll see exactly which users were affected, how often, and what changed — so you can stop guessing and start fixing, fast.
Uncover prompt failures before they disappear
Instead of digging through logs to figure out why your AI feature didn’t respond — only to realize the model was never even called — Sentry shows you exactly where things went wrong.
When a missing variable causes a KeyError during prompt construction, Sentry captures the error, the input that triggered it, and the version of the template in use. You don’t have to guess whether it was bad data, missing context, or a logic bug — it’s all there in the trace.
Catch broken model output before your UI (or API) crashes
Instead of trying to decode a stack trace from your frontend or backend when something blows up parsing AI output, Sentry shows you the full path of what went wrong — starting with the model response itself.
Sometimes models return malformed JSON, unexpected formats, or unexpected values that don’t match what your applications expect. Sentry captures the raw model output, where it was generated, and how that output flowed into other parts of your app.
Spot slow or failing tools
Instead of assuming the model is slow or the user input is complex, you can trace exactly which tools your agent is spending the most of its time on — and which of them are actually failing.
With Sentry, you get a full breakdown of every tool and model call in your agent flow, including how long each step took and whether it succeeded. If your calendar tool suddenly starts timing out or returning errors, you'll see its latency spike and error rate climb — right alongside which runs and users were impacted.
Getting started
AI systems are complex — and even when your code looks right, things can still go wrong. Prompts break. Tools fail. Outputs don’t render. Without knowing exactly where and why, fixing those issues is slow, reactive, and expensive.
Sentry Agent Monitoring helps you make sense of that complexity. It connects what your agents are doing to what your users are experiencing and what your systems are logging — all in one place.
It’s available to all Sentry users today. To get started you can use one of the following SDKs with auto-instrumentation:
OpenAI SDK - coming soon
Make sure that the Sentry SDK is bumped to the latest version (2.31.0 for Python, 9.321.0 for JS).
Read more in the docs then give it a try and let us know what you think on Discord or GitHub. Or, if you’re new to Sentry, get started for free.


