Application Profiling for Node.js
Application Profiling for Node.js
Profiling is an important tool in every developer’s toolkit because it provides a granular view into the execution of your program from your production environment. This is an important concept, as performance bottlenecks can often be very hard or even impossible to reproduce locally due to external constraints or loads only seen in a production environment.
After releasing profiling support for iOS and Android at Sentry, we wanted to expand support to other platforms - one of the obvious and most popular ones being Node.js. We are happy to announce that while profiling support for Node.js is still in its early days, it's available in alpha to use for free -- we'll post updates on social and Discord when we get closer to GA.
Setting up Profiling for Node.js
To setup profiling for Node.js, you will need to install our @sentry/profiling-node package, import our package, add the integration and set your desired sampling rate for profiles.
Profiling builds on top of our Sentry Performance product, so you will need to have that set up too. Once that is done, any code between your Sentry.startTransaction and transaction.finish will be automatically profiled.
import * as Sentry from '@sentry/node';
import '@sentry/tracing';
// profiling has to be imported after @sentry/tracing
import { ProfilingIntegration } from '@sentry/profiling-node';
Sentry.init({
dsn: '[https://examplePublicKey@o0.ingest.sentry.io/0](https://examplePublicKey@o0.ingest.sentry.io/0)',
tracesSampleRate: 1,
// Set sampling rate for profiling
profilesSampleRate: 1,
// Add profiling integration
integrations: [new ProfilingIntegration()]
});
const transaction = Sentry.startTransaction({name: "Profiled transaction"});
// Some slow function
transaction.finish()Under the hood, our package leverages the built-in V8 profiler to obtain stack samples at a sampling frequency of ~100Hz. Once a profile is finished, the resulting stack samples are uploaded to your Sentry dashboard where they can be visualized in the form of flame graphs. Flame graphs allow the user to visualize stack samples collected by the profiler in chronological order. This allows you to see in which function calls your program is spending the most time in.
What we learned from profiling our own code
We started off by adding profiling to an express server which runs Chartcuterie (a service that generates thumbnail images for chart links shared through Slack), our entire frontend test suite and an internal Slack bot implementation. After a few successful back and forths of bug fixes, performance improvements, and the final hurrah of providing precompiled binaries, we managed to successfully enable profiling.
To successfully profile our code, we first ensured that all our services were instrumented with Sentry’s Performance product. Because Sentry traces your latency issues across services, you can easily correlate profiles with transactions and identify the root cause of your slow requests. Going into our Performance dashboard also helped us establish a baseline for how our application was performing — since we could clearly track our p75 durations prior to us implementing profiling, versus after.
Finding the performance culprit — spoiler: it’s not always the test code
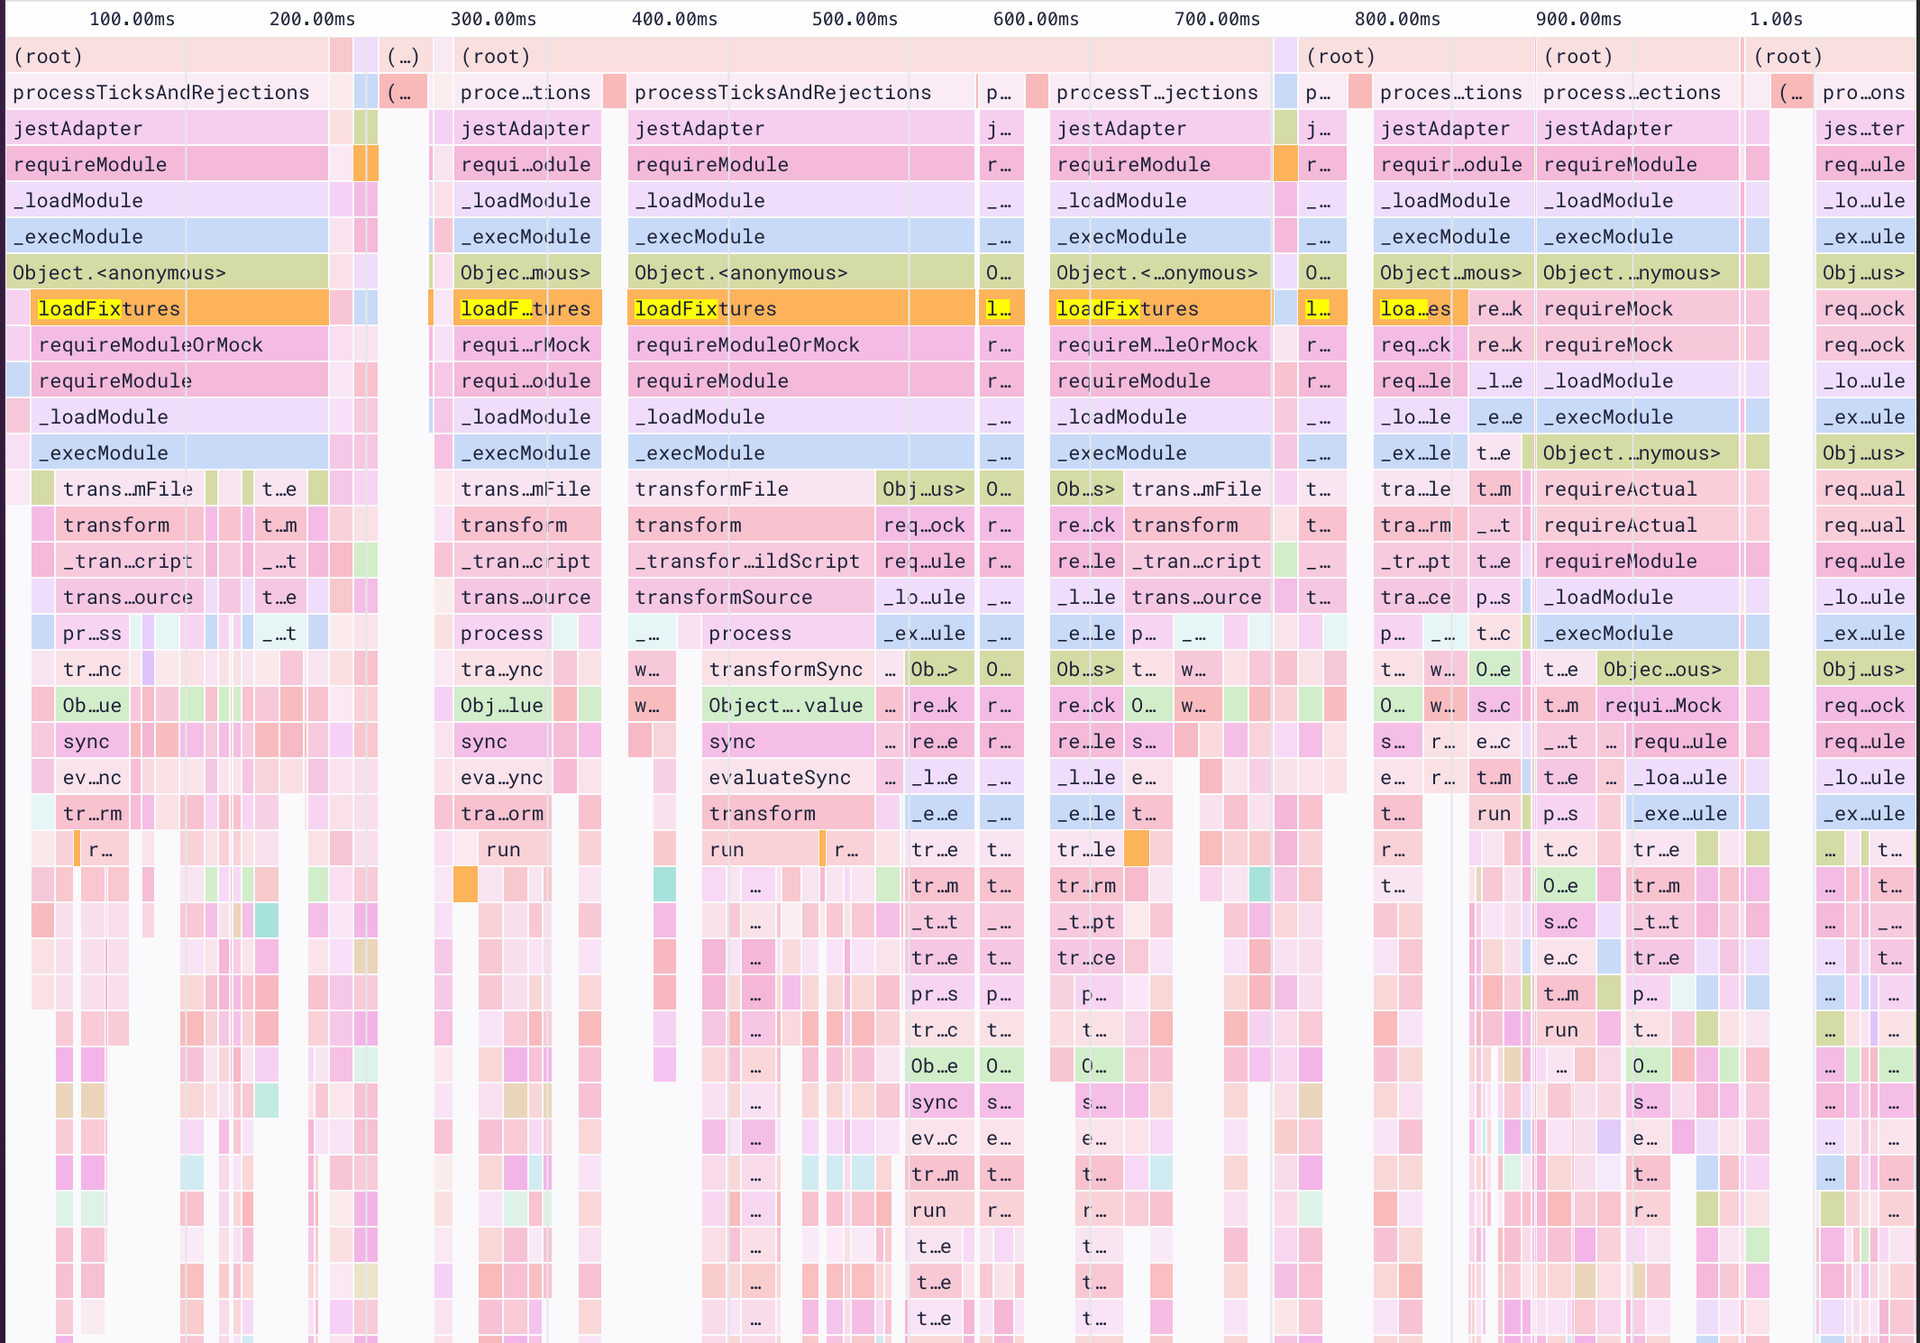
Sentry’s frontend codebase consists of about 4k tests spread over ~400 test files. After looking at a few profiles from our CI environment, we noticed that in some tests, a significant amount of time was spent inside a loadFixtures function call. The loadFixtures call happens as part of our setup.ts script that runs before a test executes, preparing the environment so the test can be executed. What we can see in our flame graph is that our test setup code accounts for a large majority of the test duration. This prompted us to look at what our test setup is doing.
In pseudo code, this is what loadFixtures does
// Preload all stubs and expose it as globals through window.
for(const file in fs.readdirSync(stubsDir)){
  const stub = require(file);
  // remap each export to the global window object
	for(const key in stub){
		window.TestStubs[key] = stub[key]
	}
}
There is nothing wrong with this code; it allows us to stub parts of the code in our tests without having to write require/import statements. However the ergonomic benefit of this developer experience does not come for free. It means that we are now preloading all of the code inside our stubsDir (even if it is not actually required by the test). This problem is further exacerbated by the fact that Jest does not respect require.cache and the fact that scripts defined in setupFilesAfterEnv run once per file.
We fixed this issue by leveraging JavaScript proxies and making the requires lazy. This allowed us to preserve the developer experience without impacting performance. You can see the full fix here.
Finding a slow test
Some of our Sentry frontend tests can be quite slow to run (sometimes in excess of minutes), but the reasoning varies for each test. Some tests are slow because they are testing complex components with large dependency graphs, which means just transpiling all of that code for the first time is a slow operation; others may be testing components that are slow to render. To top it off, our tests run on the default GitHub Ubuntu runners which is an environment that is quite different from the M1 based macOS environments we use for local development. All this to say that the reason why a particular piece of code could be slow to run can vary quite a lot, and without profiling, it would be hard to tell what exactly is happening. This is why having profiles collected from your actual environment is so important.
This is where a waterfall like pattern in some of our profiles caught our eye:
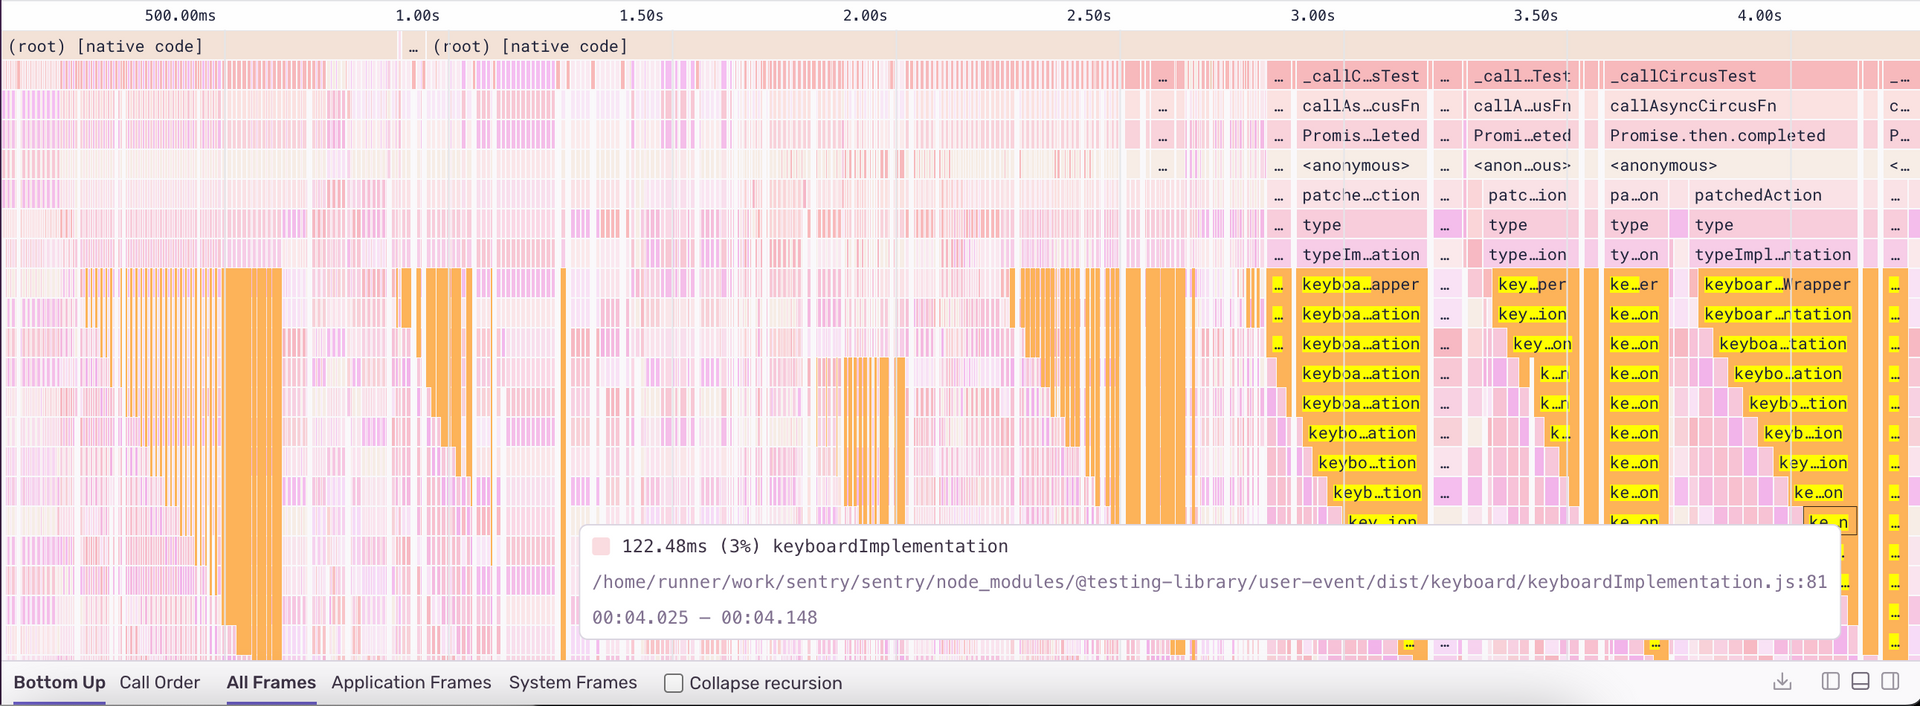
In the above flame graph, we can see a waterfall pattern of calls to keyboardImplementation which occurs roughly 7 times in our entire test run and takes a big chunk of the total test time.
Before we go further, this is not a knock on the user-event library. We still use keyboard events everywhere because they help us accurately test user behavior.
However in our case, we were testing a modal that users see when they want to invite new team members. We were repeatedly using userEvent.type with long email strings which causes a re-render of our entire component. Rewriting our component to optimize renders was out of the question since it would not have been a quick undertaking — though ultimately, it would have been the right solution. We opted to mitigate this by using userEvent.paste to simulate a user pasting an email into the input - this does not fire an event for each character in the string and improves the speed of our test.
Finding a problem outside our service
Our Chartcuterie service generates thumbnails for whenever one of our Slack links is shared. This allows you to immediately see charts in Slack without having to open the dashboard. For a while, this service had been struggling with out of memory exceptions which means it had to frequently be restarted. The cause of the crashes was eventually caught and fixed before profiling was enabled, but it was not a straightforward fix as the root cause of the memory leak was hard to diagnose. As my colleague found out, there were cases where we were sending up to 35k individual markers (markers are small lines that are rendered on the chart) to our service to render.
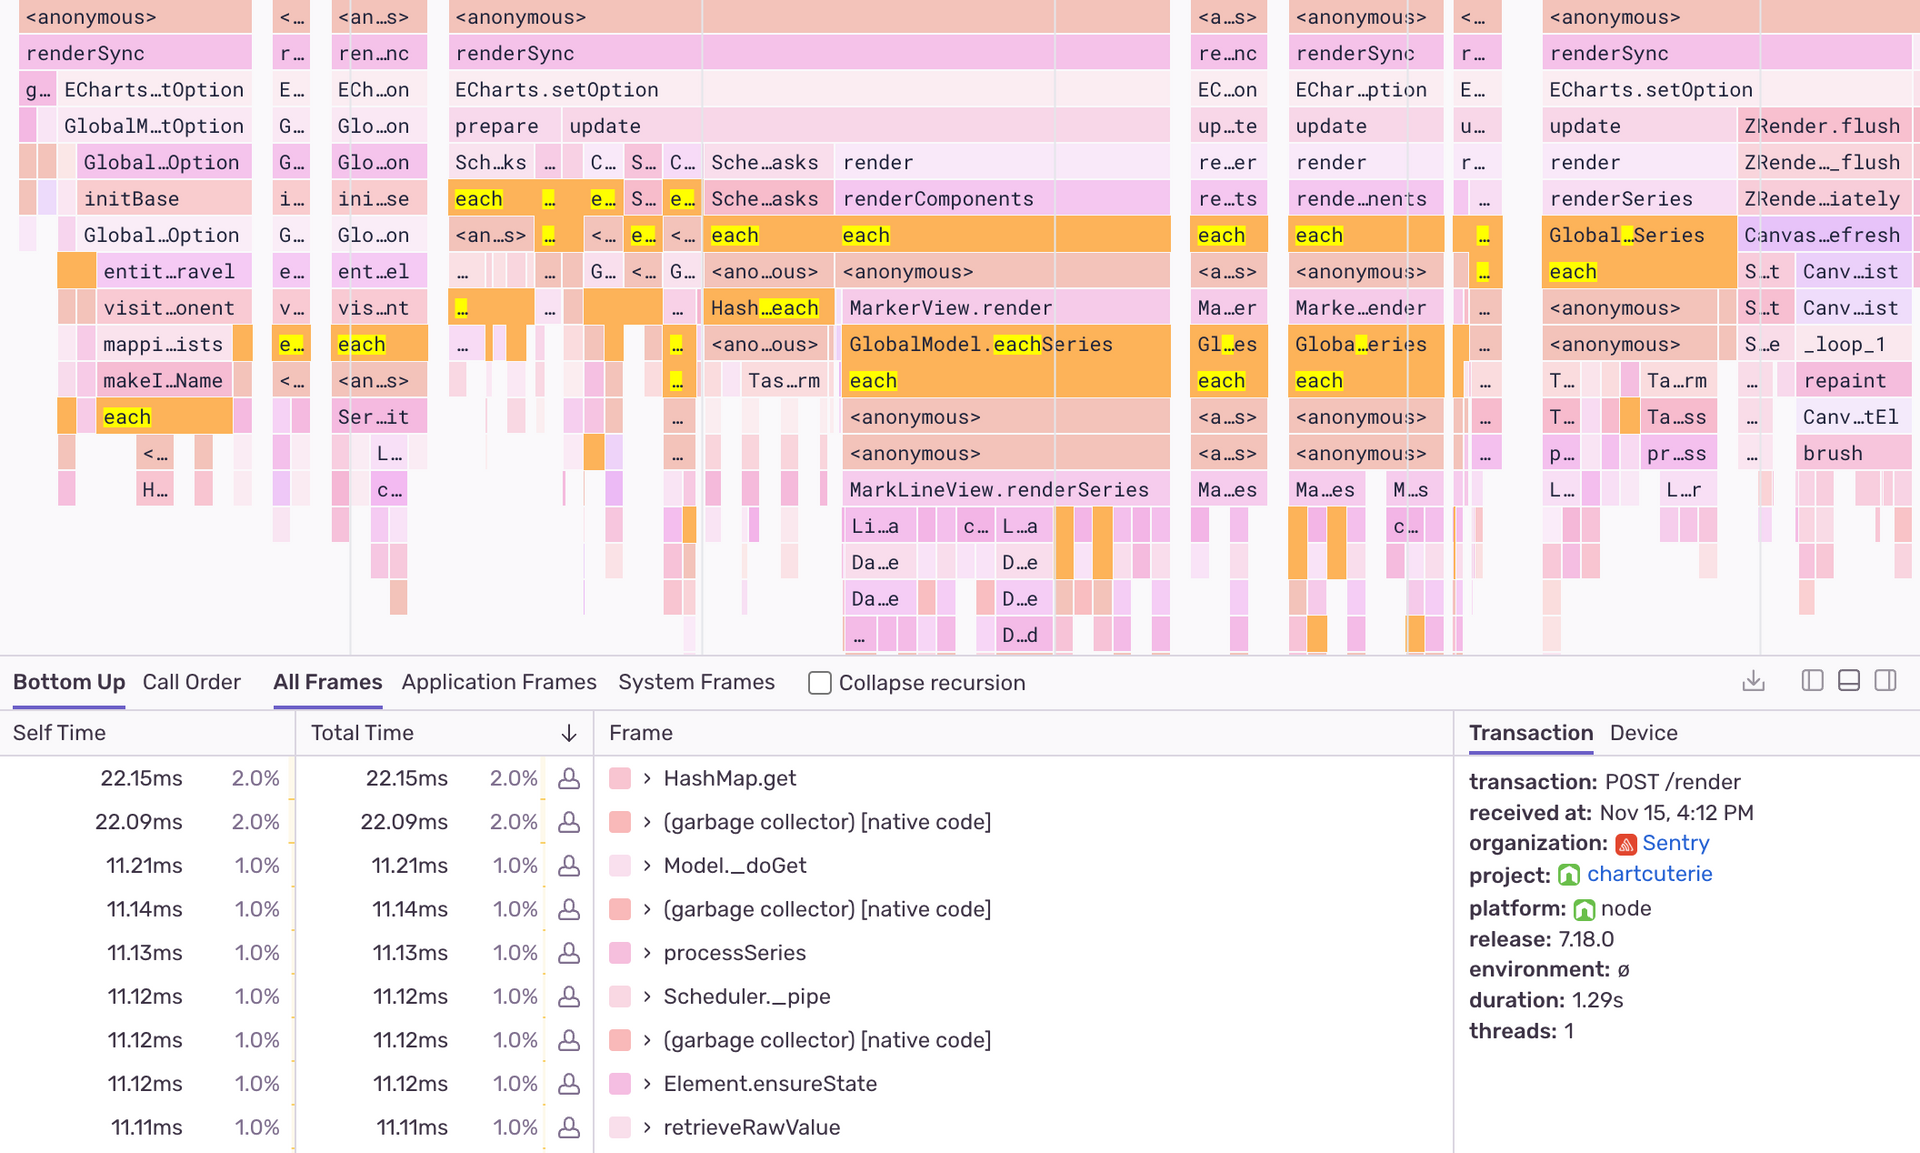
After we enabled profiling and looked at some of the slowest profiles, we could immediately see that the majority of the time was spent by our charting library in calls to functions like HashMap.each , each and GlobalModel.eachSeries.
This would have been valuable information during the original investigation, as it would have hinted at an input problem and could have led us to finding the original cause, which was in this case actually external. (See our PR with the fix for more details.) Moreover, this highlights the importance of profiling a service in production environment and under production load.
In conclusion
We have had success finding optimization opportunities in all Node.js based projects where profiling was added. In some instances, we were able to almost halve our p75 durations, which resulted in direct improvements in user experience or helped us keep our own developer experience smooth by providing our developers with a fast(er) feedback loop.
We have also seen that profiling builds on top of Sentry’s Performance product by providing the logical next set of information that developers require to resolve performance-related issues.
As with anything performance-related, remember to first set performance goals as a benchmark to track performance improvements before you dive into making fixes.
Get started with profiling today. Pro-tip: make sure you have Performance Monitoring enabled first (it takes just 5 lines of code). And, as we expand Profiling to more SDK communities and users, we want to hear your feedback. Reach out in Discord or even email us directly at profiling@sentry.io to share your experience.


