Prioritize the Right Performance Monitoring Metrics

Now every developer can customize the performance monitoring charts and data views on the Performance page to see what is most important to them and their team, helping prioritize relevant performance monitoring metrics so they can take action faster. And when you jump back into Sentry Performance, the page is saved right where you left off.
Say you’re working on a new release. You can edit your Performance page to include User Misery, Transaction Throughput, and Failure Rate. That way, if users are disengaging and failure rates are increasing, you have the data to roll back a release and resolve the performance regression.
Alternatively, if you’re working on a mobile app, you may want to focus on Startup Times, Slow Frames, and Throughput. Studies show that users are likely to abandon applications where startup times are longer than 2 seconds. We figured you’d want to keep bounce numbers down, so we made it easy for you to optimize mobile vitals with the trace context. I’m sure you can think of many different use cases, and the permutations are endless.
TrendsTrends
We know your codebase is constantly changing. You’re adding new features, paying down technical debt, or you’re instrumenting an analytics tool because your PM needs to measure conversion; whatever the case may be, these changes can affect reliability and performance.
To keep tabs on fluctuations in performance, Sentry shows you your most improved and regressed transactions. That way, you can learn from recent releases and address reintroduced regressions right away in a view we call Trends. Trends helps you quickly see which transactions had the highest % increase in latency in the last week, or since your last release. Conversely, it can also show you which transactions have actually improved the most. This is a great way to see whether a fix you made in your last release actually resulted in improved performance metrics.
While Trends is accessible from the Performance page, you may want to have it front and center. So, we widgetized the graphs so you can add them to your custom Performance view.
ChecklistsChecklists
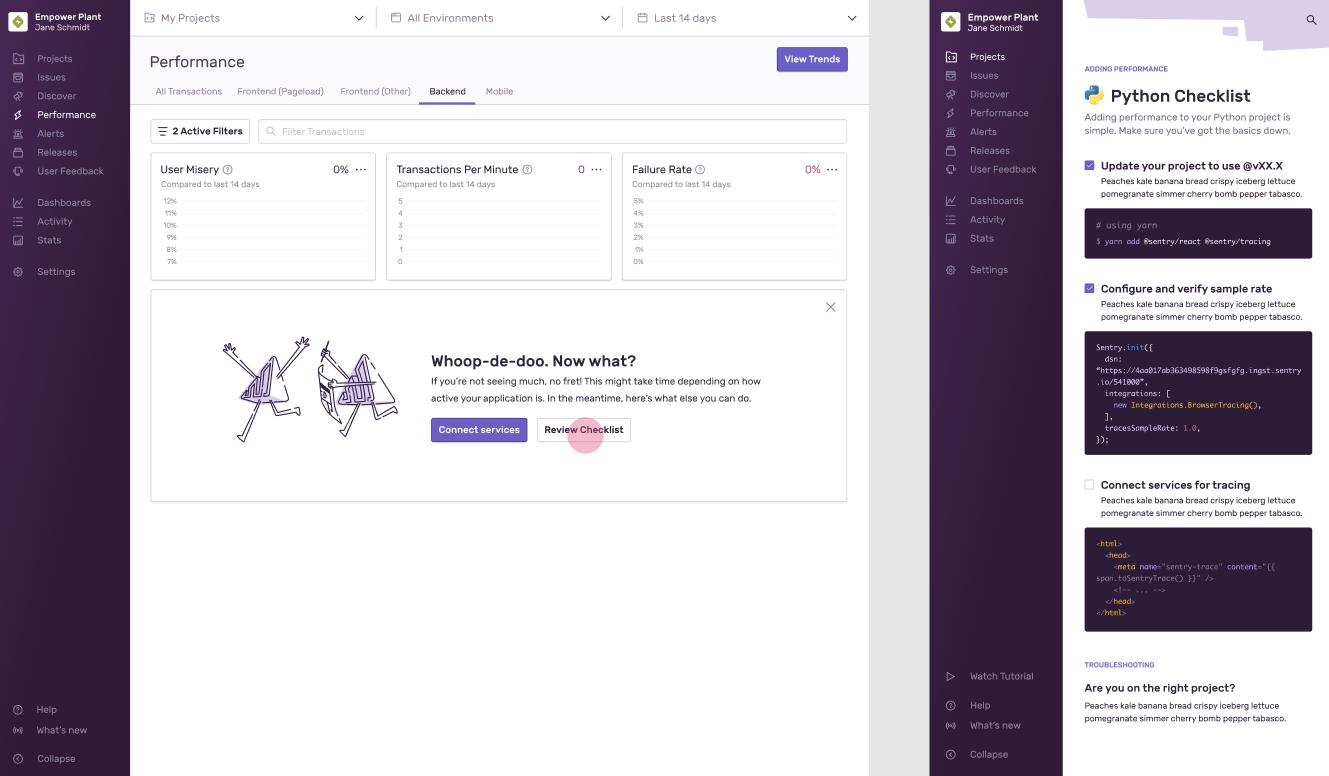
Don’t have performance monitoring set up yet? This is not fine. We added checklists to guide you through the setup, with instructions tailored to the language you’re using so set up Performance without having to read through our docs.
Log in to your account to customize your performance experience or if you’re new to Sentry request a demo and try it out for free.


