Performance Monitoring in Next.js Applications
Performance Monitoring in Next.js Applications
Performance monitoring is an essential part of development. It’s usually one of the first things you’d want to do after setting up an existing project or getting started with a new one. Without monitoring performance, it will be challenging to detect post-development (production issues) issues in your application or how to resolve them. You may end up wasting time attempting to fix something that was never broken.
Why Monitor Performance?
The primary reason for monitoring performance is to understand how our application works for different users using different devices and browsers and any issues that might arise while they are doing so. Furthermore, application performance monitoring helps determine how quickly your application loads, when it is slow, and what causes it to be slow.
Throughout this post, we'll go over how to get started with monitoring performance and tracking problems in Next.js using the Sentry Next.js SDK, as well as several Sentry use cases by testing common issues that may emerge while developing a Next.js application.
Prerequisite
To follow along with this tutorial, the following prerequisites are required:
Basic familiarity with the command line/terminal
Node.js and NPM installed
Familiarity with React and Next.js.
Getting Started
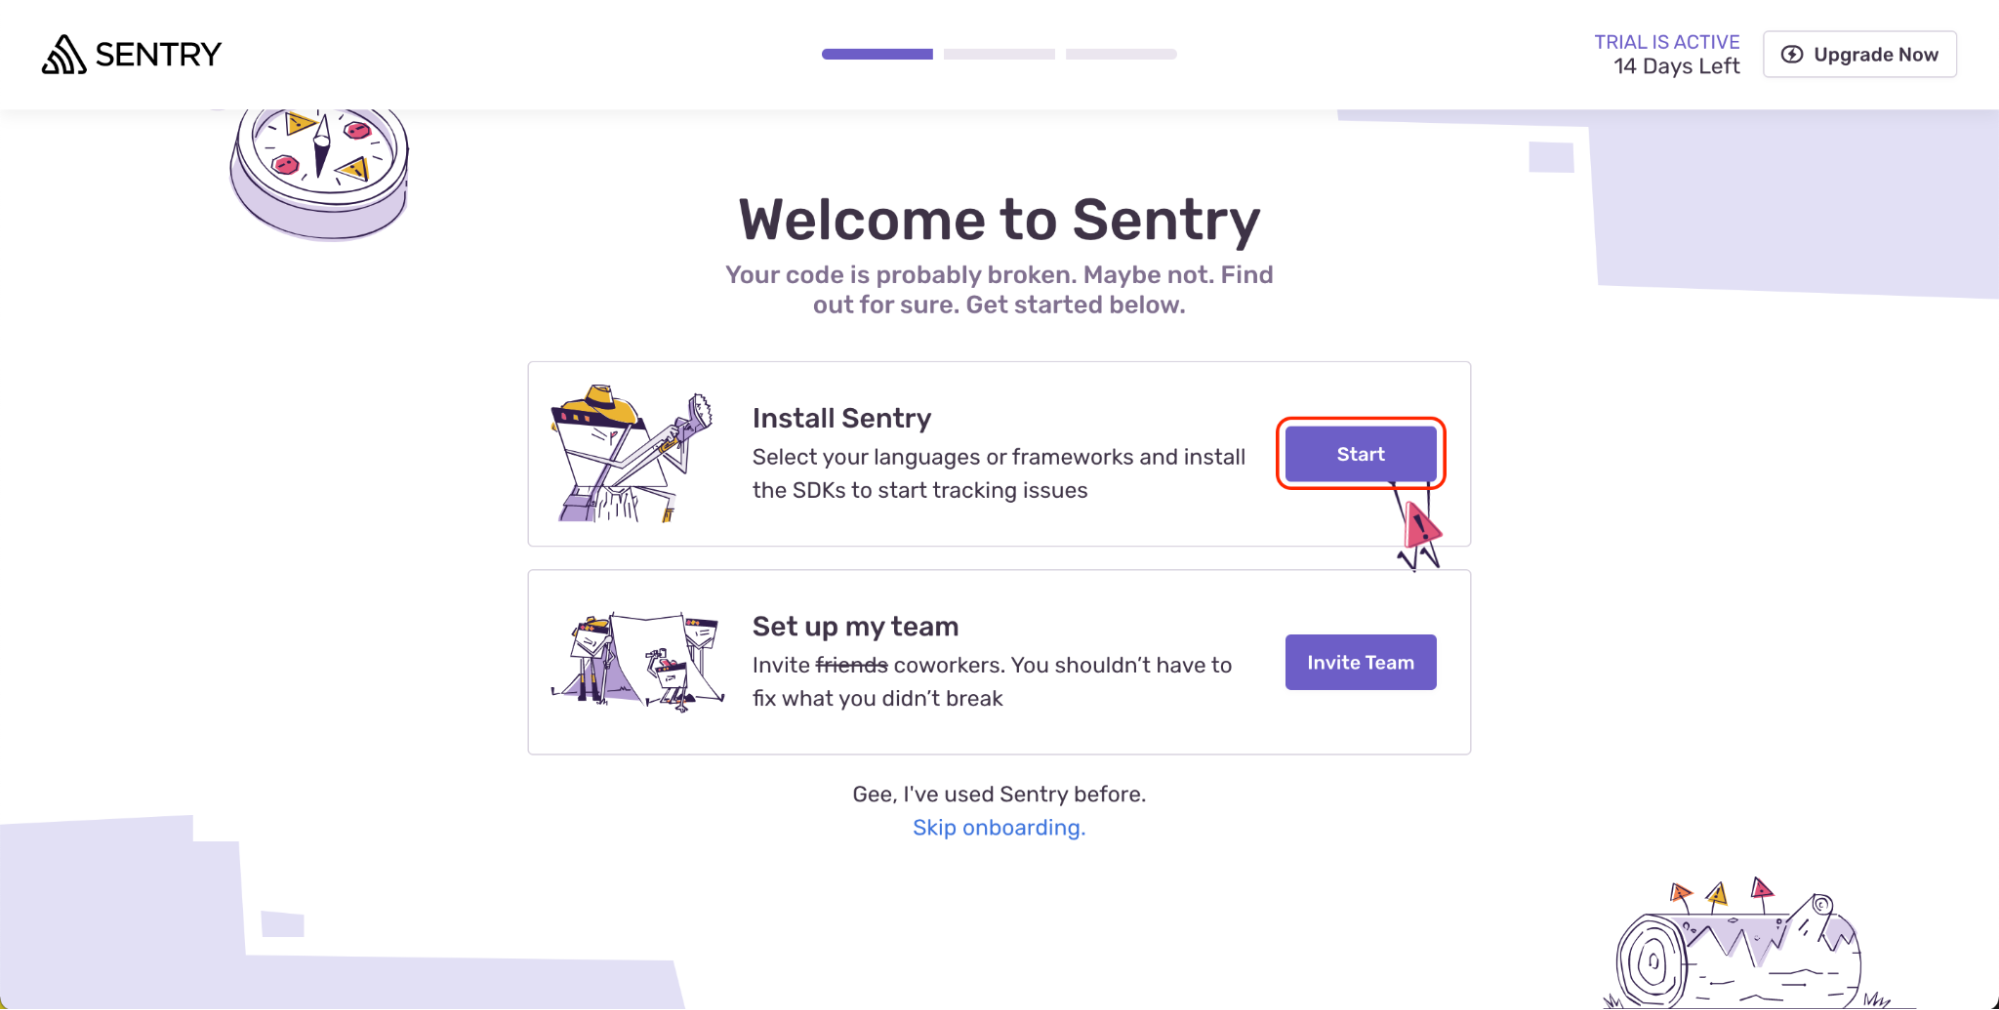
We want to get started by creating a new application on the Sentry platform (if you do not have an account already, head over to the signup page and create a new one). Once in your dashboard, as a first-time user, you'll need to select the “Install Sentry” option, as shown in the image below:
And if you have an existing account, you want to go to the Projects page on your dashboard and create a new project.
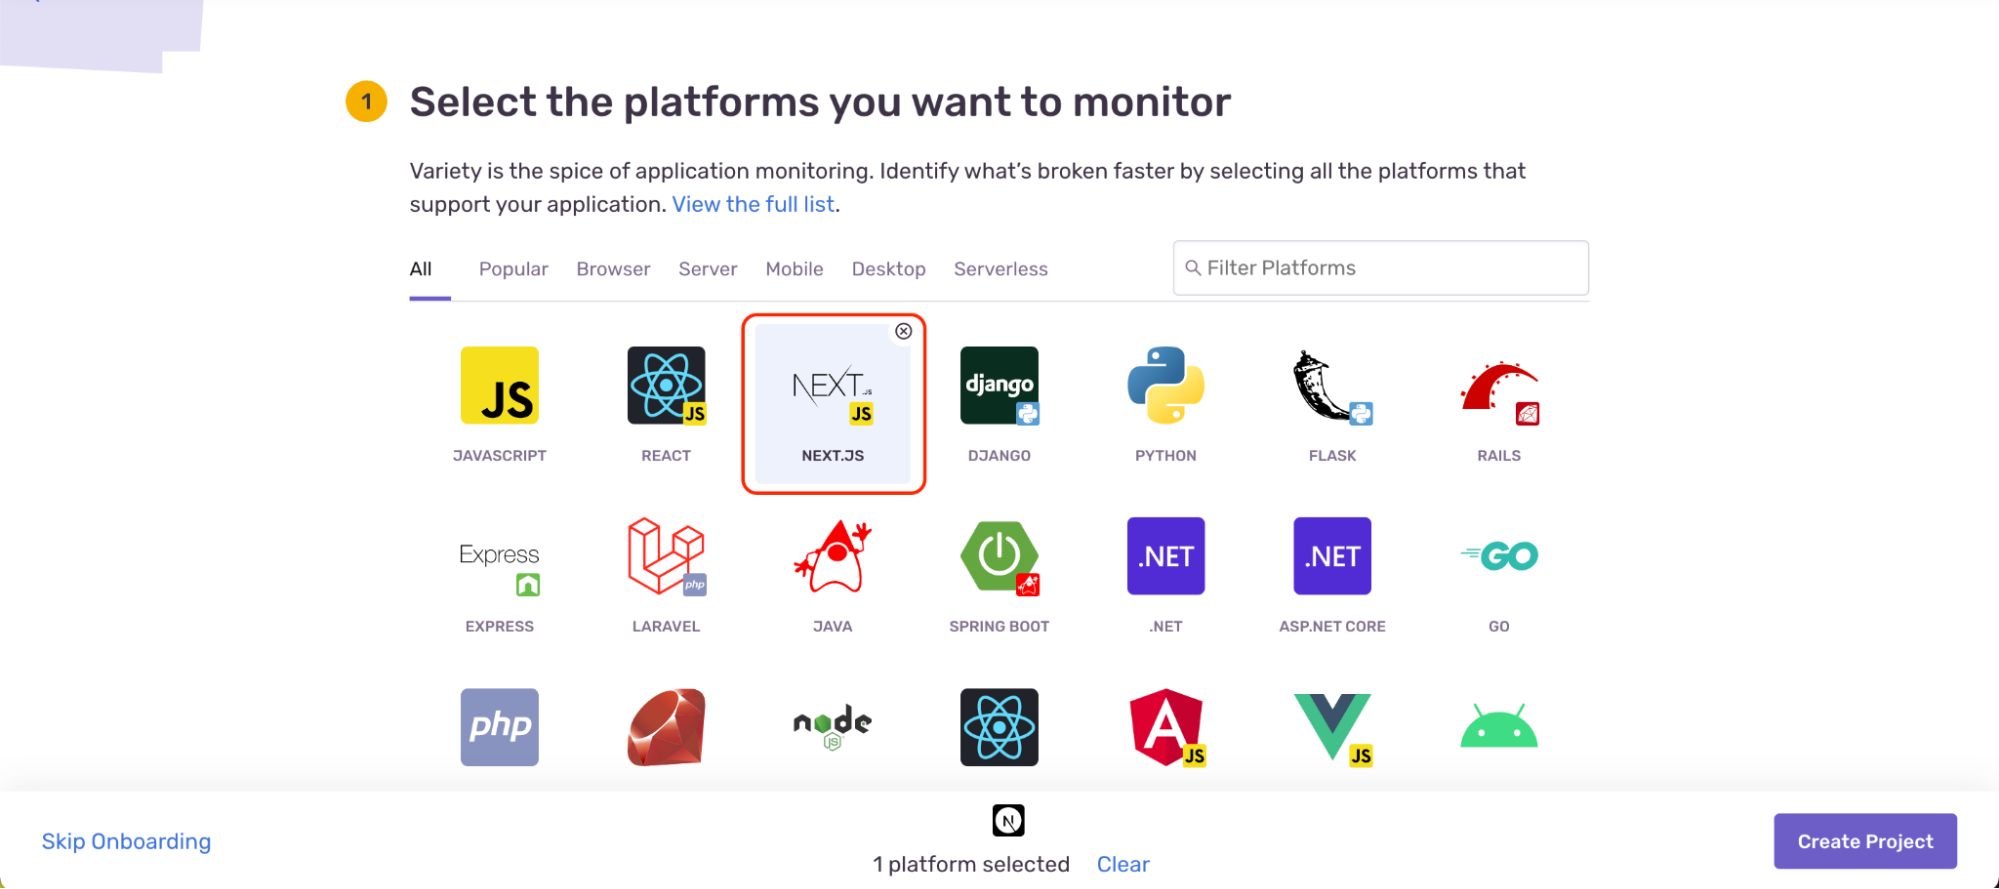
The next step from here is to select your preferred language/framework, and in our case, we selected Next.js, as shown below:
After creating our application on Sentry, we’ll get a "waiting for errors" message, i.e., our new Sentry app has been created and is now waiting for us to try and run some errors on our local application.
Configure Next.js With Sentry
Let's create a new Next.js app by running:
npx create-next-app todo-appOnce the app is created, let’s change the directory into this new app and install Sentry’s Next.js SDK:
cd todo-app

# Install Sentry’s Next.js SDK

npm install --save @sentry/nextjs
# OR
yarn add @sentry/nextjs
After installing the Sentry SDK in our Next.js application, we’ll need to do one last operation to configure it to start monitoring performance and listening for errors. You could choose to follow the manual setup instructions here. However, we'd prefer the Sentry wizard do it for us instead. We can set this up by running the following command:
npx @sentry/wizard -i nextjsRunning this command will create four new files in our application root directory:
sentry.client.config.js
sentry.server.config.js
sentry.properties
next.config.wizardcopy
The first two files contain the code for initializing Sentry for both client-side and server-side operations. The sentry.properties file contains information about the properties of your organization and project. And the last file in the list is what our Next.js configuration file is supposed to look like. The next step is to copy the content of the next.config.wizardcopy file, and update it with our existing next.config.js file so that the complete code for our next.config.js file would look like the below:
/** @type {import('next').NextConfig} */
const nextConfig = {
  reactStrictMode: true,
};

const { withSentryConfig } = require("@sentry/nextjs");
const moduleExports = { nextConfig };

const sentryWebpackPluginOptions = {
  silent: true, // Suppresses all logs
};

module.exports = withSentryConfig(moduleExports, sentryWebpackPluginOptions);
Testing Sentry
To try things out, update the pages/index.js file with the following code:
import { useState } from "react";

export default function Home() {

  return (
    <>
      <button
        type="button"
        onClick={() => {
          throw new Error("Sentry Frontend Error");
        }}
      >
        Throw error
      </button>
    </>
  );
}
In the code above, we are intentionally throwing a new error with the description "Sentry Frontend Error". If we run our application in the browser and click the button that throws the error, this error will be logged in the issues tab on our Sentry dashboard like in the image below:
And when we click on the specific error, we’ll get more details, including the client’s browser information (IP address, device name, and operating system) and a complete description of where and how the error occurred.
Now that we've built our Next.js application with Sentry, let's go ahead and start developing our Todo application to observe some everyday performance issues that occur every time and how Sentry can help trace down errors like these.
Building the Todo Application
The Todo application we will be building will be static with no backend framework or language configured. However, to test how Sentry works with the Next.js API, our initial todos will be served from the Next.js API via an endpoint we’ll define.
To get started, let's install bootstrap to add some beauty and interactivity to our application:
npm install bootstrapOnce the bootstrap package is installed, open the pages/_app.js file and import it so that the entire file content will look like this:
import "bootstrap/dist/css/bootstrap.min.css";
import "../styles/globals.css";

function MyApp({ Component, pageProps }) {
  return <Component {...pageProps} />;
}

export default MyApp;
Afterward, open the public/index.js file and update it with the following code:
import { useState, useEffect } from "react";

export default function Home() {
  const [todos, setTodos] = useState([]);
  const [title, setTitle] = useState("");

  useEffect(() => {
    fetch("/api/todos")
      .then((res) => res.json())
      .then((data) => {
        setTodos(data);
      })
      .catch((err) => {
        console.log(err);
      });
  }, []);

  const markAsCompleted = (id) => {
    const newTodos = todos.map((todo) => {
      if (todo.id === id) {
        todo.completed = !todo.completed;
      }
      return todo;
    });
    setTodos(newTodos);
  };

  const addTodo = (e) => {
    e.preventDefault();
    const newTodos = [...todos, { id: Math.random(), title, completed: false }];
    setTodos(newTodos);
    setTitle("");
  };

  return (
    <>
      <div className="w-50">
          <form action="#" onSubmit={addTodo}>
            <div className="d-flex">
              <input
                type="text"
                className="form-control rounded-0 border-0 border-bottom"
                placeholder="Enter new task here.."
                value={title}
                onChange={(e) => setTitle(e.target.value)}
              />
              <button type="submit" className="btn btn-dark ms-3">
                +
              </button>
          </form>
          {todos.length > 0 && (
            {todos.map((todo) => (
                <div
                  className=" d-flex align-items-center shadow-sm border p-3 fw-bold mb-3"
                  style={{ borderRadius: "10px", cursor: "pointer" }}
                  key={todo.id}
                  onClick={() => markAsCompleted(todo.id)}
                >
                  <div>
                    {todo.completed ? <del>{todo.title}</del> : todo.title}
                  <div
                      className="d-inline-block border rounded-circle"
                      style={{ padding: "10px" }}
                    >
                  </div>
                </div>
              ))}
            </div>
          )}
        </div>
      </div>
    </>
  );
}
In the code above, we used the react useEffect() hook to fetch data from our API endpoint at /api/todos and set the data returned from the API to our todos state. We also defined functions like markAsCompleted() and addTodo() to add interactivity to our todo app. If we run our application, everything seems to work fine with no visible errors. The process of adding new tasks and marking them as completed works fine. Although, the initial todos are not loaded from the API.
The next step is to set up our Next.js API to resolve this and configure Sentry for the Next.js API.
Setup the Next API & Configure Sentry
By creating new files in the pages/api/ endpoint, Next.js allows us to easily create API routes that are mapped to /api/*, and we’ll leverage that to export our todos endpoint. We’ll want to configure Sentry while doing so because we’ll want to track errors and performance in our API routes as well. To do this, simply create a new file called todos.js under the pages/api/ directory, and paste the following content into it:
import { withSentry } from "@sentry/nextjs";

const handler = async (req, res) => {
  const todos = [
    { id: 1, title: "Learn Next.js", completed: false },
    { id: 2, title: "Learn Sentry", completed: false },
    { id: 3, title: "Learn API Monitoring", completed: false },
  ];
  res.status(200).json(todos);
};

export default withSentry(handler);
As you can see from this code, we created a handler that sets the response returned from this endpoint to a static array of todos, and in addition, we’ll export the handler to use the Sentry SDK.
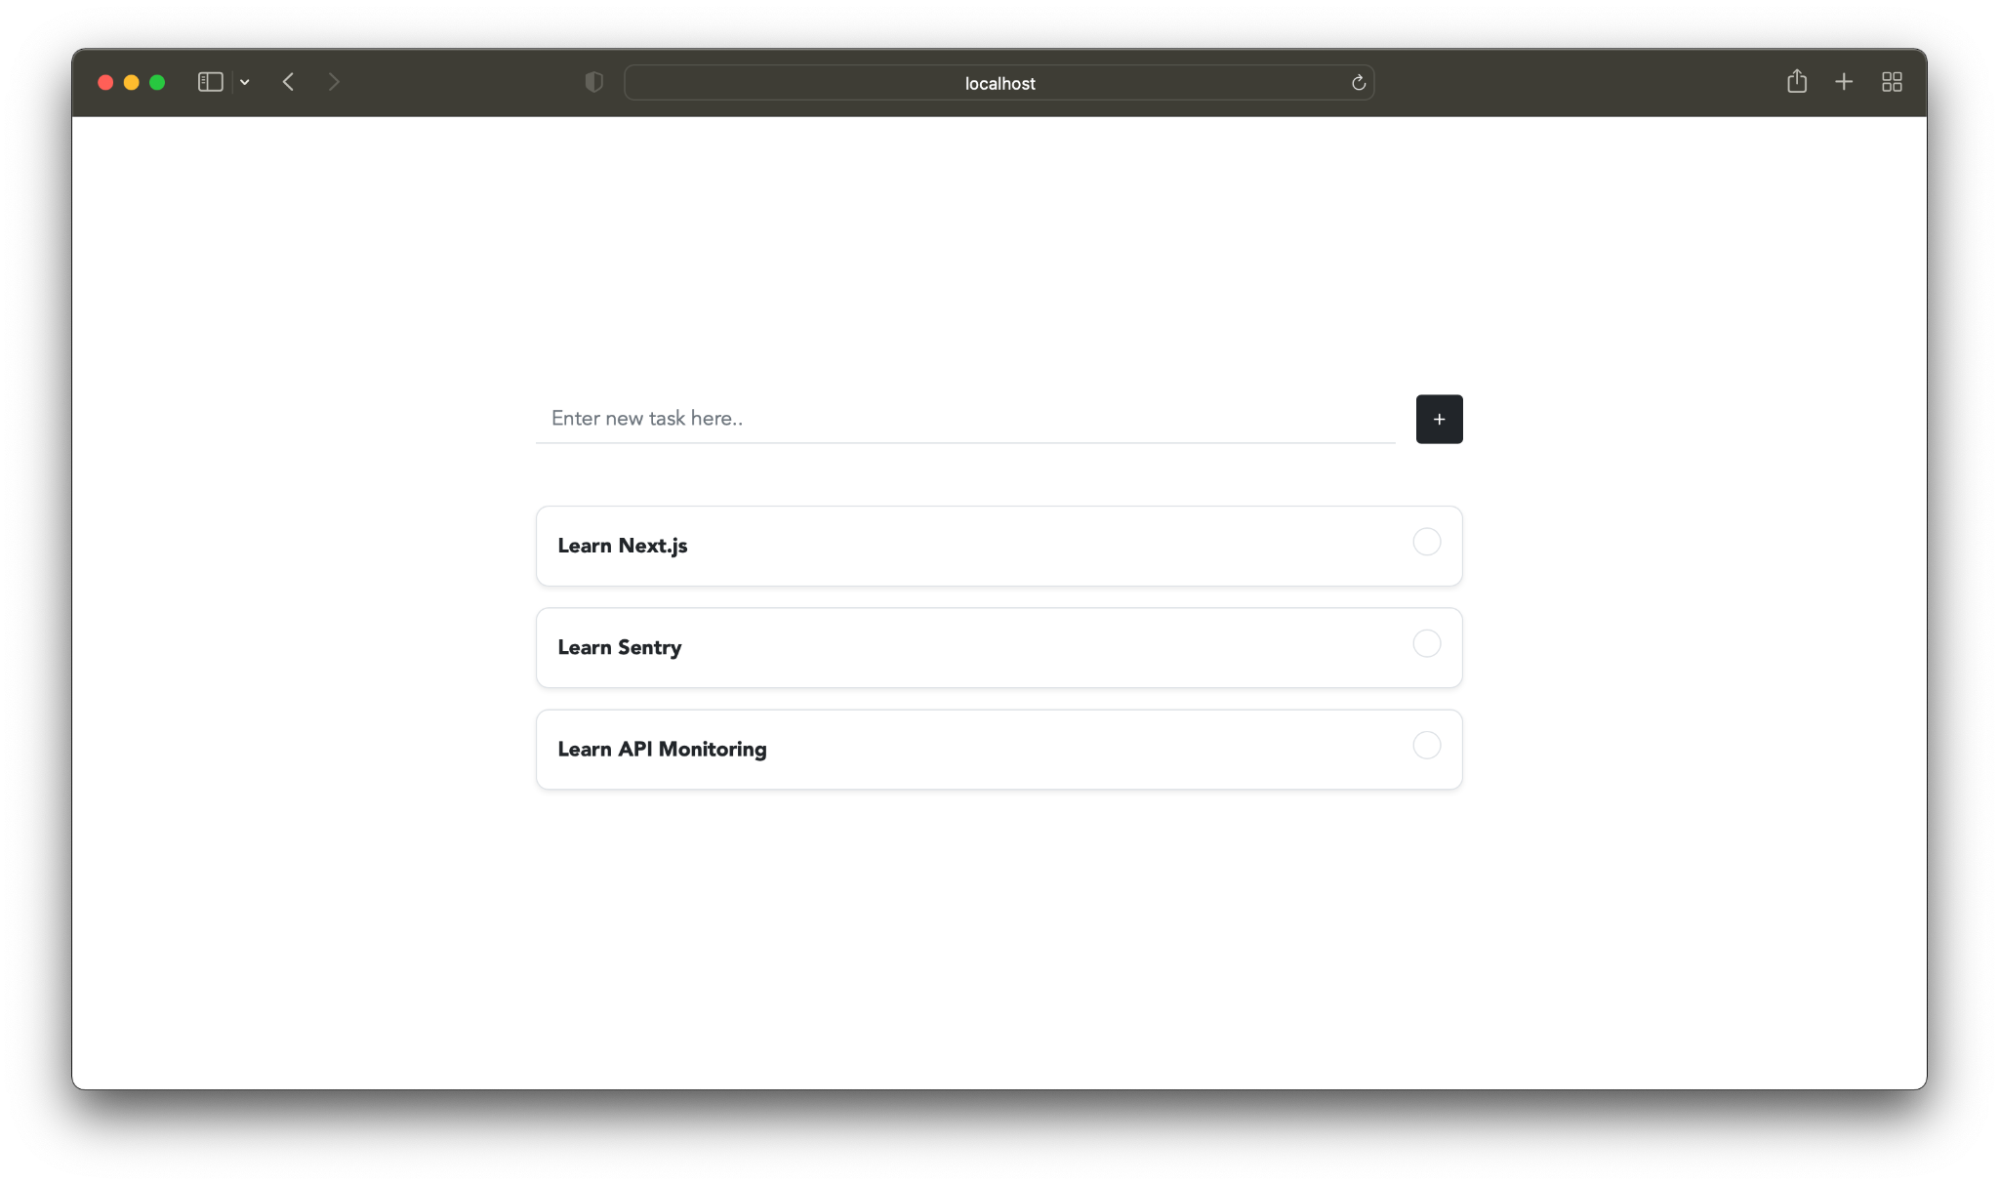
At this point, we’re done with configuring our application. If we run it in the browser, we’ll see it’s loaded with some default tasks, and we can also add new tasks or mark existing ones as completed successfully.
Monitoring Performance in Sentry’s Dashboard
Sentry's dashboard is equipped with many tools to make performance and error monitoring in your application an effective and seamless operation.
Let's say, for some reason, our fetch request to the /api/todo endpoint takes a couple of seconds to load than usual. Since we are currently fetching only three todos, which will be considerably fast, let's programmatically set a timeout that’ll only send our API response after 5 seconds to degrade performance and see how we can track this on sentry.
Modify the /pages/api/todos.js file and update its code to match the one below:
import { withSentry } from "@sentry/nextjs";

const handler = async (req, res) => {
  const todos = [
    { id: 1, title: "Learn Next.js", completed: false },
    { id: 2, title: "Learn Sentry", completed: false },
    { id: 3, title: "Learn API Monitoring", completed: false },
  ];
  setTimeout(() => {
    res.status(200).json(todos);
  }, 5000);
};

export default withSentry(handler);
The new change to this file is using the setTimeout() function to send our API response after 5 seconds (5000 milliseconds). And if we run our application on the browser, we should notice the changes (slowness in loading our todo).
Back in our Sentry dashboard, the transaction for where and when this defect occurred would have been recorded on the performance page. So, what's on this page?
The performance page visualizes and helps you quickly identify performance issues during your application runtime. It does this by keeping them in the form of transactions and events. Think of transactions as a single instance of an activity you want to track, like the page load sequence of a particular endpoint. And events could be considered as multiple instances of a transaction, i.e., the number of performance issues that had occurred on that endpoint.
In our case, the defect had happened in the index page (/) as marked in the picture above, and if we click this transaction, we can track all of the issues that had occurred in this endpoint.
On the transaction details page, the Overview tab shows us a breakdown of all transactions durations, web vitals, user misery, and many more; however, let's navigate to the All Events tab to simplify further what's on the screen and make tracking easier:
Events here are sorted in the timestamp order that they’ve been recorded by default (you can choose to sort in order of total duration taken by each event, trace id, user id, and many more; plus, you can also use the search bar for advanced searching options). The next step here is to click the first event in the row, and by doing this, we’ll get more information on how the whole event played out.
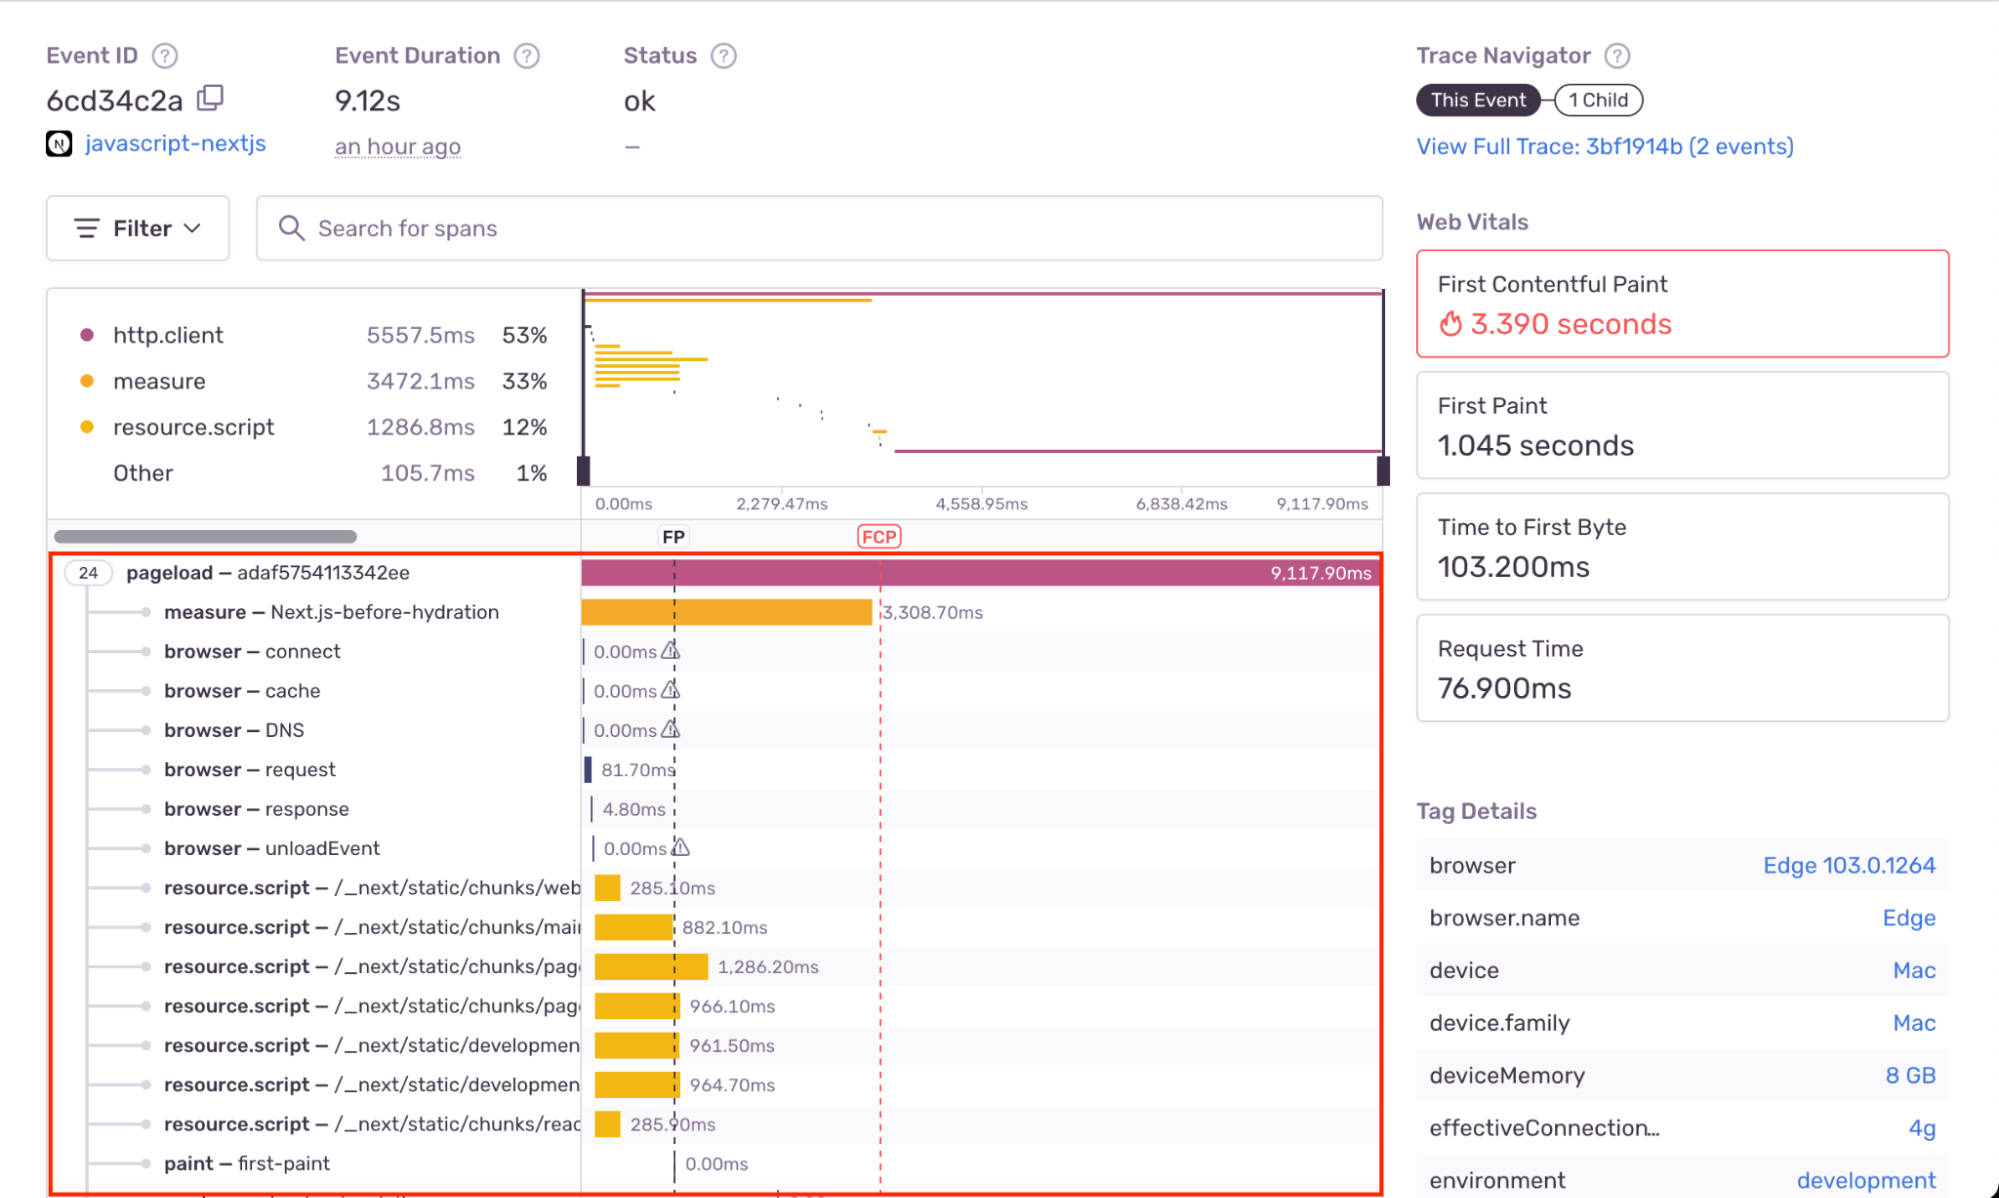
From this new page, we can see the process through which this application had loaded; we get crucial information such as the first contentful paint, request time, and the page load sequence. Also, in the pageload sequence, we can track how much time our application took to load each resource.
And if we scroll down a bit, we figure out that some GET /api/todos method is taking a whopping 5,557.5ms to load in our application. This way, we can revise this endpoint and fix it accordingly.
And voila, we were able to recreate a reasonably common performance issue and follow it on sentry to determine the source of the problem.
Conclusion
Monitoring performance is critical. It ensures the application can meet its intended use case and perform well at the expected level. This article looked at how to integrate Sentry into a Next.js application. We also examined a common performance flaw and how Sentry could assist in monitoring it.


