Performance Issues: Slow you can act on quick(ly)
Performance Issues: Slow you can act on quick(ly)
Not too long ago, our CTO, David Cramer, wrote a blog post about how we had deviated from our mission of making it easier for developers to monitor and solve issues in their code, soliciting community feedback to understand developers’ most pressing workflow issues and to bring us back on track.
After talking with developers about their workflow, we uncovered that the current application monitoring tools out there are not built for them. Those same developers wanted the workflow that Sentry provides for errors, but for performance. For example, when you go to Sentry to understand what’s behind an error, the stack trace and details on the Issues page generally give you enough detail to understand what you need to do to fix the problem. The issues feed also lets you quickly see the most important issues and then prioritize, assign, and triage them all in one place. Developers want that same level of detail, context, and actionability when analyzing performance problems. Most importantly, developers want to know, at a glance, what happened and what they need to do to make slow fast– or at least acceptable– and get the problem to the right developer to fix quickly.
That’s why, over the last few months, we’ve experimented and iterated (a few times) to finally bring the actionability that was once only reserved for errors to Performance with Performance Issues. Performance Issues, now available for early adopters, lets you see a performance problem and where it is in your code so you can triage, assign, and solve the issue faster.
What is Performance Issues?
Today, issues are no longer bound to errors. “Issues” is becoming a domain-agnostic platform that can support multiple kinds of regressions and this launch is a first step towards making that vision a reality.
Performance issues represent performance problems in applications. Just like regular issues, they capture and group unique problems together and provide actionable context to developers so they can solve those issues faster.
While there are many different possibilities and Performance Issue types, for this initial phase we decided to tackle a single issue before expanding. After much discussion and more feedback, we landed on a good candidate for the first performance issue type – N+1 database queries.
N+1 Queries: The most critical database problem to catch early
N+1 queries are one of the most common database problems that can easily go unseen (until the query overwhelms your database and in some cases takes down your application).
For developers using the Django Python framework, you are probably all too familiar with this issue. The Django framework provides a helpful Object-relational mapper (ORM), which allows you to write your queries in Python and then turn them into efficient SQL. Most of the time the ORM executes perfectly, but sometimes it does not - resulting in SQL queries running in a loop.
These queries include a single, initial query (the +1), and each row in the results from that query spawns another query (the N). These often happen when you have a parent-child relationship. You select all of the parent objects you want and then, when looping through them, another query is generated for each child.
We actually wrote a blog post about an N+1 query problem of our own that occured in our backend – the query executed 15 times and added an additional 380ms. We were able to catch it early (before it got out of hand) by using Sentry Performance.
But for most, this problem can be hard to detect at first, as your website could be performing fine. But as the number of parent objects grows, the number of queries increases too…until your database collapses.
That’s why detecting these types of problems early is critical to maintaining stability.
How detection works
Each incoming indexed transaction event is run through a “performance detector” where we check the quantity of “db” spans and their cumulative duration. If both count and duration exceed the threshold, then the detector outputs all found performance problems with their corresponding fingerprints. A performance fingerprint uses data from the problematic spans that were detected; specifically the span class, a span operation, and parsed description.
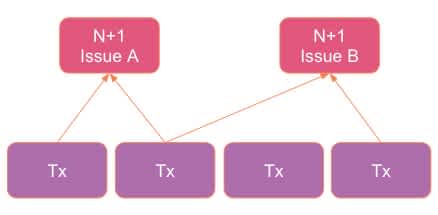
After the detection step, the output is used to either create a new performance issue or to update an existing one. It’s important to note that a single Performance Issue can capture a problem that occurs across multiple transactions.
This is representative of the nature of performance problems where they have the same root cause but can affect different parts of the application.
Performance Issues is different from Error Issues (for now)
While there are obvious differences between the two (e.g. Performance Issues is backed by transaction events while Error Issues are based on error events), there are a few others that are more apparent in the UI - like with the Issue Details page.
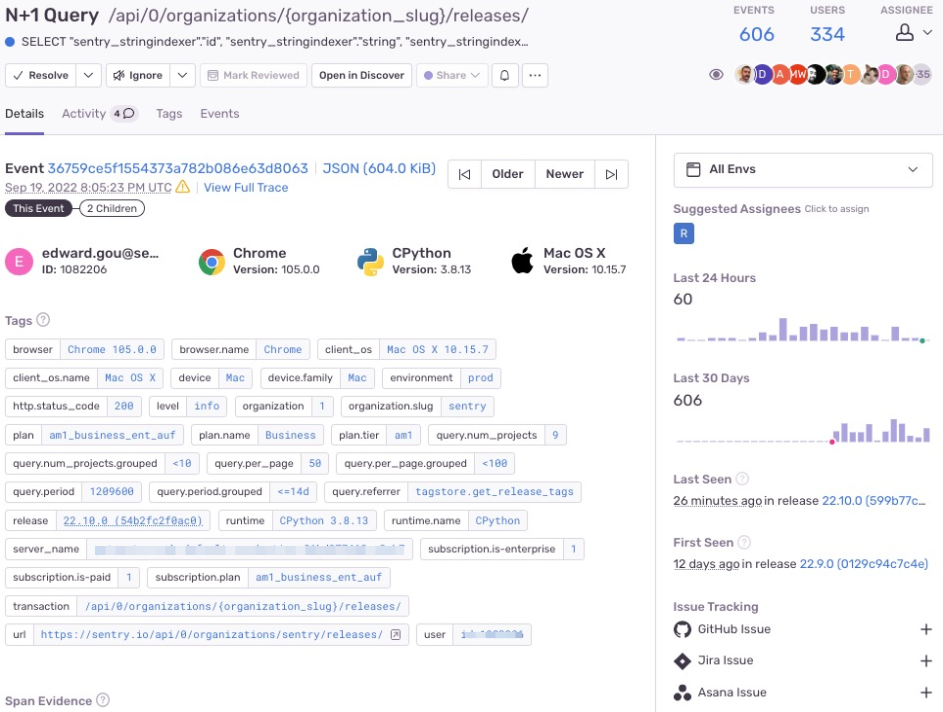
For Performance Issues, a stack trace is replaced with a condensed span tree in the Issue Details page. There is also a new section for the span evidence that is meant to supplement users with more context as to where the performance issue occurred.
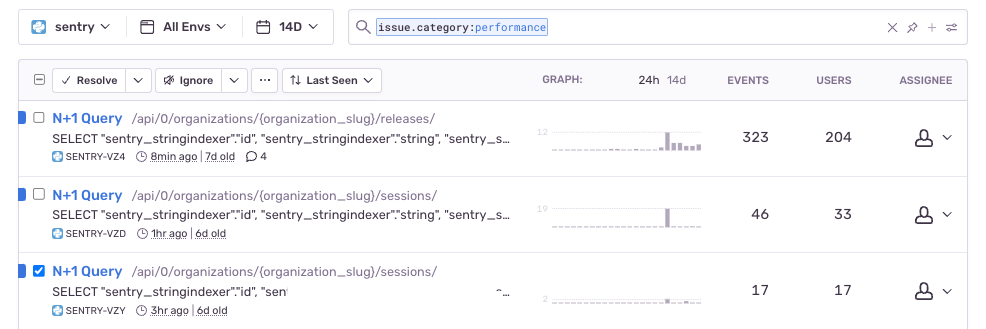
Similarly to an Error Issue though, Performance Issues can be assigned, ignored, resolved, and searched for in the issues feed. You can also filter and prioritize by event count or number of users impacted.
Plus, Performance Issues works with the issue tracking tools like Github, Jira, and Asana, so you can create or link an issue directly from Sentry – allowing everyone to stay on top of the issue status.
There is additional functionality we’re still building to ensure feature parity with Errors before we remove that beta tag.
Getting started with Performance Issues
Performance Issues is now available to all early adopters. If you want to try it out, head to settings and toggle the early adopter switch.
Once in, issues are displayed in the issues feed just like regular issues. You can also search for them by applying an issue.category:performance filter in the issues feed.
If you want to dive deeper into the affected events, searching in Discover by issue:{short_id} will work too.
As we add more detectors to surface more Performance Issues, we want to make sure we’re continuing to build the right things that make developers’ lives easier when building and shipping software. To do this, we need your feedback. Reach out in Discord, Github, or even email us directly at performance@sentry.io to share your experience.
And if you’re new to Sentry, you can try it for free today or request a demo to get started.


