
← Back to Blog Home


Monitoring the Monitor
At Sentry we aim to make crash reporting pleasant. For us, that means you don’t need to dig into sparse logs to determine what’s going on. The entire the reason the project exists is because that problem had gone unsolved, and we had experienced how painful it was. Unfortunately this leads us back into the hole ourselves, as the battle with recursion means we can’t always rely on Sentry to monitor Sentry. Our problems are also a bit more complex than most SaaS services since we ship an On-Premise solution as well. This means we need to support error monitoring in a way that carries over. So what do we do?
Application vs System
Looking at monitoring in Sentry, and nearly every other product will lead you down two paths that vary greatly: metrics exposed via the system (e.g. Nginx) vs reports from the application (your code). In a lot of cases you’ll see only minor overlap in tooling. Usually both pieces have plaintext logs, and both will record basic time-series metrics. Beyond that, you’ll find a lot of things that might only exist on one side of the table, but generally could be useful for both perspectives. Sentry is actually a prime example of that, where you might want to report on exceptions (or simple errors) from system processes, but due to the fact that we instrument things at an application level you likely aren’t.
On the system level, both on-premise and for Sentry, we gain the benefit of being able to rely on a lot of external tooling. For our SaaS service we’re a bit limited due to compliance, but we’re still able to take advantage of some things like Datadog for metrics and PagerDuty for alerting. The application level however is where things end up varying greatly. We try as much as possible to capture Sentry errors inside of Sentry, but we’re still left with system logs in a lot of cases. Additionally there’s no great standardized way do to service monitoring or health checks, and because they’re so critical we end up having to (at least partially) build them ourselves.
Metrics
When we look at the Sentry product, we try to bridge the gaps between system and application. Sentry aims to provide a general bill of health for itself when possible, though it’s not without its challenges. We capture a lot of system metrics (graphs) and store them in our internal TSDB (sentry.tsdb). This means we’re locked in to the limitations of our internal implementation so we also expose those same metrics to external services, which is not only useful, but required for availability. It gives the nice benefit that our On-Premise users can forward service metrics to their own monitoring tools (we support both Datadog and the Statsd protocol out of the box).
Graphing however, is only one part of metrics, and arguably its the least important part. What we really care about is being alerted when something is wrong. At writing we don’t have much in the way of doing this internally to Sentry, so we end up relying purely on external services. In our case those vary depending on the job. We run a mix of Datadog, PagerDuty, Pingdom, and even sprinkle a little bit of New Relic in there (for uptime checks). At the end of the day it solves the problem fairly well, and because these are widely successful products, it also means that most of our On-Premise users already rely on them.
Logs
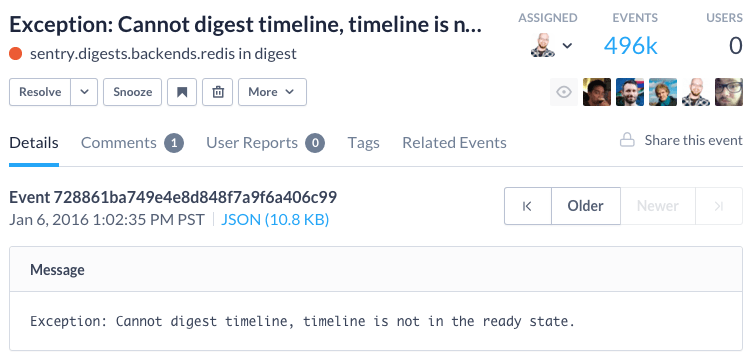
Logs are still the weak point of the picture. Internally we have a combination of things to solve this, including both a Logstash service as well as an rsyslog-to-S3 pipe to ensure audibility. Previously we used Papertrail, which is great for getting off the ground, though we had to move away for compliance reasons. The log aggregation and storage helps us on one side of the picture, though it doesn’t mean we ever look at them without warrant. One of the primary reasons Sentry was built in the first place was to improve visibility into errors, but we don’t get that same behavior out of our standard logging.
We try very hard to ensure Sentry errors actually log to Sentry, though you end up with an equivalent to asynchronous recursion if you’re not too careful. That means we have to err on the side of not sending certain things to Sentry. Due to that, we end up relying on various system metrics to monitor for increased rates of errors, or other higher level health checks. If upon an investigation of Sentry nothing indicates elevated error rates, we then go down the path of digging into the logs themselves.
On-premise ends up even worse here, as you’re stuck with dealing with arbitrary log configurations. We haven’t yet approached solving this, but our thinking right now is pushing towards a unified logging structure and enabling the ability to easily ship container logs back upstream. We could even go as far as allowing On-Premise installs to submit Sentry errors back upstream. The primary issues you see here are centered around the sensitive nature of the data, which is usually why it’s run behind the firewall in the first place.
Uptime
Looking from the top down, uptime is one of the few major concerns we have, with the other being data integrity. This is why we run a number of services purely dedicated to testing and ensuring the health of Sentry. Externally that includes our standard metrics, but more importantly it focuses on external validation from New Relic and Pingdom. This is required as internal validation can’t guarantee network availability, and services like Pingdom are designed entirely around geographically distributed validation.
Internally we also expose health checks in Sentry, though on sentry.io they’re exposed in a different manner for privacy and security reasons. With these we’re able to additionally wire them up to services like Pingdom, which not only ensures that Sentry is online, but that anything we’ve determined to be important can affect the “online” status. Right now we’ve limited what these do, but they’ve already proven useful in helping on-premise users know when certain required services aren’t running correctly.
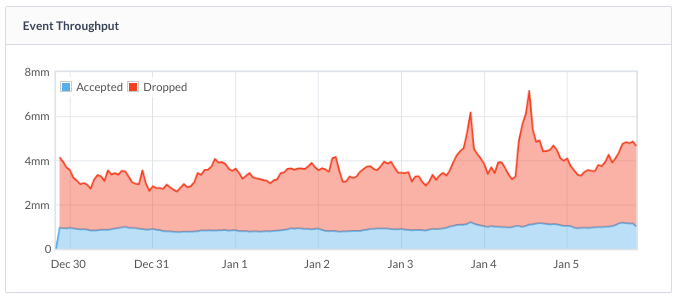
Externally we also expose several metrics to our customers, using the fantastic StatusPage.io. We capture external uptime (via Pingdom) as well as important internal metrics like the average time for an event to go through our processing pipeline. You can take a look at status.sentry.io to get a better visual. While this is only catering to our hosted service, the metrics can all be represented within on-premise installs.
Settling Up
There’s a lot of great tooling in the monitoring space, with Sentry focused just on part of it. Through the history of the company we’ve explored and used a lot: Scout, Librato, Datadog, Papertrail, PagerDuty.
We’re still actively improving our tooling in most areas. Our end goal is for Sentry to be a self-contained, self-monitored system, but with the ability to always pipe those important bits of data to other services. This ensures that we’re both flexible enough for existing infrastructure as well as capable of understanding and maintaining the Sentry installs with the thousands of customers who run us behind their firewall.
Ultimately, whether you want to debug JavaScript, do Python error tracking, or handle an obscure PHP exception, we’ll be working hard to provide the best possible experience for you and your team!

