Measuring application performance in Swift using transactions
Measuring application performance in Swift using transactions
So you're building a mobile app that’s performing big data requests; or crunching big data. But now you're asking yourself:
How will my app perform in production?
How will it perform on a lower-tier phone?
Is there a scenario where the function's execution time is unbearably long?
With Sentry’s Custom Instrumentation you can keep an eye on those big data-handling functions. Let’s see how you can implement them in your Storyboard and SwiftUI projects.
Requirements
First, you need to setup performance monitoring. With application performance monitoring, Sentry tracks application performance, measures metrics like throughput and latency, and displays the impact of errors across multiple services.
To get your app setup with mobile performance monitoring, you need to configure the traces sample rate in your Swift.UI.App file's init() method:
import Sentry
// This should be in your SwiftUI.App file's init() method
SentrySDK.start { options in
options.dsn = "[YOUR_DSN_HERE]"
// Example uniform sample rate: capture 100% of transactions
// In Production you will probably want a smaller number such as 0.5 for 50%
options.tracesSampleRate = 1.0
// OR if you prefer, determine traces sample rate based on the
// sampling context
options.tracesSampler = { context in
// Don't miss any transactions for VIP users
if context?["vip"] as? Bool == true {
return 1.0
} else {
return 0.25 // 25% for everything else
}
}
}Implementing custom transactions
Now that you’ve got performance monitoring enabled, you can start setting up custom transactions in the functions you’d like to measure. The measurement starts when you start a new transaction:
// don't forget to import Sentry's SDK at the top
import Sentry

// ...

func syncPersonDatabase() {
  let transaction = SentrySDK.startTransaction(
    // Give the transaction a descriptive name
    name: "transaction-name",

    // Give the operation a descriptive name
    operation: "transaction-operation"
  )

  // ...
  // perform the operation
  // ...
}
For example, let’s say you want to measure how long it takes to sync a database of all people within a company; the “person database”. The name and operation could be "Sync person database" and "data.update" respectfully.
When you’re done with the operation you want to measure, you can call the finish() method of the transaction. Finishing the transaction will stop the measurement and send it to your Sentry project.
The final structure of your function should look like this:
// don't forget to import Sentry's SDK at the top
import Sentry

// ...

func syncPersonDatabase() {
	let transaction = SentrySDK.startTransaction(
	  name: "Sync person database", // give it a name
	  operation: "data.update" // and a name for the operation
	)

	// ...
	// perform the operation
	// ...

	transaction.finish() // stop the measurement and report it to Sentry
}
Monitoring the performance
So far you’ve set up the performance measuring mechanism of your syncPersonDatabase function. Now you run your app...
You run it again...
Maybe you run it one more time for good measure...
Okay, that should have kicked off a transaction. You visit your Sentry dashboard and open the Performance tab and see the new custom transaction appear at the bottom:
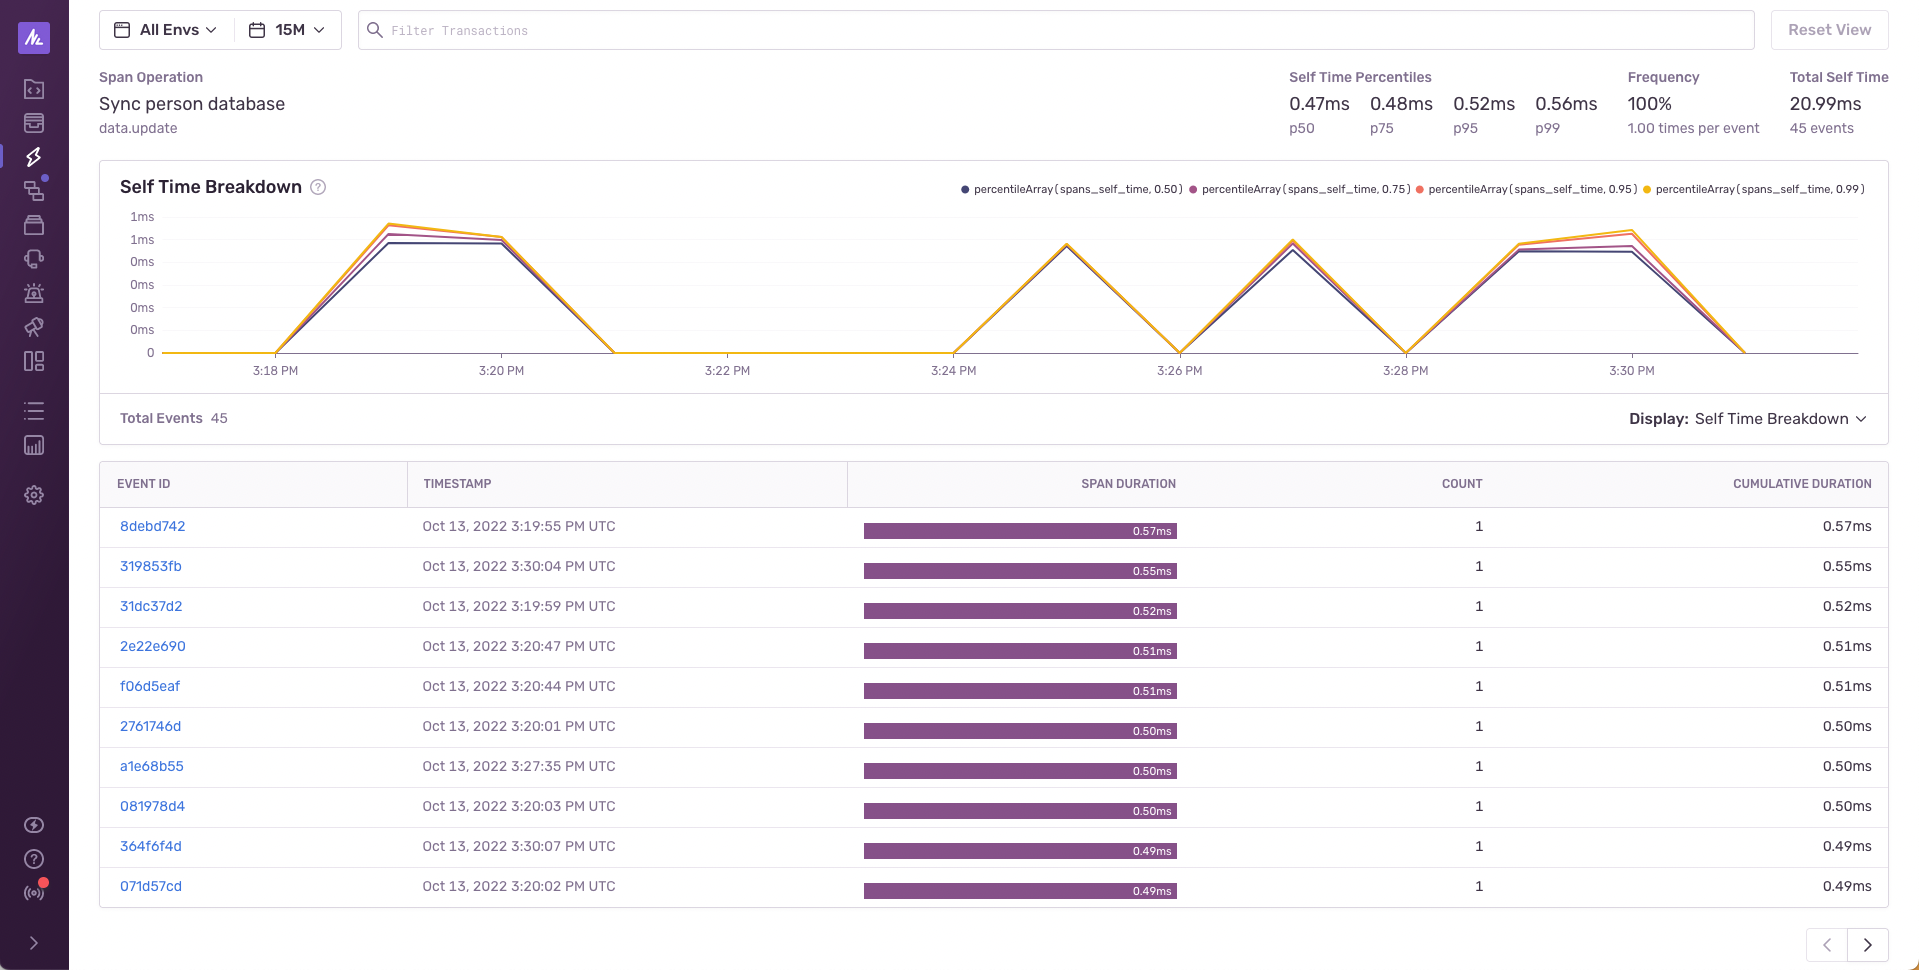
Clicking on the transaction and then into the “Suspect Span” found in the second table, you will see a detailed representation of the span operation:
Let's break this view down a bit.
The first thing that you’ll see is the Self Time Breakdown chart.
This chart visualises the p50, p75, p95 and p99 metrics, which are called “latency percentiles”. p50 means that 50% of the function executions are faster than the p50 value (let’s say 0.47ms). To learn more about the latency percentiles, check out the Latency section in the Metrics documentation.
In the top right corner you can see the Self Time Percentiles widgets.
If you don’t want to look at the chart, these values will give you an insight on the average “p” values.
Below the chart is the events table.
Here if you notice an event that took longer than you anticipated, you can click on it to get more details about it, like:
The device that the user was using when the transaction occurred
The device’s memory at the time of the transaction
How long the user had been using the app prior to the transaction
The version of the app
The breadcrumbs (bits of events and interactions that led up to that transaction)
This gives you enough information on the context and environment to be able to discover potential ways to refactor the function to improve its performance. And, you can get even more granular if your function has multiple steps of execution. You can measure each steps individually and still keep them under the umbrella of the main function transaction.
Enter: child spans
More granular measurement with child spans
Child spans are like mini transactions that are attached to the main transaction. And child spans can have their own child spans as well. This feature allows you to measure your function’s performance in a greater detail, by starting a child span for every step of the function.
Let’s say your function performs the following steps:
1. Gather changed person properties
2. Pass each of them through a validation mechanism
3. Perform the updates to the database
4. Save the current timestamp as the "lastUpdated"
You can measure each step individually using child spans like this:
// don't forget to import Sentry's SDK at the top
import Sentry

// ...

func syncPersonDatabase() {
	let transaction = SentrySDK.startTransaction(
	  name: "Sync person database", // give it a name
	  operation: "data.update" // and a name for the operation
	)

	// span the first child
	let gatherSpan = transaction.startChild(operation: "gather-changed")
	// perform the gather operation
	gatherSpan.finish()

	// span the second child
	let validationSpan = transaction.startChild(operation: "validate-changed")
	// perform the validation
	validationSpan.finish()

	// span the third child
	let updateSpan = transaction.startChild(operation: "update-database")
	// perform the update
	updateSpan.finish()

	// span the last child
	let timestampSpan = transaction.startChild(operation: "update-timestamp")
	// perform the timestamp update
	timestampSpan.finish()

	transaction.finish()
}
Remember: Only finished spans will be sent along with the transaction. So you need to make sure that you’re finishing each child span before finishing the main transaction.
Monitoring the performance of child spans
Alright, you have set up child spans and you're ready to run your app again with the latest changes...
You run it again...
Maybe you run it one more time for good measure...
Done! You head back to your Sentry dashboard and notice that the Suspect Spans table provides more information now. You can see the child spans, and how long they took to execute.
Clicking on the “View All Spans” button you can see and sort all of them.
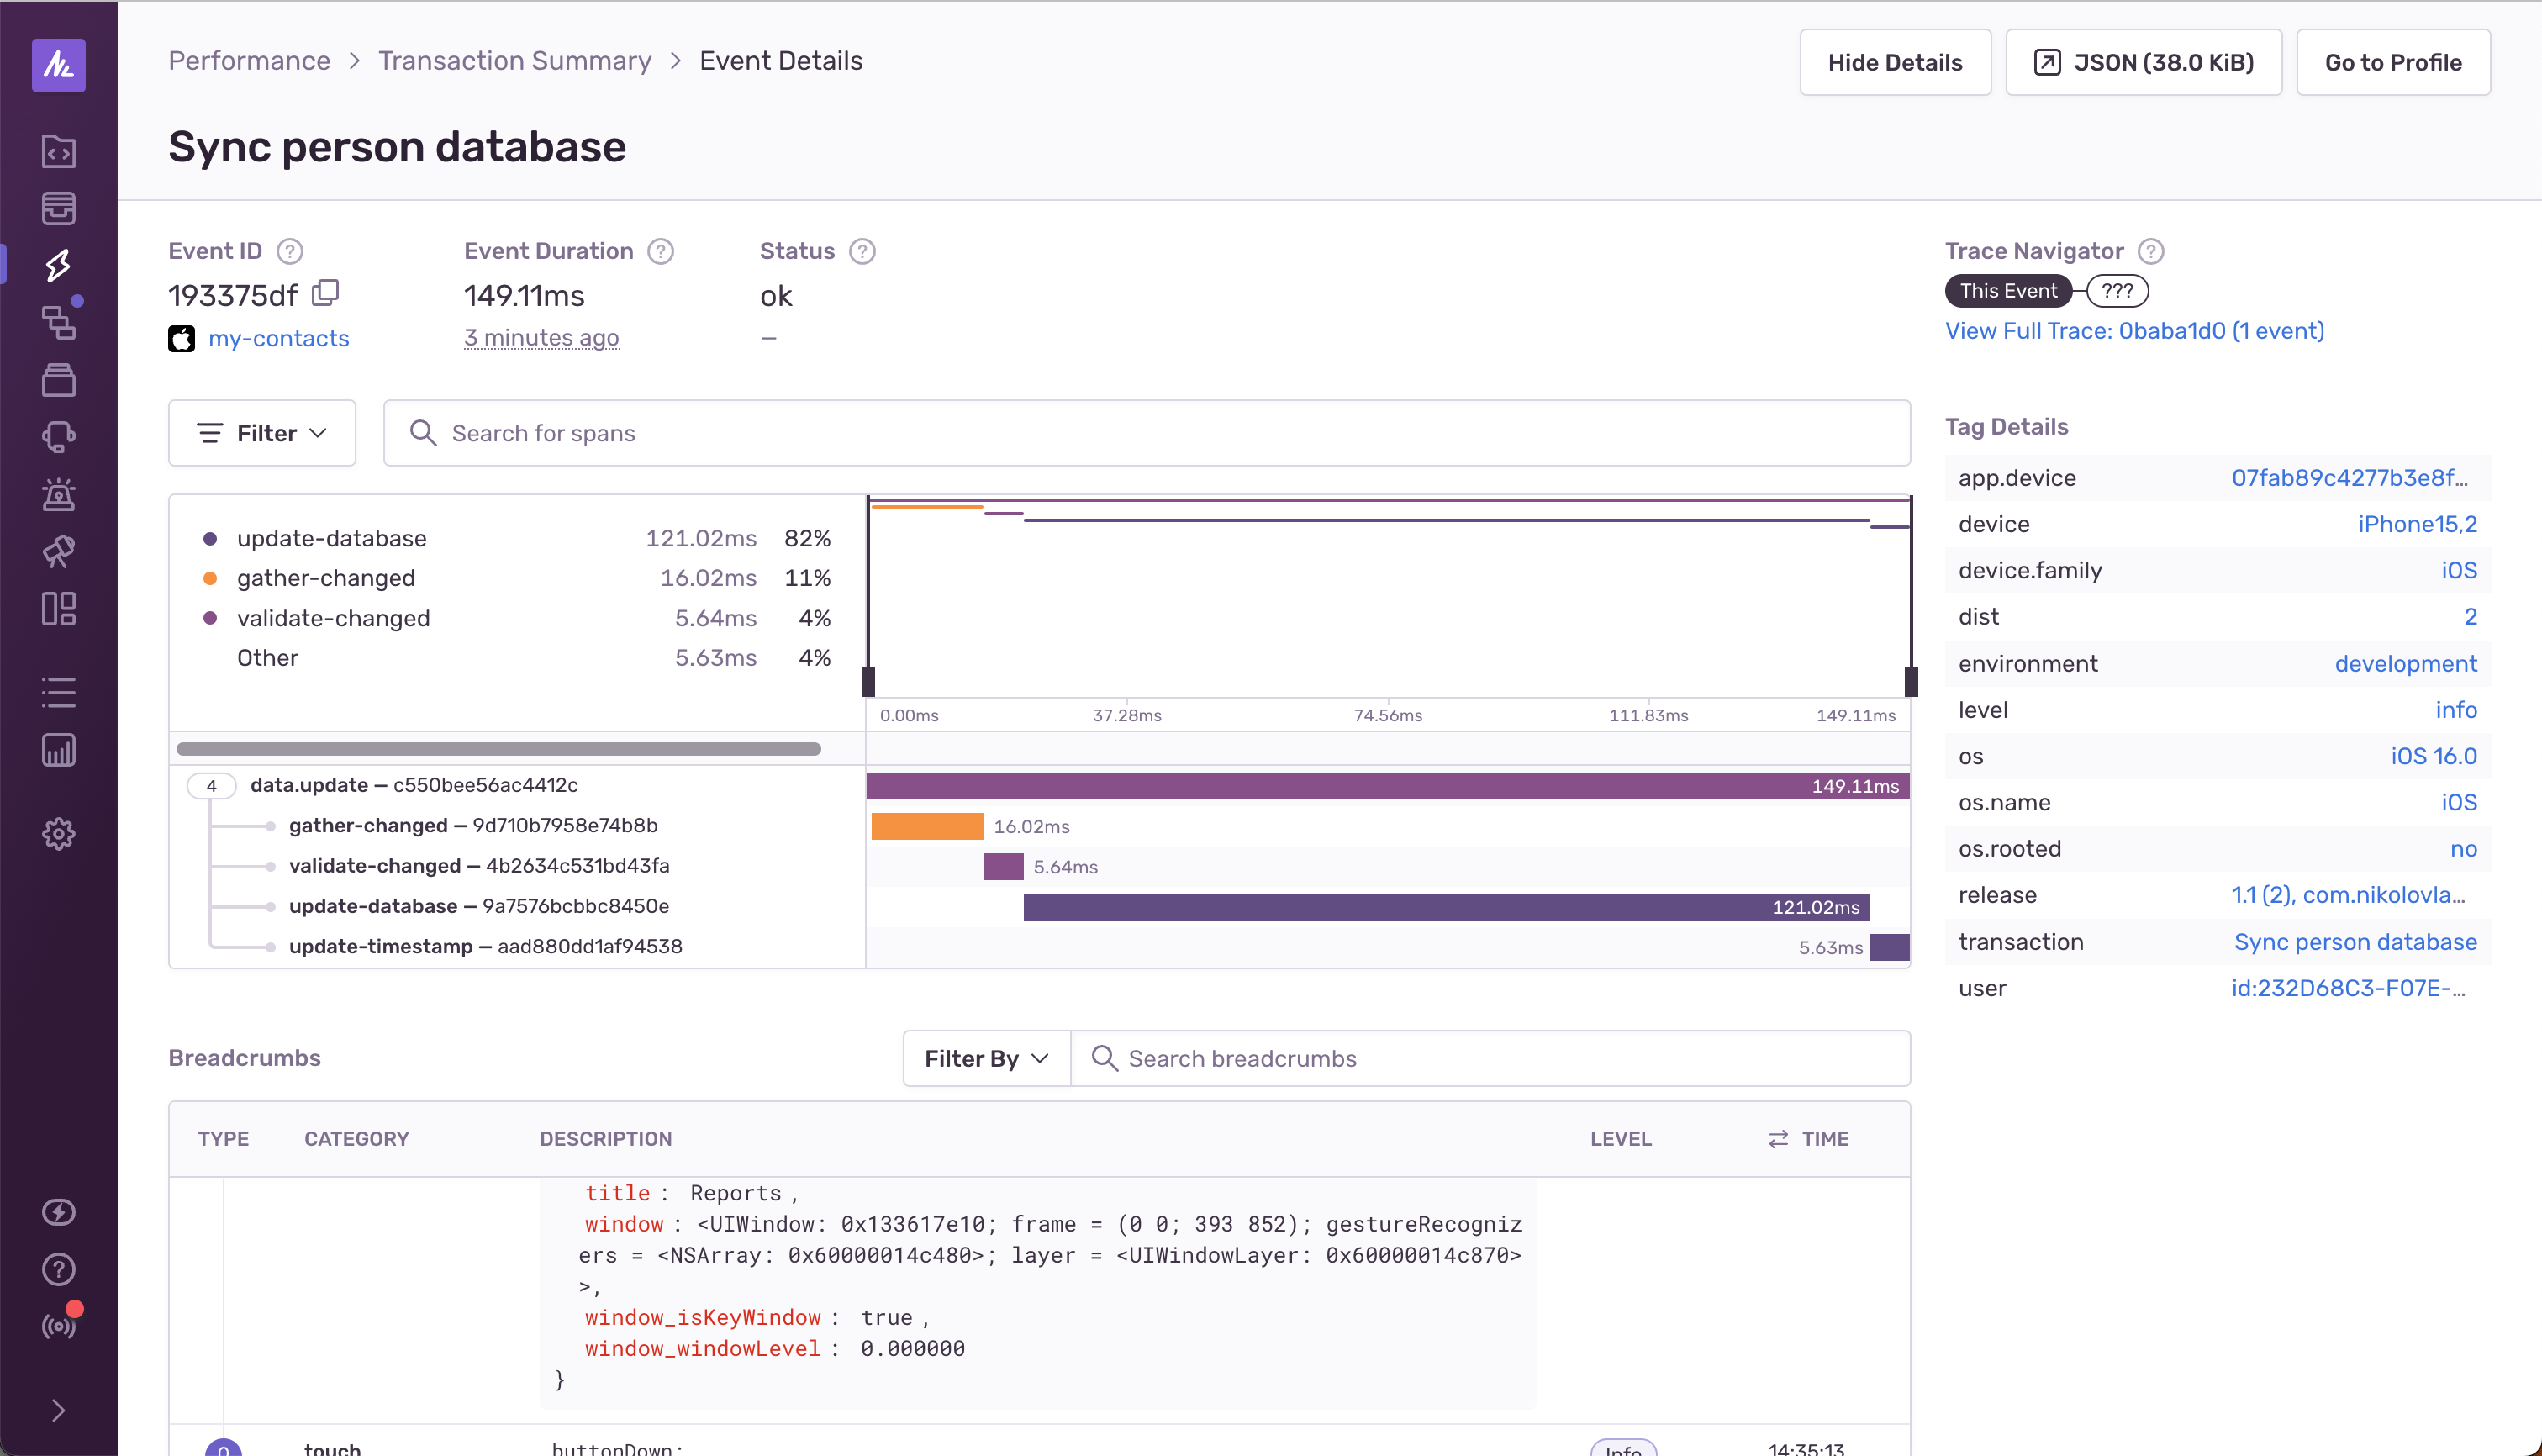
But you realize that your function has conditional steps that don’t always execute. Or maybe you have dynamically generated child spans whose name contains a unique id. To see the actual order of the child spans, you have to pick a specific event from the Events Table above and a new page will open with more details around that specific event.
You can see from the Gantt chart the order of execution of the child spans.
Here you can see that:
The
data.updateencapsulates all child spansThe
gather-changedstarted executing first and took 16.02msThen the
validate-changedran for 5.64msThen the
update-databasetook its 121.02ms to runAnd finally the
update-timestampflashed for 5.63ms.
You can identify which step contributes the most to the performance of your function with this. You can now turn our whole focus to improving the performance of your update-database function.
Using a transaction in multiple functions
Now that you have a hang of measuring straightforward functions, you're ready to tackle something a bit more complex. You realize that you want to measure performance on multiple nested functions. You do not need to pass the transaction as an argument. Instead, you can bind the transaction to the current scope:
let transaction = SentrySDK.startTransaction(
  name: "Sync person database", // give it a name
  operation: "data.update", // and a name for the operation
  bindToScope: true // bind the transaction to the curent scope
)
Now you can access this transaction without having to pass it as an argument while you're in the current scope. You could have a function gatherChangedProperties, that calls another function filterProperties. And to gain access to the transaction within the filterProperties, you can directly reference SentrySDK.span, and if no transaction exists yet, you can create it. Your structure should look something like this:
let transaction = SentrySDK.startTransaction(
  name: "Sync person database", // give it a name
  operation: "data.update", // and a name for the operation
  bindToScope: true // bind the transaction to the curent scope
)

let properties = gatherChangedProperties()

// ...

transaction.finish()

func gatherChangedProperties() {
  // ...
  let filteredProperties = filterProperties();
  // ...
}

func filterProperties() {
  // obtain the transaction
  var span = SentrySDK.span

  // if non existing, recreate it
  if span == nil {
    span = SentrySDK.startTransaction(...)
  }

  // use it like a normal transaction
  let filterSpan = span.startChild(operation: "filter-properties")

  //...
}
Recap
You can now create custom transactions to measure long running functions in your app with
SentrySDK.startTransaction(...).You can measure more granularly by starting child spans to our transaction for each logical step in our function with
transaction.startChild(...)to zero in on the slowest part of the function and improve it.If you’re measuring a more complex function with multiple branches, you can bind the transaction to the current scope by setting the
bindToScopeproperty totrue.
Time to measure all the things! 🙌


