Making Performance Monitoring More Actionable with Sentry
Making Performance Monitoring More Actionable with Sentry
How your code performs isn’t a subjective debate. Well, at least not anymore — in the past few months, Sentry has started telling you exactly what’s slow and where to fix it — specifically, N+1 database queries in your code.
While we’ve all had to fix an N+1 problem, performance problems come in multiple flavors. Today, you’ll notice more Performance Issues in your issue feed, Slack alerts, and email notifications.
To save you time from digging through dashboards and metrics, Sentry brings the workflow of errors and exceptions to application performance monitoring. Sentry automatically detects and groups common performance problems with your code, letting you address the exact issue causing an application slowdown or latency issue.
You can now be notified and take action on new frontend, backend, and mobile performance issues:
Frontend
Backend
Mobile
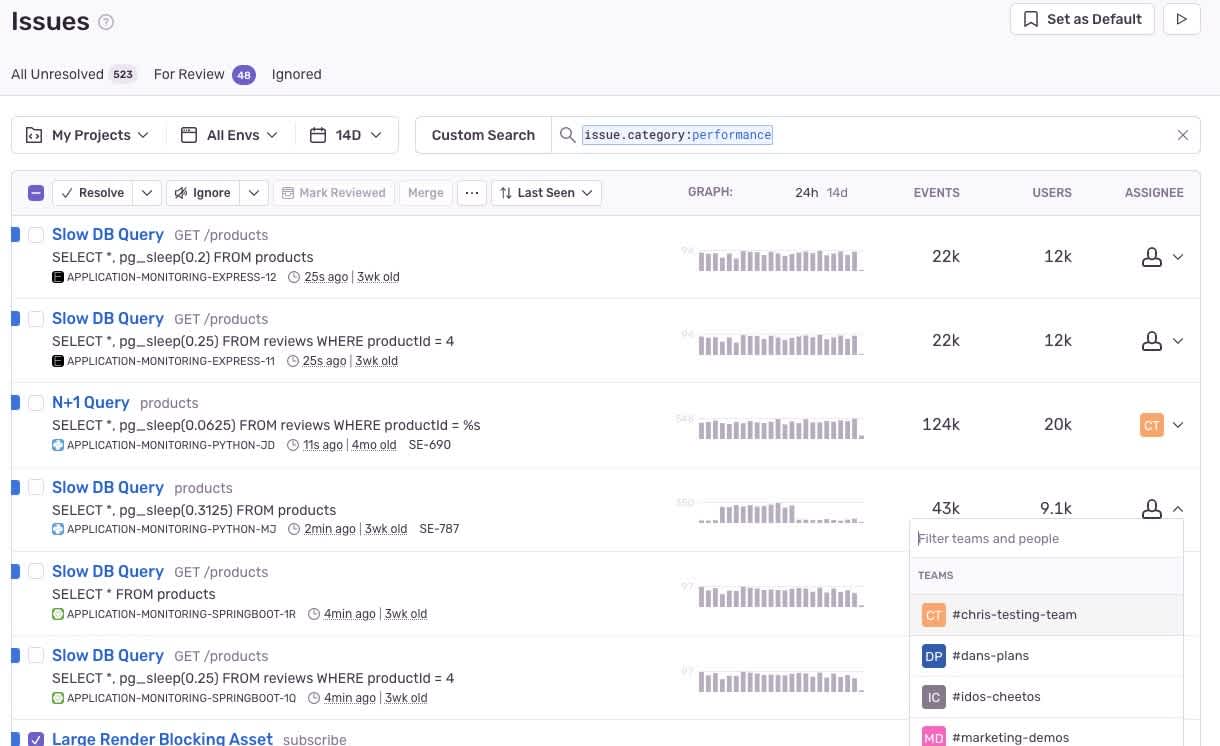
Get started with Performance Issues — just filter by issue.category:performance to see all of your performance issues. You can also read more in-depth about each of our performance issue types here.
issue.category:performance to see all of your performance issues. You can also read more in-depth about each of our performance issue types here.Frontend Performance Issues
As a frontend developer, keeping an eye on your web vitals and an ear on customer feedback is essential to maintaining a high-quality experience for your users. Performance issues, if left untreated, can cause slow page loads, stuttering scrolls, or other UX problems that cause users to click away from your website in frustration.
With other APM tools, developers typically have to manually search for these issues - unless they’re already so bad that they’ve caused an outage — by diving into dashboards and sifting through logs, traces, and metrics.
For customers like Tilled, the actionable context from Sentry’s performance monitoring offering has been key to saving time for his team of developers. After setting up Sentry Performance and beginning to send transactions, Till’s SRE Lead Butch Mayhew automatically began seeing performance issues, reducing the effort needed to dig into different data sources to identify the culprits behind slow page loads and slow-responding API endpoints.
We have one engineer dedicated to Sentry in any given week; without the context we get into performance issues, we’d likely have to dedicate more engineering resources to maintain the high level of application performance our users are accustomed to.
— Butch Mayhew, Tilled
Sentry now auto-detects the following frontend performance issues for all frontend web SDKs, so you don’t have to hunt for them:
N+1 API Call
Detects similar repeating API calls that could be batched.
An N+1 API Call often happens when your UI code makes a lot of concurrent requests for the same kind of resource, i.e. every list in an item making an API call to render itself.
Batching these requests and making a bulk API call is important for good app performance, as each extra request creates overhead for both the client and server. N+1 API call issues can be quite common — it’s easy to add data loading logic to a component without realizing it’s rendered in a list, especially if components are worked on in isolation and haven’t been integration tested).
Uncompressed Asset
Detects issues with the server or infrastructure configuration which results in missing compression on frontend text assets, like CSS and Javascript files.
If a large file (500kb+) that needs to be downloaded in order to load a browser page takes a non-trivial amount of time to transfer (500ms+) or doesn’t get compressed while being transferred, this may indicate a misconfiguration of the server or CDN (content delivery network) that’s serving the asset file.
Optimizing an uncompressed asset will help improve your page load speeds, especially for users with a slower connection (e.g. on mobile).
Large Render-Blocking Asset
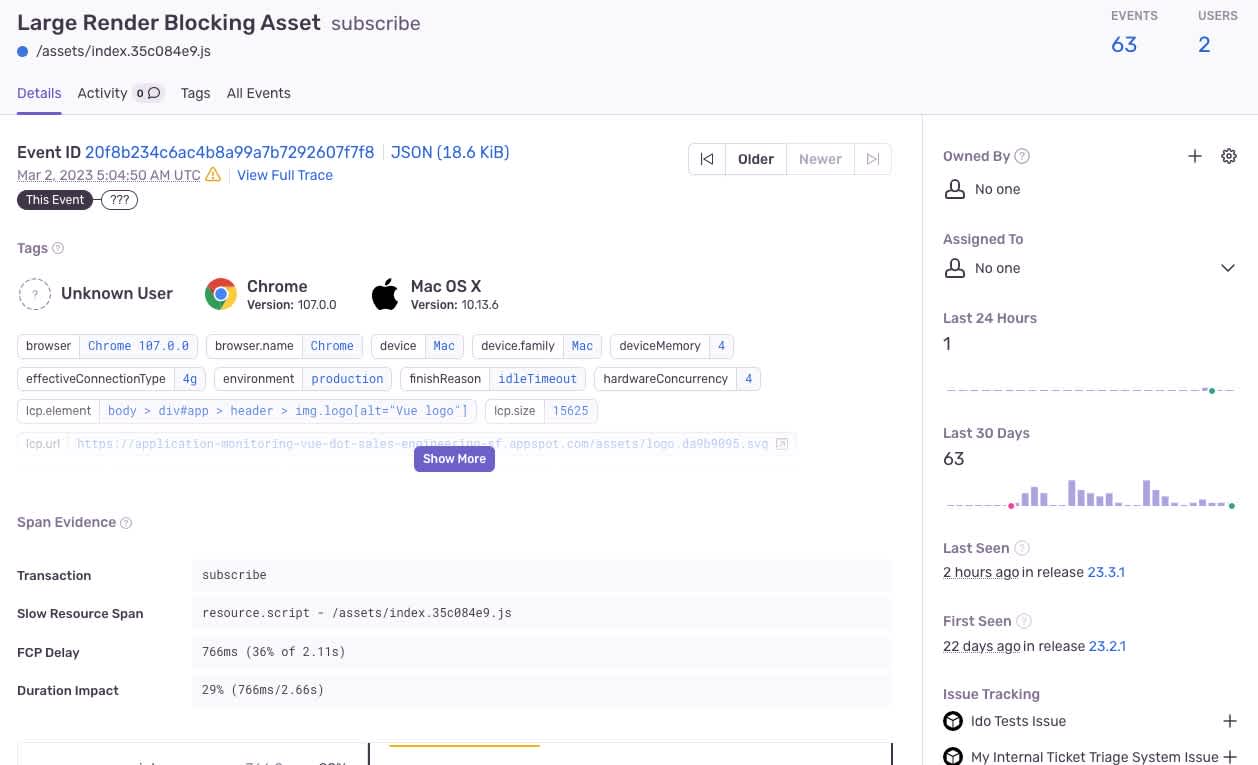
Detects large resource spans that take a long time to download and block initial page rendering, as well as enormous network payloads.
A large render-blocking asset is a JavaScript file or CSS that must be fully downloaded and processed before a webpage’s rendering can proceed — and due to its large size, blocks the page rendering and performance. This results in a blank or incomplete screen for the user before the content all properly loads. Adding new dependencies to your Javascript or even changing your webpack settings can accidentally result in large render-blocking assets.
Sentry now highlights the long resource spans that are affecting page rendering and interactivity, as measured by the First Contentful Paint (FCP) and First Input Delay (FID) of your requests. These web vitals indicate whether your page load is successful and help you track user retention on your webpage. Large Render-Blocking Asset issues are grouped by the asset URL and accommodate for various methods of cache busting or asset splitting.
Backend Performance Issues
With slow response time comes higher resource consumption and database overhead, and in turn, poor user experience — making it vital to catch these performance degradations.
At Buttondown, founder & CTO Justin Duke has been a long-time user of Sentry for its issue-reporting capabilities for errors and exceptions — and when he instrumented Sentry performance monitoring, he was surprised to see how similar the experience was to errors. Justin was able to speed up his onboarding-sensitive routes, plus the speed of his email rendering and sends — all from the way Sentry surfaced N+1 DB Query issues and slow DB operations in-product that he could quickly triage and resolve.
That skepticism vanished once I started understanding what specifically Sentry was offering: a legibility layer for performance. These were not abstract line graphs that offered more open questions (“is this a degradation, or is this table just getting bigger?”) than answers. They were discrete and solvable issues.
— Justin Duke, Buttondown
To quickly identify and address slow queries, we’re detecting and bringing to your feed these additional backend performance issues:
Consecutive Database Query
Detects database requests that occur consecutively but could be parallelized.
Consecutive database queries are a sequence of database spans where one or more are parallelizable— i.e. spans can be shifted to the start of the sequence. This often occurs when a database query performs no filtering on the data, such as a query without a WHERE clause.
The example below shows how a single query could have been done in parallel. The user performs multiple DB queries with WHERE clauses; in the middle, there is a query for the entire role table.
Catching and fixing these queries can reduce the execution time of your application.
Sentry currently detects consecutive DB queries for users with SQL databases. This may be particularly relevant if you work in a language or framework with async code execution like Node.JS, Ruby, C#, as it is will be easier to find ways to run queries concurrently or in parallel.
MN+1 Database Query
An improvement on the N+1 query, this detects a set of queries that repeats themselves.
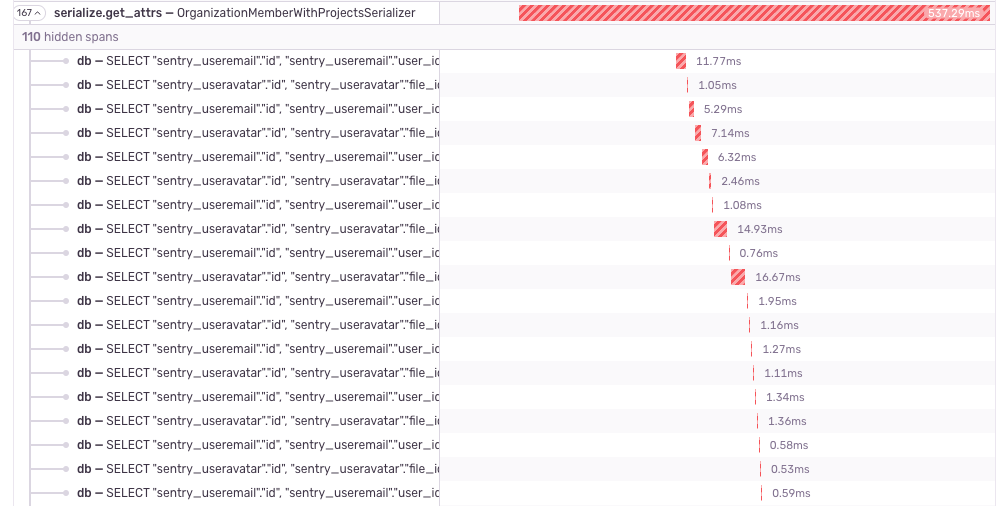
While the existing N+1 DB Query performance issue allowed us to detect a single repeating database query, we can now also detect patterns where the N repeated queries are interspersed with other repeating work.
For example, an MN+1 DB query could be a series of two repeating queries that occur when returning a list, such as getting a user’s email or avatar by user ID. All of these queries could be grouped into two batched queries that fetch the relevant data for all of the user IDs.
Sentry points out these MN+1 issues in your application, so you fix them and not only reduce execution time but also prevent database overload (from your N+1s left unhandled and queries that keep running in a loop).
Note: any sets of repeating queries identified by this detector will be labeled as N+1 DB queries in Sentry; the main difference is that you may see more N+1 issues proliferated in your issues feed.
Slow Database Query
SELECT query statements that take >1000ms.
The Slow DB Query issue identifies expensive SQL queries in your application that take more than 1000ms to resolve. An issue is created only if the query consistently breaches the 1000ms threshold, i.e. if the same query is detected as a slow query in 100 events within a 24-hour period.
Slow database queries when left unchecked can lead to poor database response times and frustrating user experiences — whether it’s seeing spinners or being stuck on loading screens. Exploring the Slow DB Query performance issue in Sentry, you can prioritize fixing those that occur on transactions with many events and users. Read here for ideas on how to actually fix your slow DB queries once you see one in your issues feed.
Mobile Performance Issue
For the mobile developer, minimizing time-to-user interaction helps prevent users from abandoning your mobile app due to poor performance. Sentry now detects File I/O on Main Thread issues to help you protect mobile user experience. We surface any File I/O errors, i.e. long-running operations that can block the whole UI when present on main thread, in your app. This can prevent App Hangs and Application Not Responding (ANR) errors, thus improving the stability of your mobile app.
Conclusion
With several new performance issues across the frontend, backend, and mobile, Sentry's mobile error monitoring tool alerts you in real time to the most critical code-level performance problems in your application — so you can take immediate action for triaging and resolution.
As long as you’re sending transactions to Sentry, you’ll be able to get Performance Issues at no additional cost or setup. Get started today by applying the filter issue.category:performance to see all of your performance issues in your issues feed.
If you’re not already using Sentry Performance, check out our docs to get started with just 5 lines of code. Check out our AMA livestream to learn more on how to start seeing and solving your performance issues with Sentry.
You can also give us a holler on GitHub, Twitter, or Discord. And if you’re new to Sentry, you can try it for free today or request a demo to get started.


