Leveraging our new User Feedback widget to improve our Performance product
Leveraging our new User Feedback widget to improve our Performance product
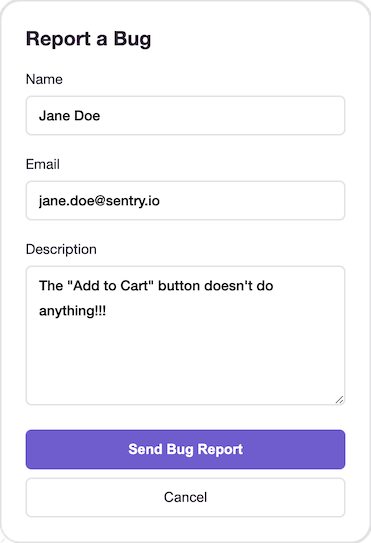
While Sentry can automatically detect unhandled exceptions, poor performance, and even signals of user frustration such as rage clicks, there are some problems that only a human can identify. This is where Sentry’s new User Feedback widget can help.
With this widget installed, you can collect feedback from your end-users when they run into sneaky issues in your app, and have that be linked to rich debugging context in Sentry (i.e., replays, errors, device/OS they were on, etc.) so you have all the info at your fingertips to fix the bug at hand.
The Feedback widget is especially helpful for small development teams looking to rapidly iterate on their product, providing developers direct insight into user frustrations and feedback.
Everyone at Sentry cares deeply about the user experience and given we recently launched a number of new Performance workflows (Queries, Web Vitals, Resources) we’re eager to see the feedback from developers using these new features. Dogfooding our new User Feedback widget is a great way for us to find out if there are any deficiencies in the UX or edge cases that we missed. Here are some anecdotes of what we learned from listening to developers, and how we were able to create a much more polished user experience.
No user left behind: handling edge cases
After setting up the widget, we set up Slack alerts so the whole User Feedback team got notified every time someone wrote to us.
Queries edge case: Hexadecimal SQL table names
Queries allow you to drill down from high-level query metrics across your database to individual slow queries with affected endpoints.
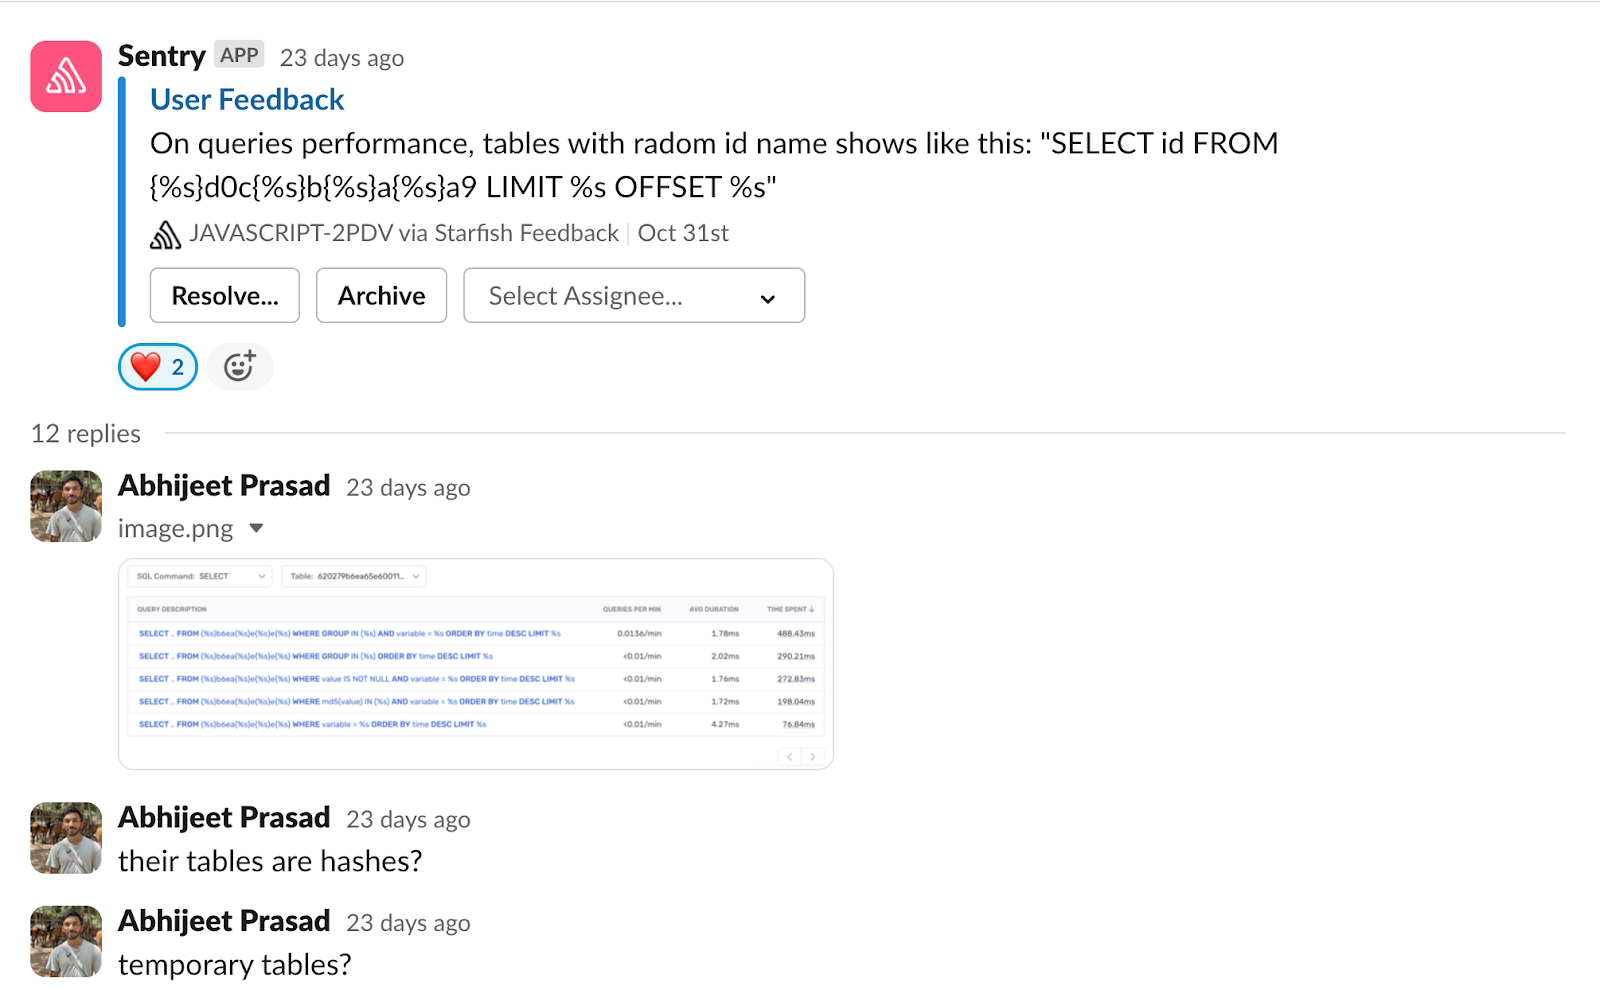
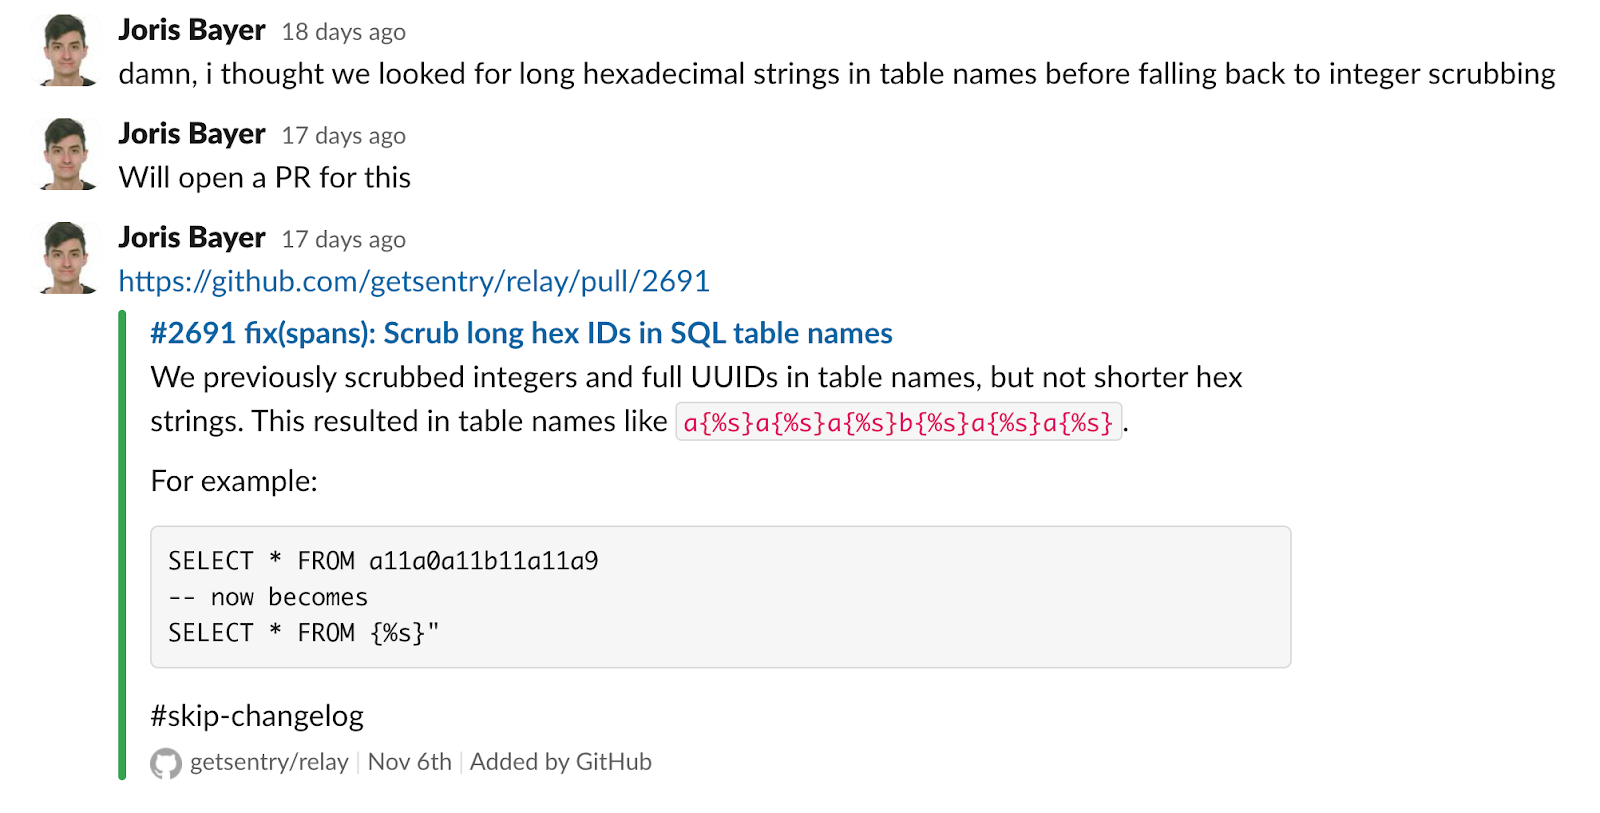
The feedback report shown above made us aware of an issue with our SQL parameterization algorithm where we were not accounting for hexadecimal SQL table names (which we didn’t even think of as a possibility).
We immediately deployed a fix in our ingestion pipeline to account for it. Now, we can group our queries more accurately, giving you more precise performance data.
Firewall edge case: injected HTML
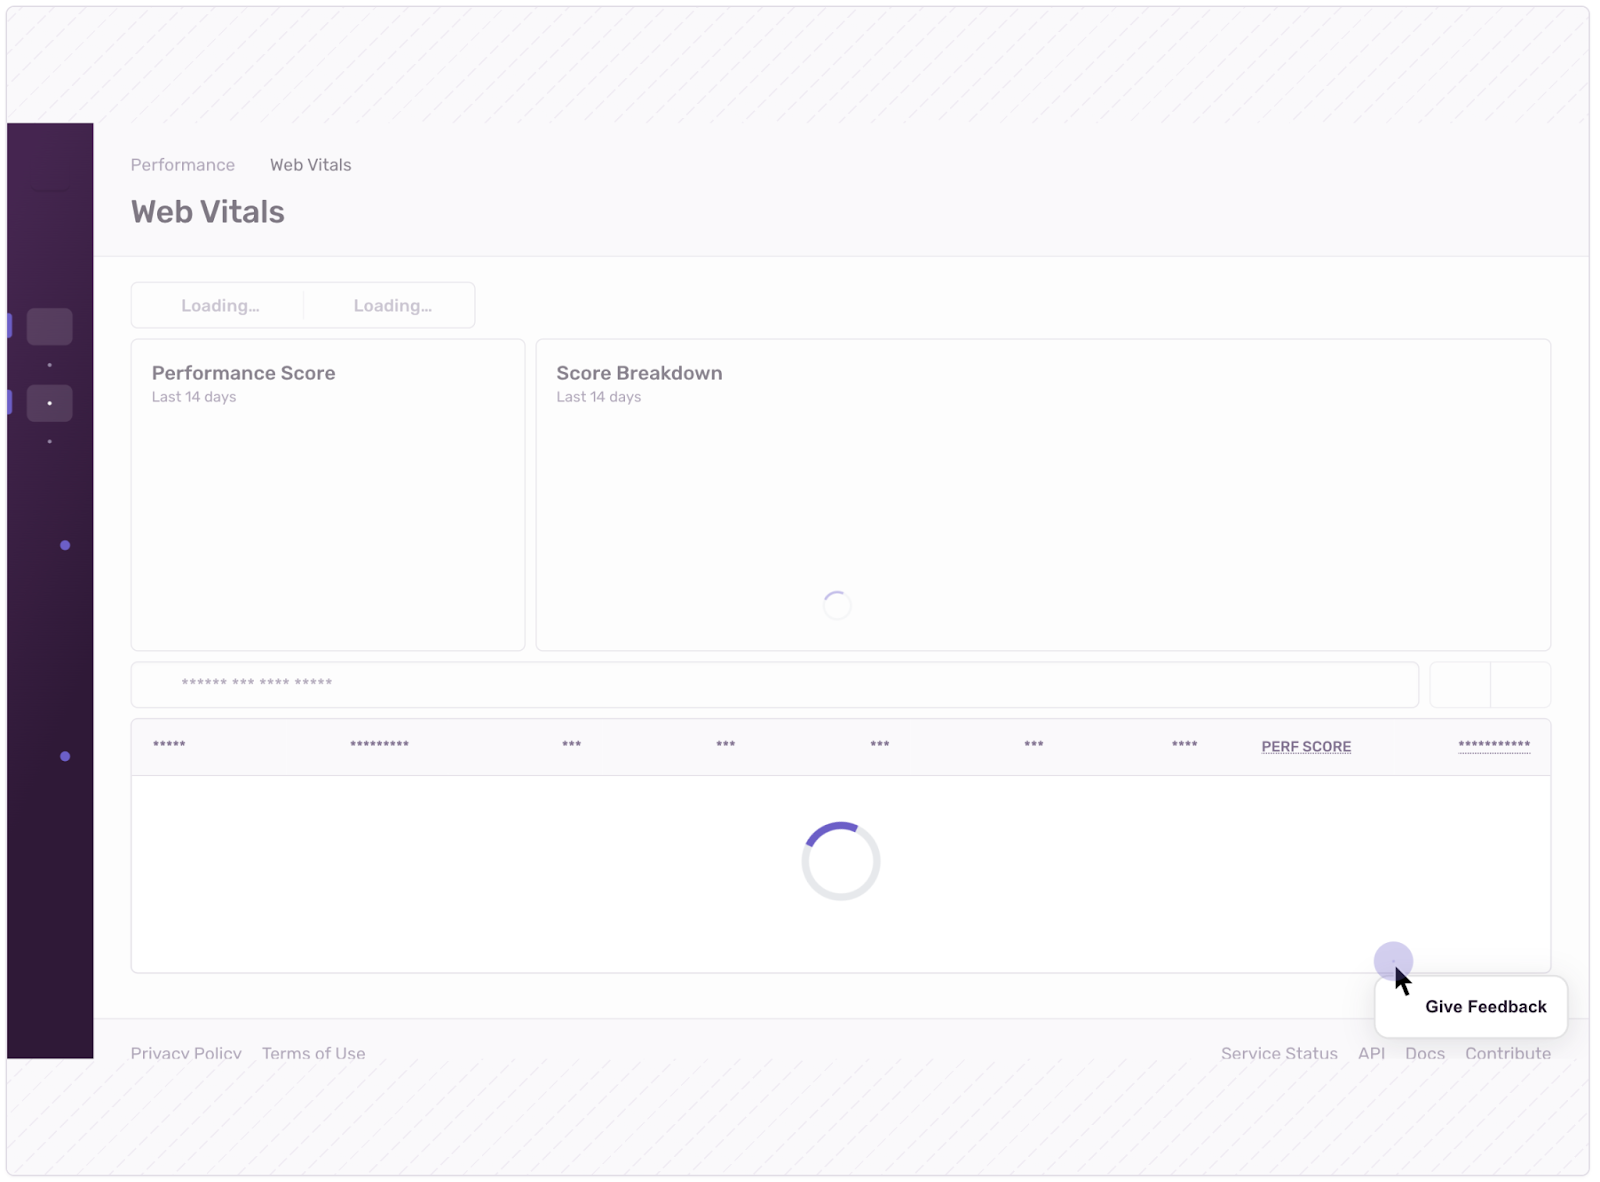
Another much more serious edge case caused a user to be stranded on an infinite spinner.
No surprise, but since we’re also using Session Replay, we took a look at the replay linked to this feedback report to see exactly what was happening on the user’s machine.
We suspected some downstream requests were the root of the problem, so we checked out the Trace tab from the Replay Details page and saw the exact transaction executed when the spinner started. Digging into that page load transaction, we combed through all the HTTP requests being made to see if there was anything suspicious.
The span status indicated there was an error, which confirmed that the loading spinner issue was because HTTP client spans were failing. The metadata on the error revealed that the user’s Firewall setting was injecting HTML at the end of our JSON responses. You can see the step-by-step repro on this thread.
Educational gaps in the UI
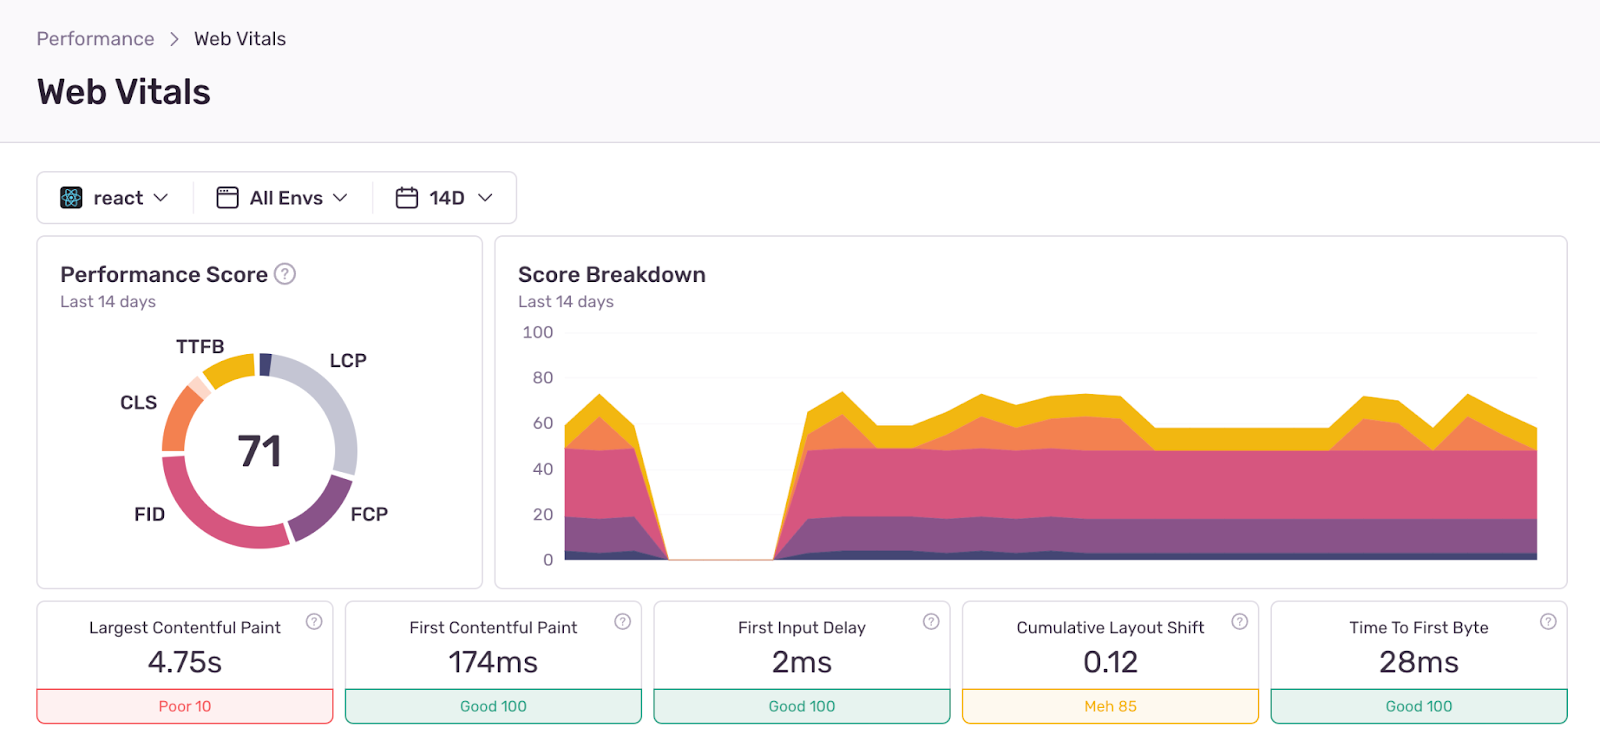
In the latest Web Vitals module, we display tiles of the 5 core Web Vitals and a performance score:
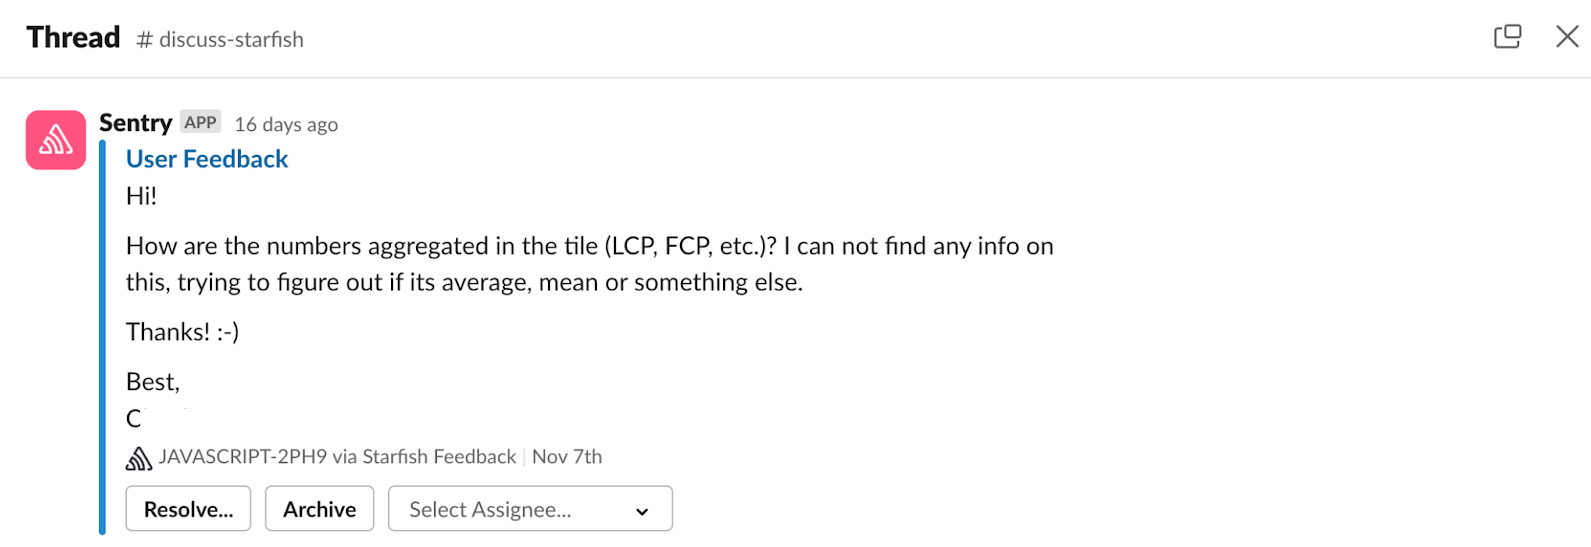
However, through user feedback we realized it wasn’t clear what the Web Vital value represents. Is it an average, percentile, or something else?
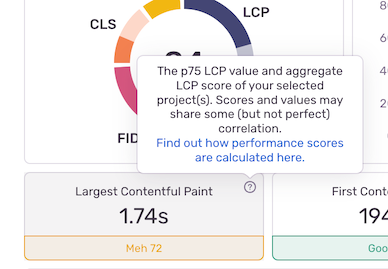
We have docs on what values are being displayed and how performance scores are calculated, but our user wanted more clarity around what specific values each UI component represented. After all, there is a big difference between the p99 and p50 of a metric. As a result, we updated our docs to include more detail, and we added a helpful tooltip in the product on the tiles, so everyone can see what calculation we’re using, right next to the metric itself.
How to get started with the User Feedback widget
Our User Feedback widget is in Beta but ready for you to use and available on all web-based platforms. Simply add the Feedback integration to your Sentry.init call and read up on all our different customization options for the widget.
Sentry.init({
dsn: "__DSN__",
integrations: [
new Sentry.Feedback({
// Additional SDK configuration goes in here
colorScheme: "light",
}),
],
});Interested in learning more or have product feedback? Drop us a line in the #user-feedback Discord channel or on this GitHub discussion. And, if you’re new to Sentry, you can try it for free or request a demo to get started.

