Laravel just works. Now your performance monitoring does too.
Laravel just works. Now your performance monitoring does too.
You remember that first time spinning up a Laravel app? Routes, auth, ORM, queues, all wired up without much effort. It’s one of the reasons Laravel feels productive out of the box.
But when something starts slowing down, an Eloquent query drags, a job takes forever, or cache misses creep up, it’s not always obvious where to look. Laravel gives you the tools, but connecting the dots between them is usually on you.
With Sentry’s new Laravel Insights, you get a clearer picture of what’s happening inside your app. It surfaces errors, slow jobs, database queries, cache usage, and route performance, and ties it all back to the issues you’re already tracking - and how they’re actually affecting your users. Everything’s connected: see how a slow job came from a specific route, which query caused the slowdown, and whether caching helped or hurt.
Proactively optimize your Laravel app
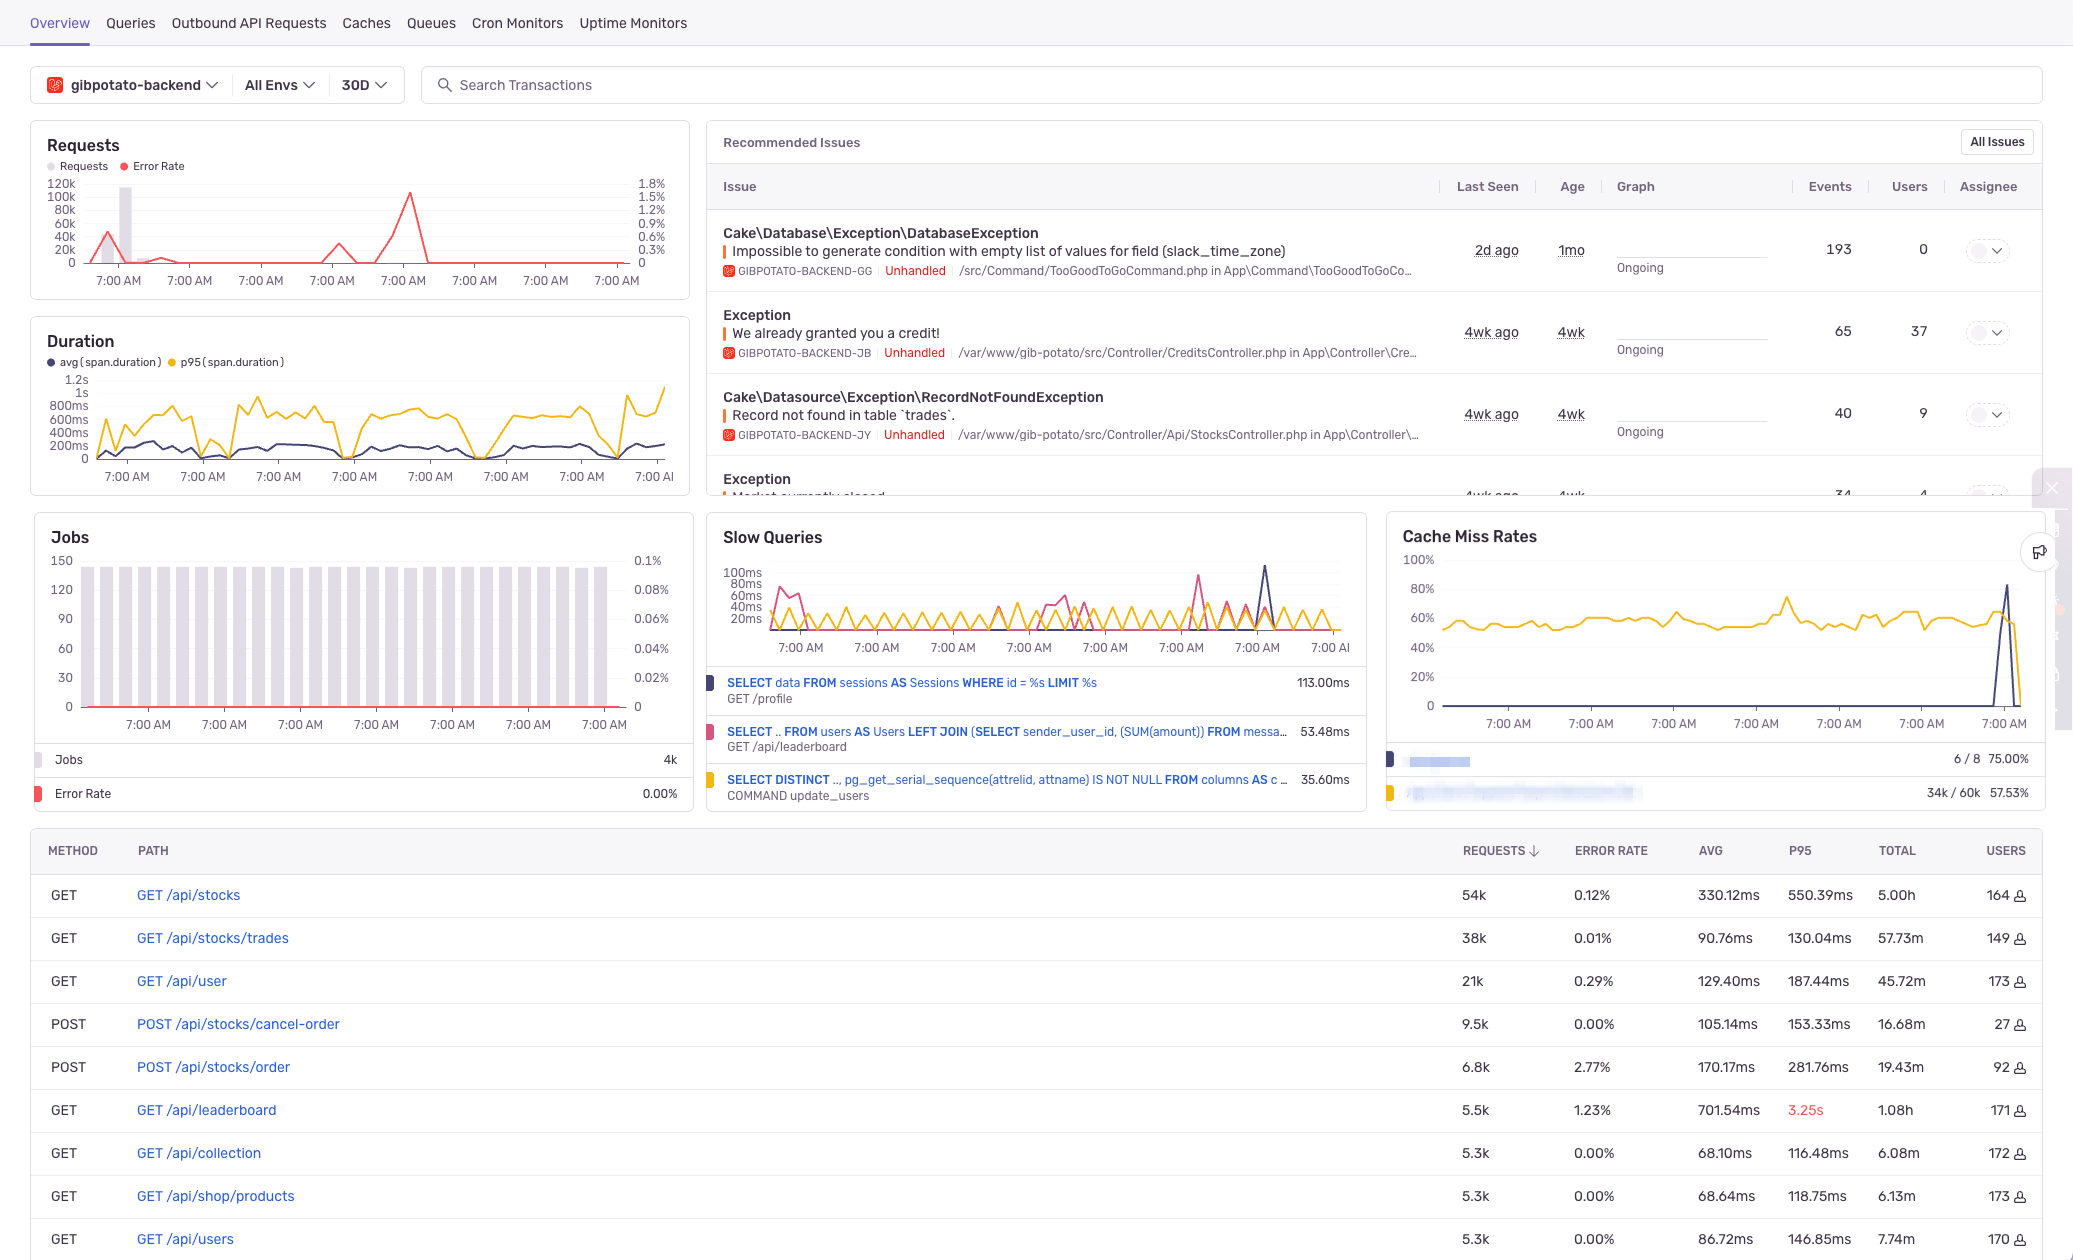
This isn’t a new product, or even a new tab. As long as you have a Laravel app set up with basic Sentry instrumentation (errors and tracing), just open a Laravel project under Insights → Backend to see:
Recommended Issues: New and escalating issues across your production app
Requests & Duration: Track load spikes and app performance across releases to see if you’ve introduced any regressions
Jobs: Monitor trends in duration and failure rates for backend jobs to make sure your SendWelcomeEmail::dispatch($user); is always on time
Queries: Spot costly DB calls and optimize transactions
Caches: Find cache miss hotspots and fix invalidation issues
Routes: Sort by requests, users, total time, and pXX durations to catch slowdowns early
Whether you’re solo shipping or scaling a startup, these insights make it easier to see how your app behaves — and fix problems before customers notice.
Explore deeper and create alerts
If you spot something weird - a sudden spike in cache misses, a rogue query eating all your DB time, a queue that looks suspiciously backed up - you can dig in deeper with just a click.
Every widget in Laravel Insights lets you "Open in Explore”. Click the dropdown, and you’ll jump straight into Sentry’s query builder, where you can:
Customize the query to zoom in on a specific service, route, user, or environment
Group by attributes like browser type, user account status, request origin, or any other tags (default or custom) you're sending to Sentry
Spot patterns that would be invisible in a high-level graph
Create alerts based on any condition you want, from slow queries grouped by premium users to job failures clustered by deployment region
Instead of reacting after a customer complains, you can proactively route alerts to the right team, or even fire off Slack/Discord notifications when thresholds are crossed.
It’s fast, it’s flexible, and it’s the same Laravel-style philosophy: give you a solid starting point, but let you go as deep as you want without fighting the tooling.
Going beyond your Laravel stack
I can hear you asking: What if my app uses more than just Laravel?
Laravel is popular for streamlining the backend busywork, but lots of apps don’t stop there. Whether your frontend is built with vanilla JS, React, Next, Inertia, or even good old Blade templates, Sentry ties it all together. That means no more chasing errors across different monitoring tools or guessing if a frontend issue triggered a backend job failure.
With full-stack distributed tracing, you can:
Follow a user’s session from a click in the browser to the exact database query and cache it triggered
Connect a slow API response in Vue to a failing job in Laravel, and see exactly which line of code caused it
Spot which routes are delivering the most frontend errors, slow page loads, or layout shifts
If you’ve already instrumented both the frontend and backend with Sentry, these connections are automatic with some basic tracing configuration. So when performance tanks, you’re not just stuck asking “frontend or backend?” - you’ll know.
Common Laravel issues, solved
Let’s say you’ve got a queue for checkout jobs that handles sending receipts, logging transactions, and triggering payment flows. Everything’s fine until your revenue drops, just as job durations spike.
Now, instead of guessing, you open the Jobs panel in Laravel Insights, hit “Open in Explore”, and customize the query:
span.op = queuespan.description = checkout.processGroup by:
payment_provider
Now you’ve got a breakdown of job duration by provider. You notice jobs routed through FastPay are taking 3x longer than the others. From there you can:
Create an alert when checkout.process jobs tagged with payment_provider:FastPay exceed 2000ms
Route that alert to your team’s Slack channel or issue trackerAdd that view to a custom dashboard so you can monitor it over time
No extra logging. No spinning up a new dashboard from scratch. Just a few clicks to go from “something’s off” to “here’s exactly what’s wrong.”
Note: you'll need to have these attributes (payment_provider etc.) added in your code via span attributes.
Out-of-the-box visibility for your out-of-the-box framework
This fits right into our broader mission at Sentry: make your telemetry easy to instrument, digest, and act on. You shouldn’t need five dashboards, a whiteboard, and a hunch to know why your app is acting weird in prod. Laravel Insights is one more step toward making your app's behavior as transparent and understandable as the code you wrote to build it.
Want to see Laravel Insights in action? Join our Discord to talk shop with other devs and run Q&A by our Laravel SDK engineers, dive into the docs to get set up, or start your free trial and catch performance issues before your users do.


